

Weekend Update 7-12-20
Weekend Update 7-12-20
A look at the Major Indexes and Sectors

Good Morning!
In last weekend’s sector analysis update (link here if you missed it) I focused on the leading sectors of the markets. They all continue to show strength vs the S&P 500 (exception is Consumer Defensive - which HAS NOT shown much strength vs. S&P 500, but the chart is not as bad looking as the other sectors 6-11 discussed below) and they are:
through 5. (Technology, Healthcare, Consumer Cyclical, Basic Materials, Consumer Defensive)
Of these leading sectors, I’d like to highlight one of them today, which has just put in two back to back strong weekly candles and just broke out to new ATH’s on large volume.
Highlighted Sector: Consumer Cyclical Sector
Weekly Chart:
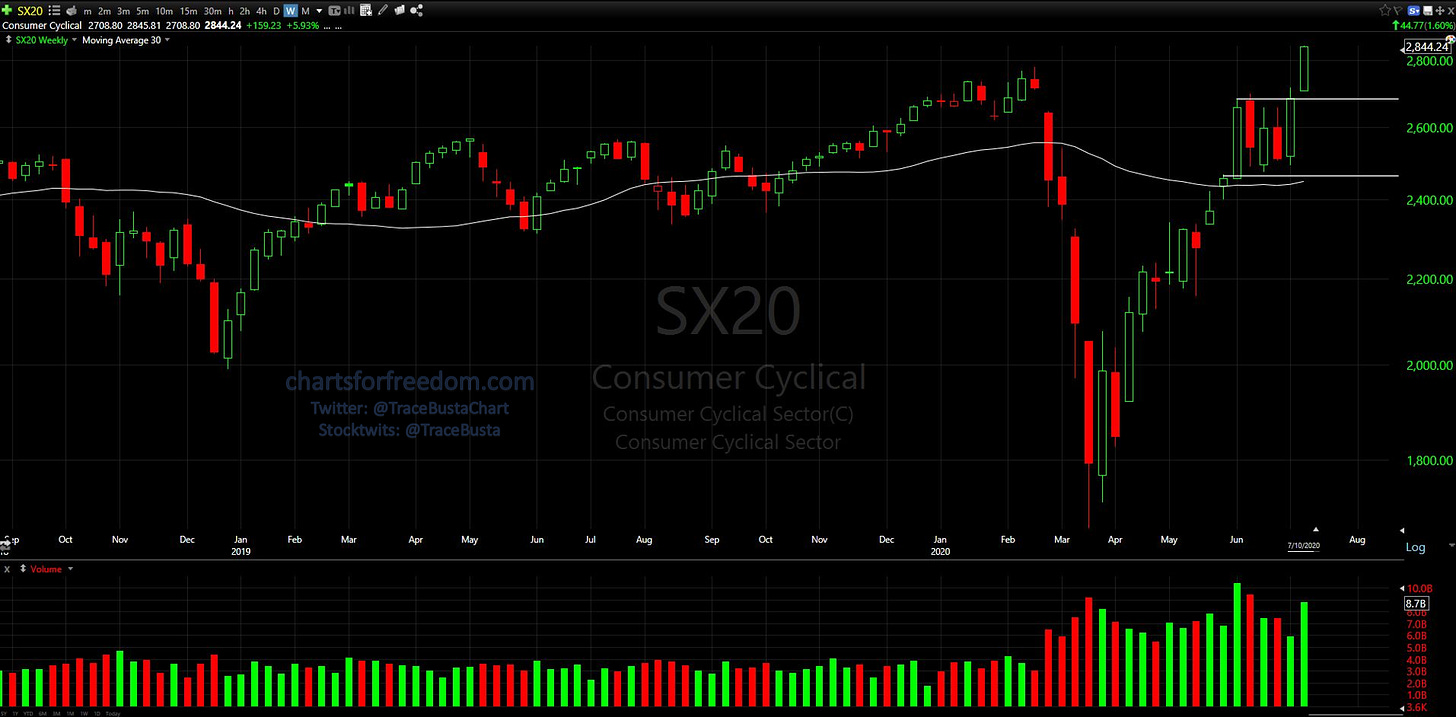
Breakout to ATH on high volume
Firm close at highs of week, well above prior range
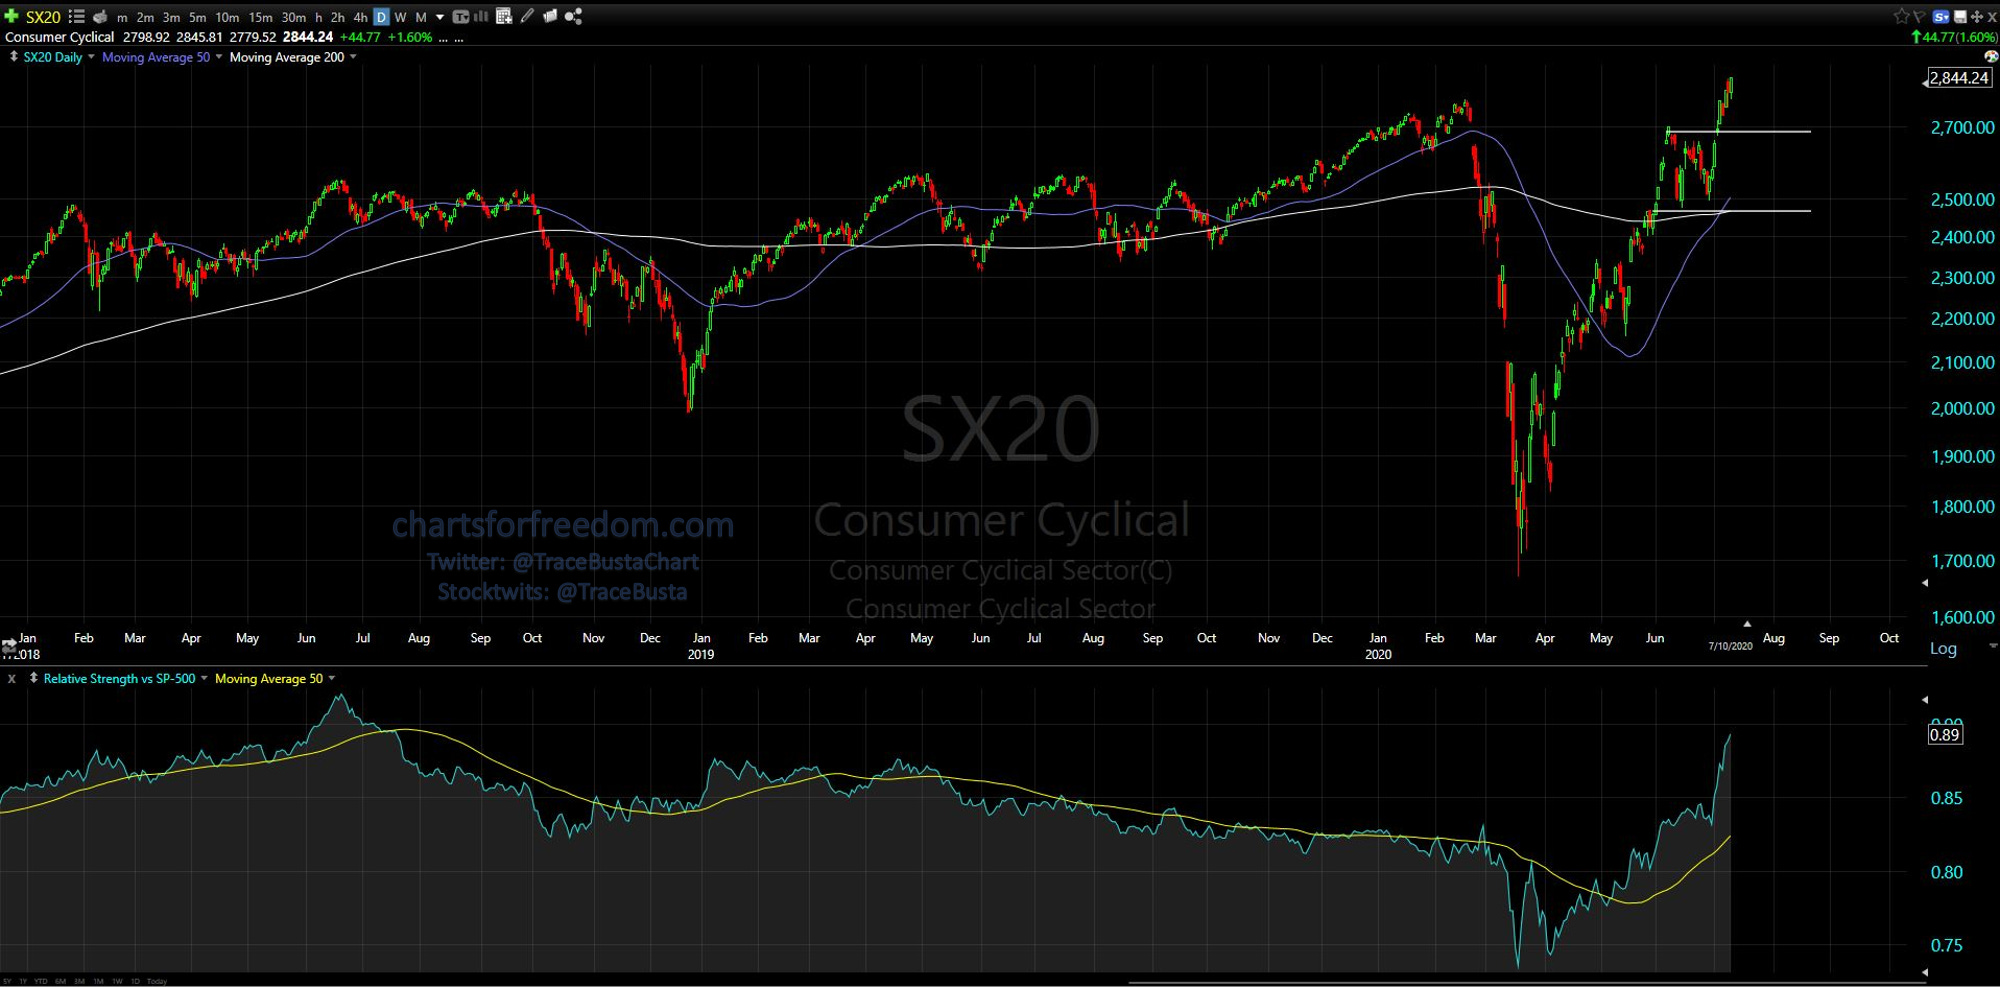
Daily Chart:

Relative strength vs. SPX is very noteworthy
Leaders in this sector that are coming up in my scans include: TSLA, MELI, AMZN, RH, CMG, PZZA, BABA, POOL, LULU, CVNA, JD & ETSY
I Have most of these charted, and will likely do the rest next week for reference. If I see anything noteworthy I’ll be sure to share it here for paid-subscribers. I have shared many TSLA, AMZN and BABA charts recently, below are a couple new names.
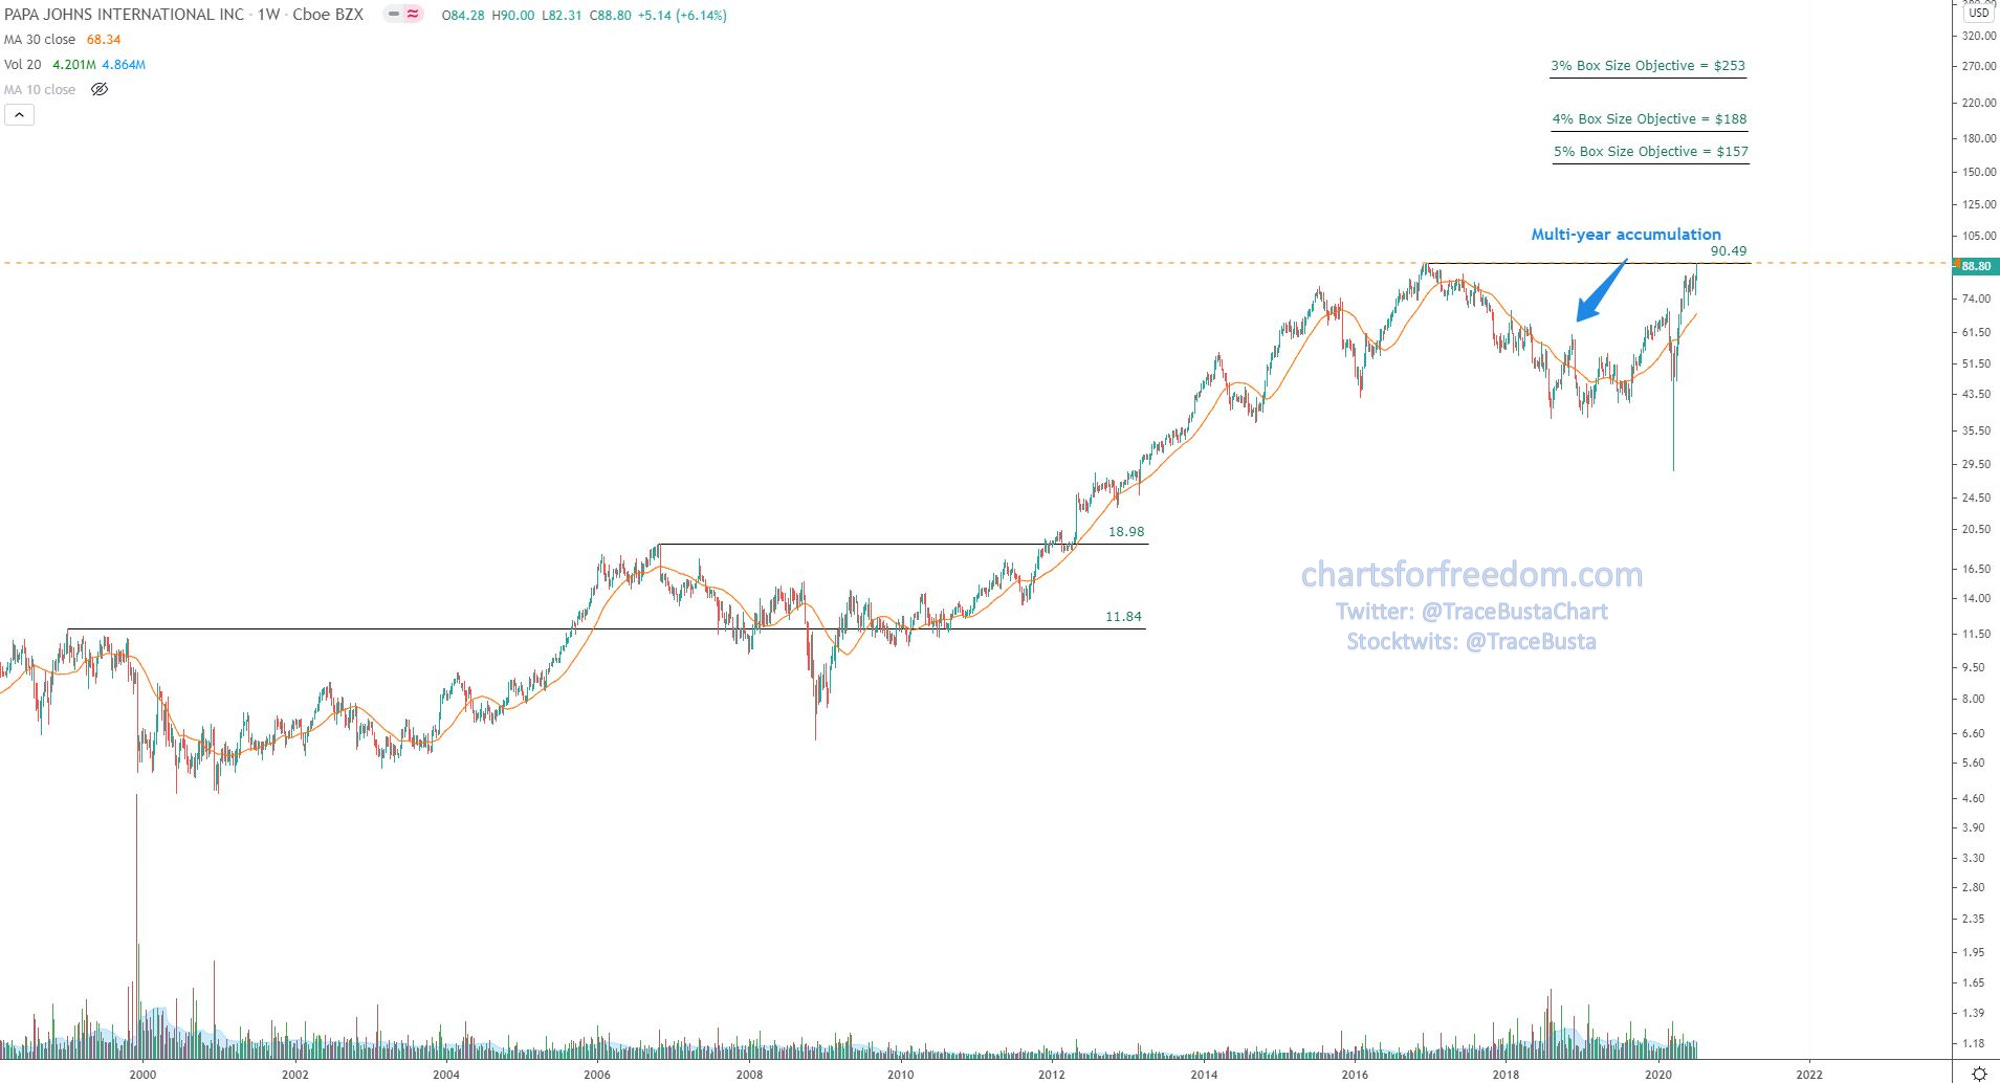
Weekly Chart of PZZA (Papa Johns International Inc / Restaurants):
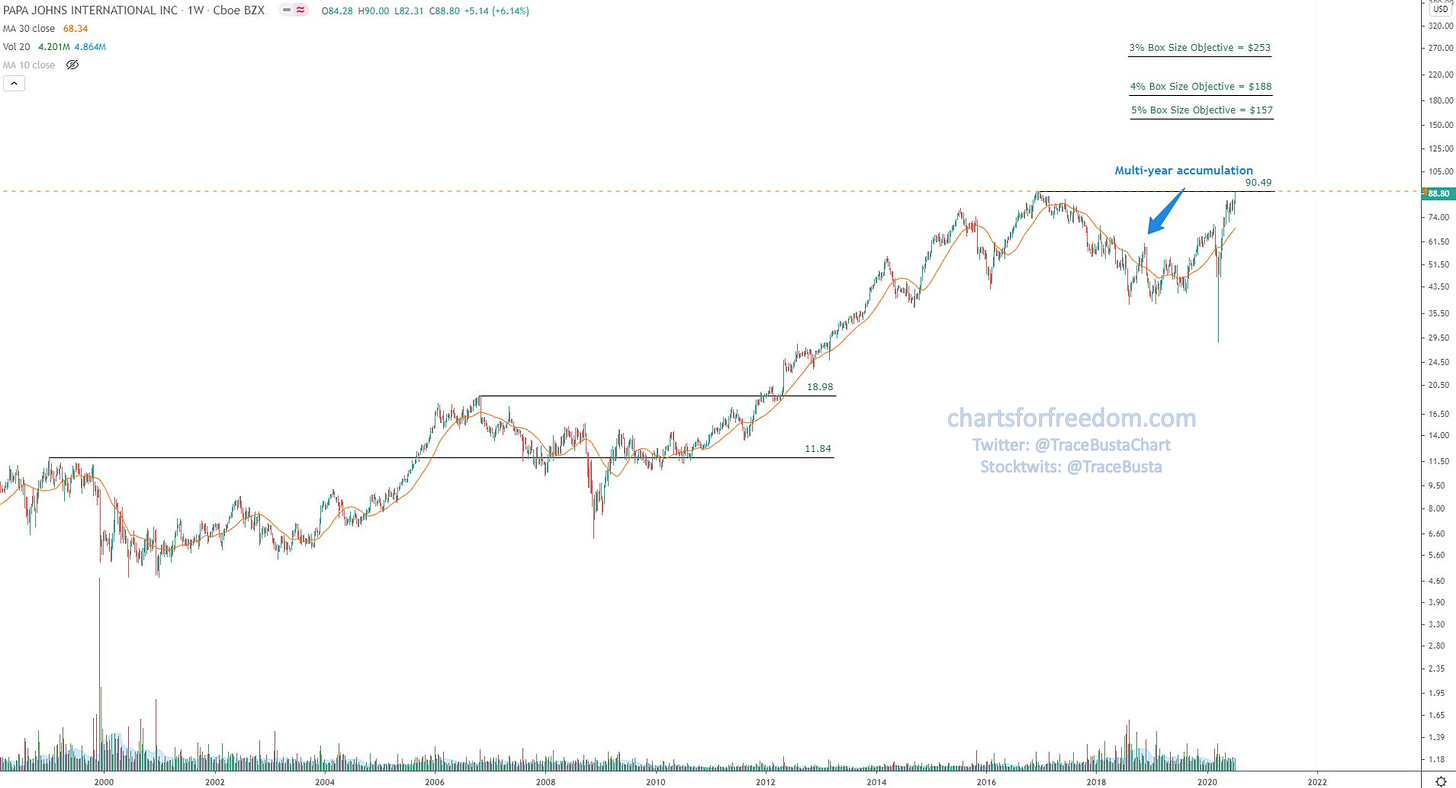
I like this setup for a potentially strong move higher. The upside PnF objectives are about 2x-3x higher from current prices. I have an alert set on this.
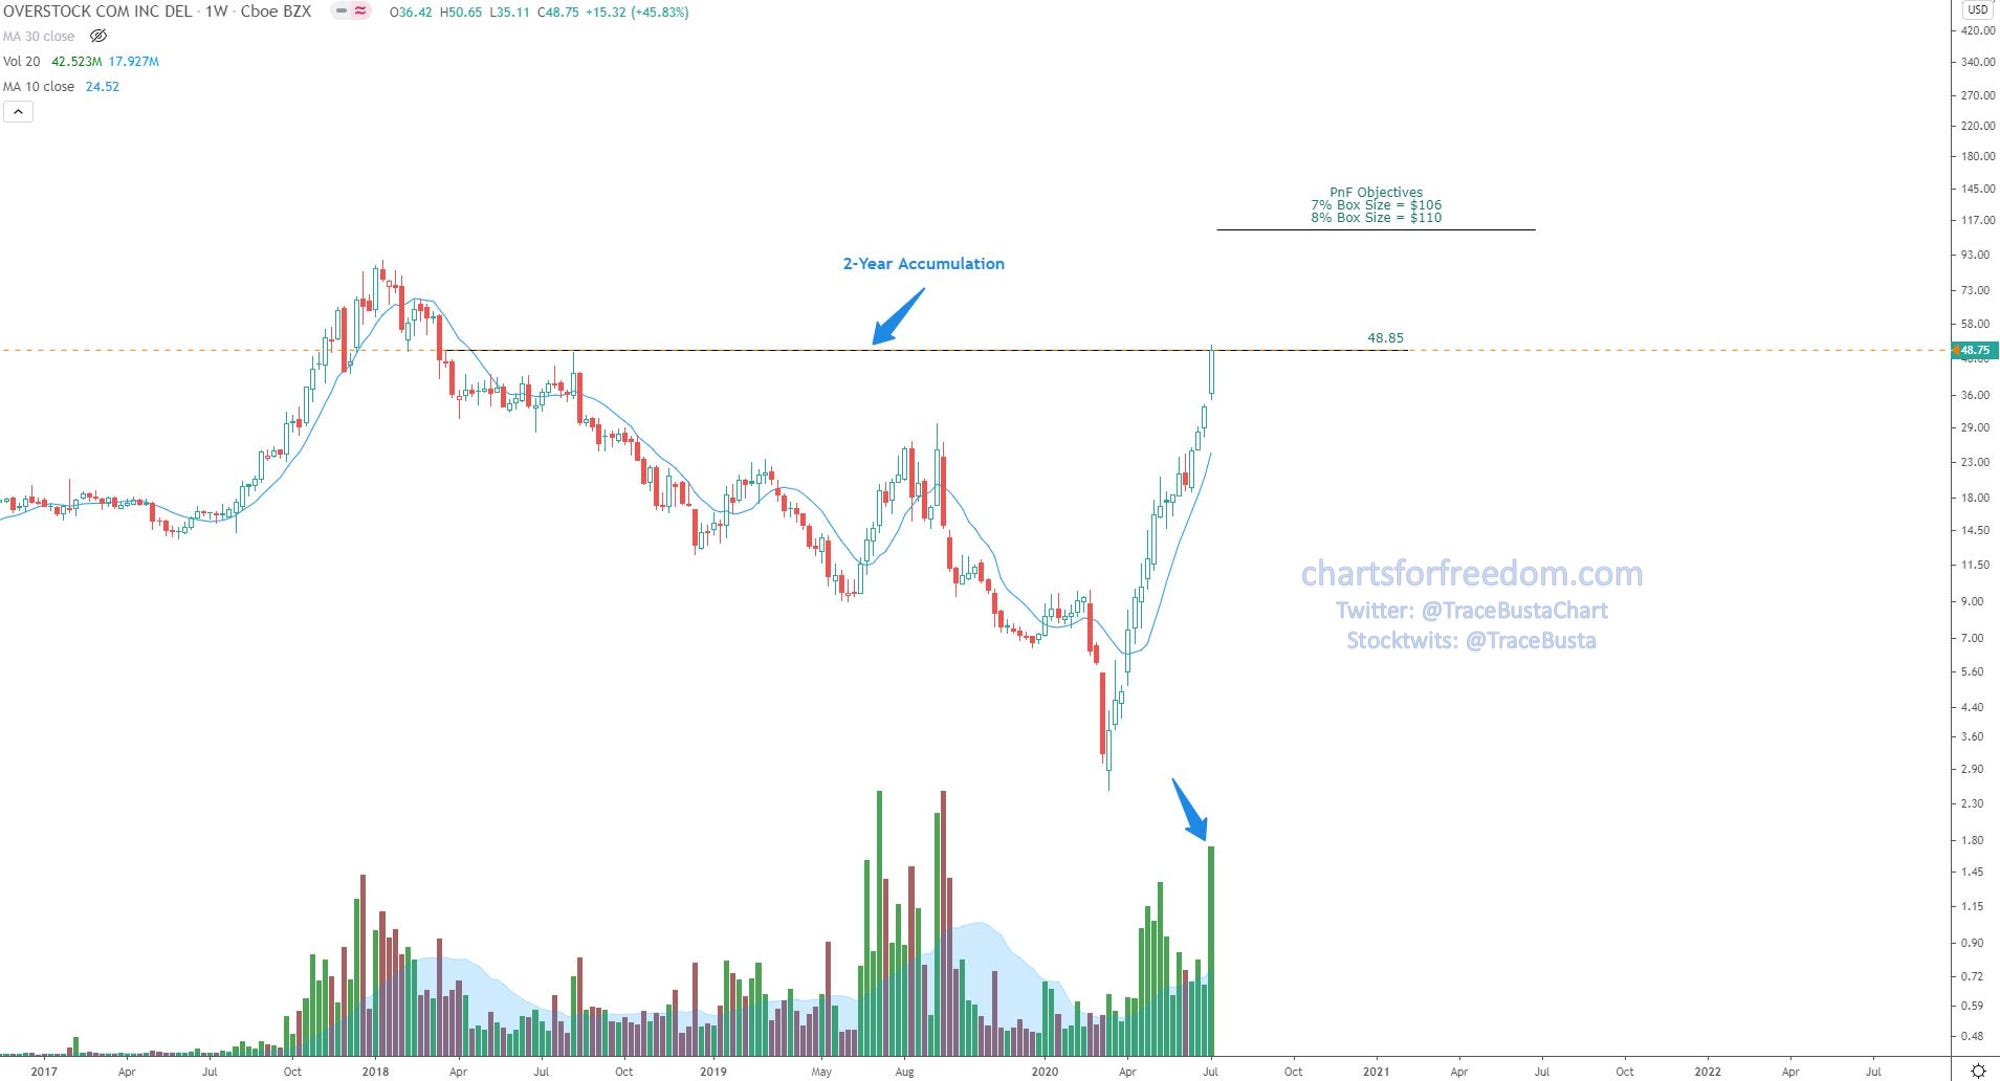
Weekly Chart of OSTK (Overstock.com / Specialty Retail Industry)
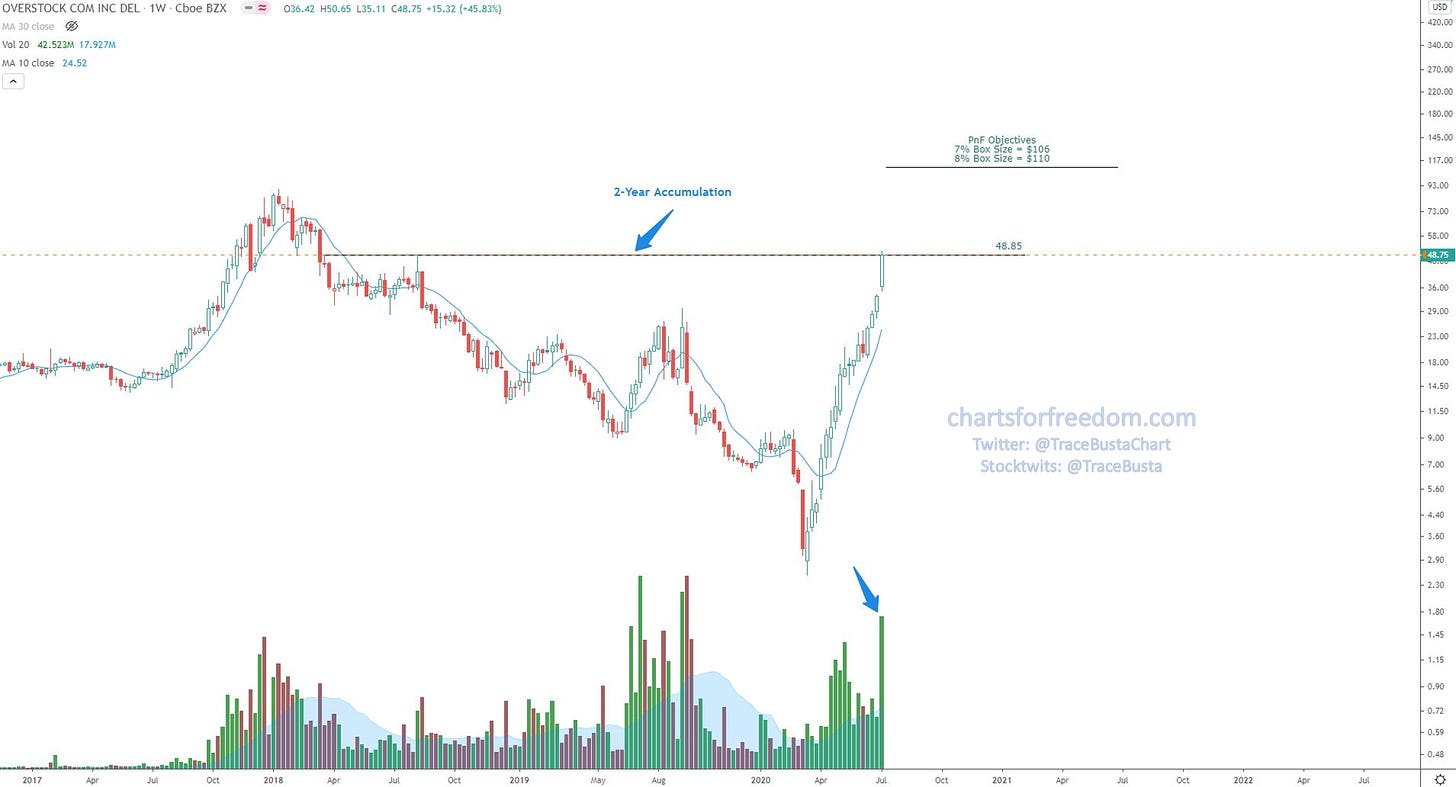
Another chart I like in this sector with a potential for nice upside objectives. I have an alert set on this.

This week I’ll take a look at the lagging sectors to see what is developing there. If these start to show signs of life, then we may just end up with a sustained rally in the overall markets. The expectation for overall markets (S&P 500, Dow Jones Industrials, etc.) is already bullish given the seasonality and election year cycle. Check out my “Election Year Cycles & Seasonality” post from last week if you didn’t see it.
So on to the lagging sector charts. All of these charts were last mentioned in my Jun 28 post “Market Health: The Good, The Bad, The Ugly And More!” Link. All of the lines I drew on the charts have remained the same, the only difference is the two new weekly candles since that post. As you can see, certain technical levels are so important and can be deduced from the charts quickly with experience. People that dismiss technical analysis are really missing out.
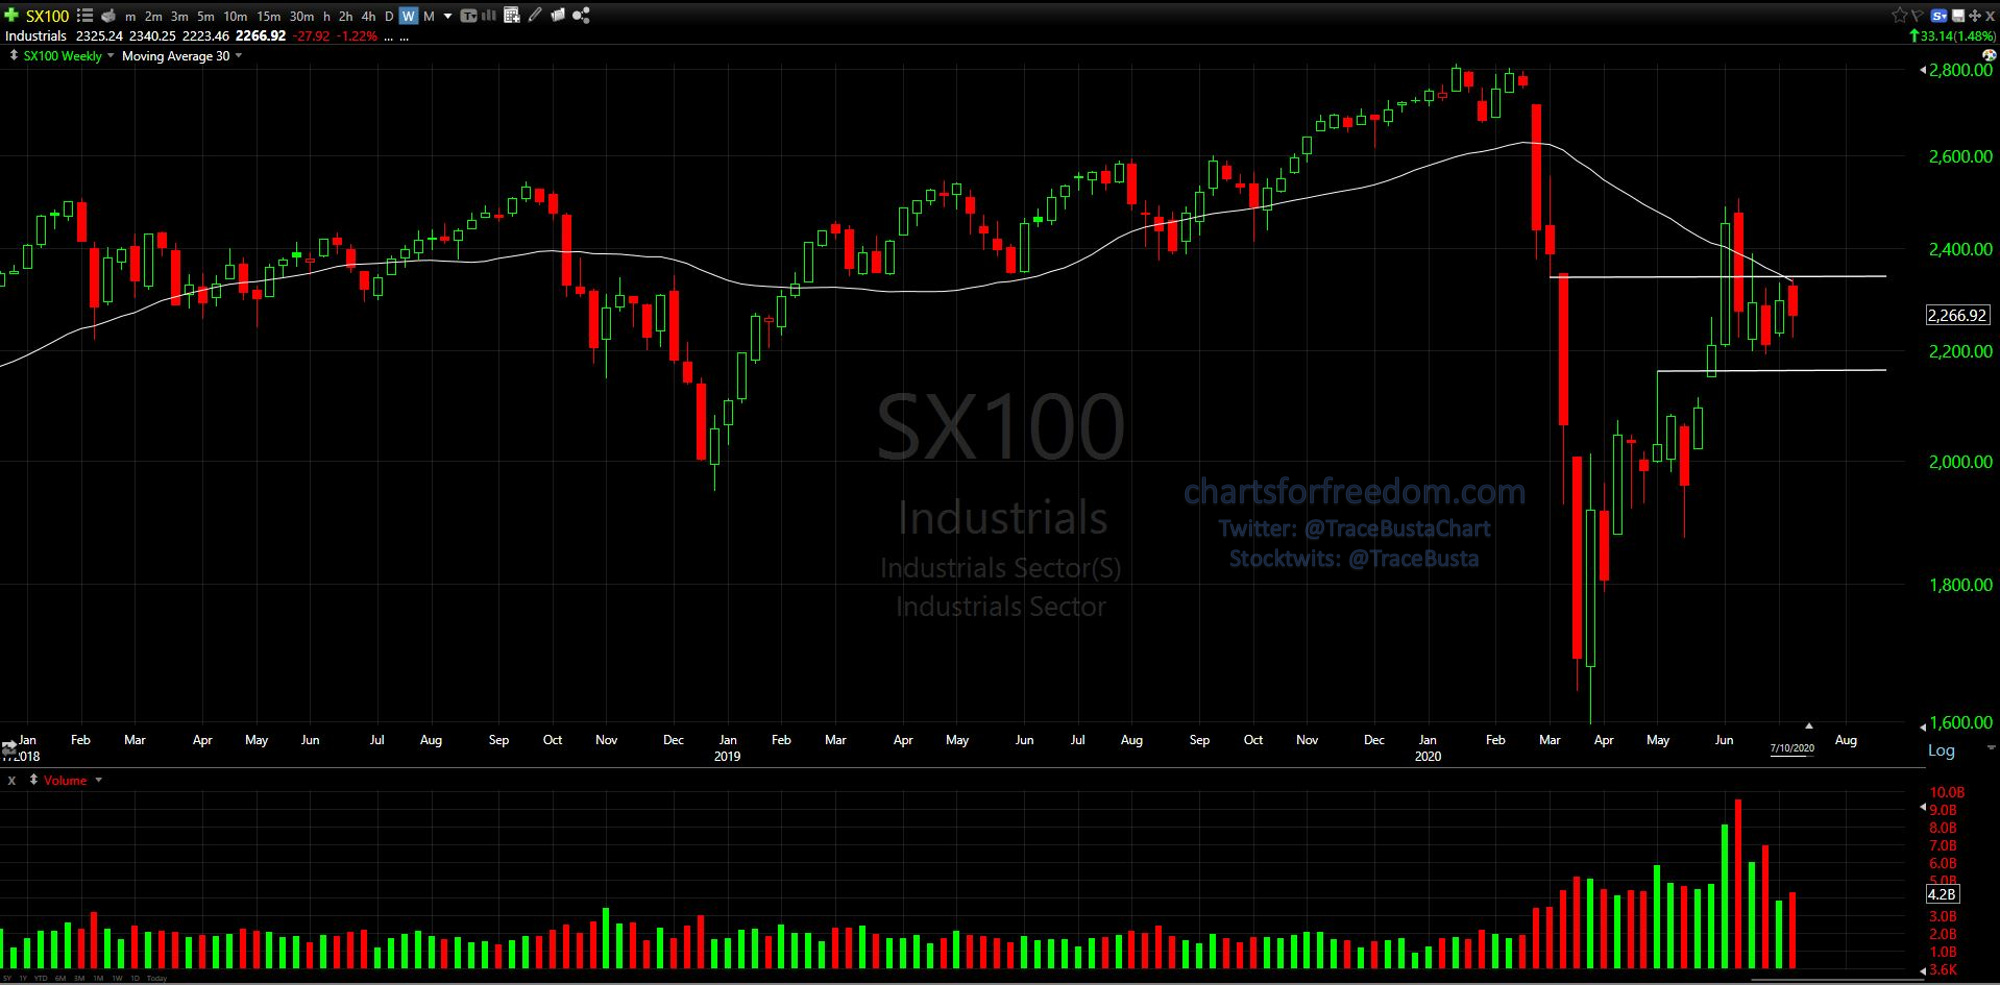
Industrials
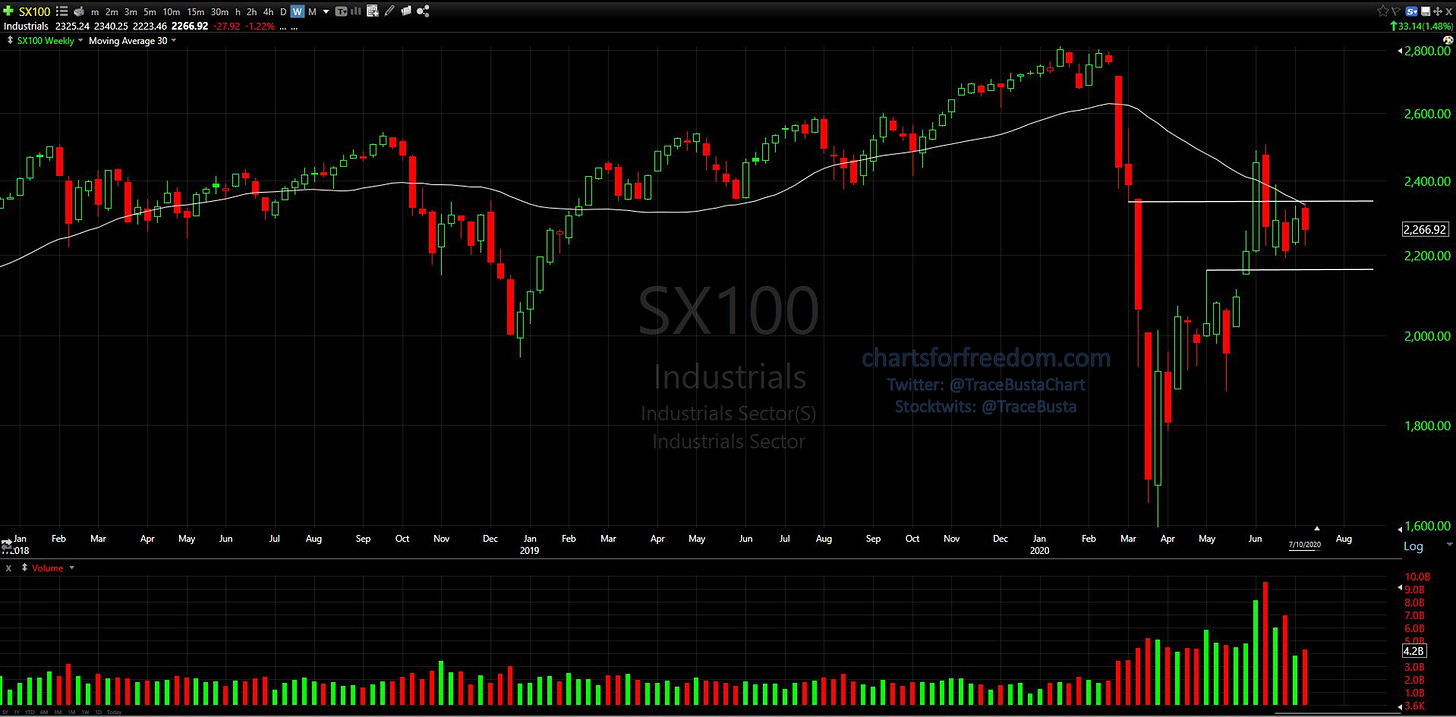
The line I drew (low wick from March 6 weekly candle) is now serving as double resistance with the declining 30-wk MA.
Some leading components in this sector with impressive charts coming up in my scans include:
SAIA (Trucking)
GNRC (Diversified Industrials)
ODFL (Trucking)
CYRX (Integrated Shipping & Logistics)
Real Estate
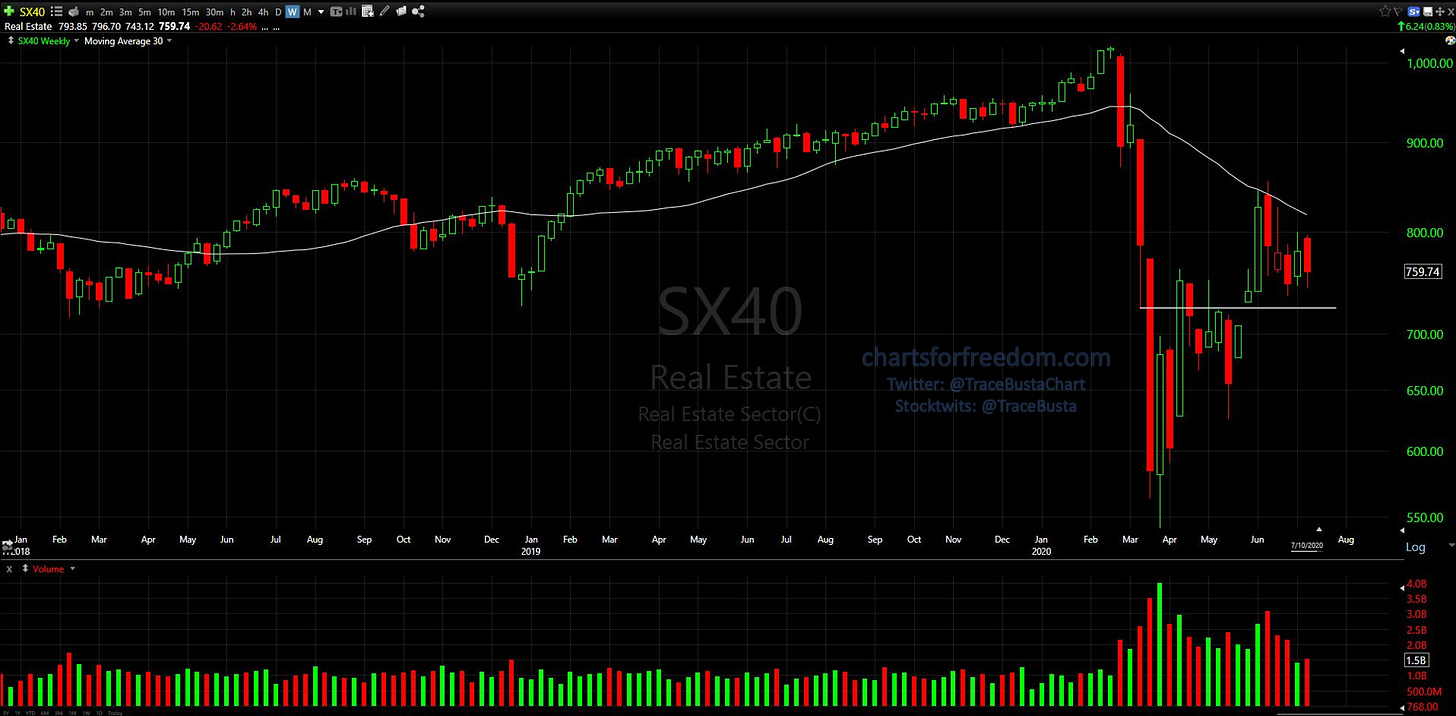
This has held above the support line, but still remains below the declining 30-wk MA.
There aren’t any components in this sector that are coming up in my scans right now.
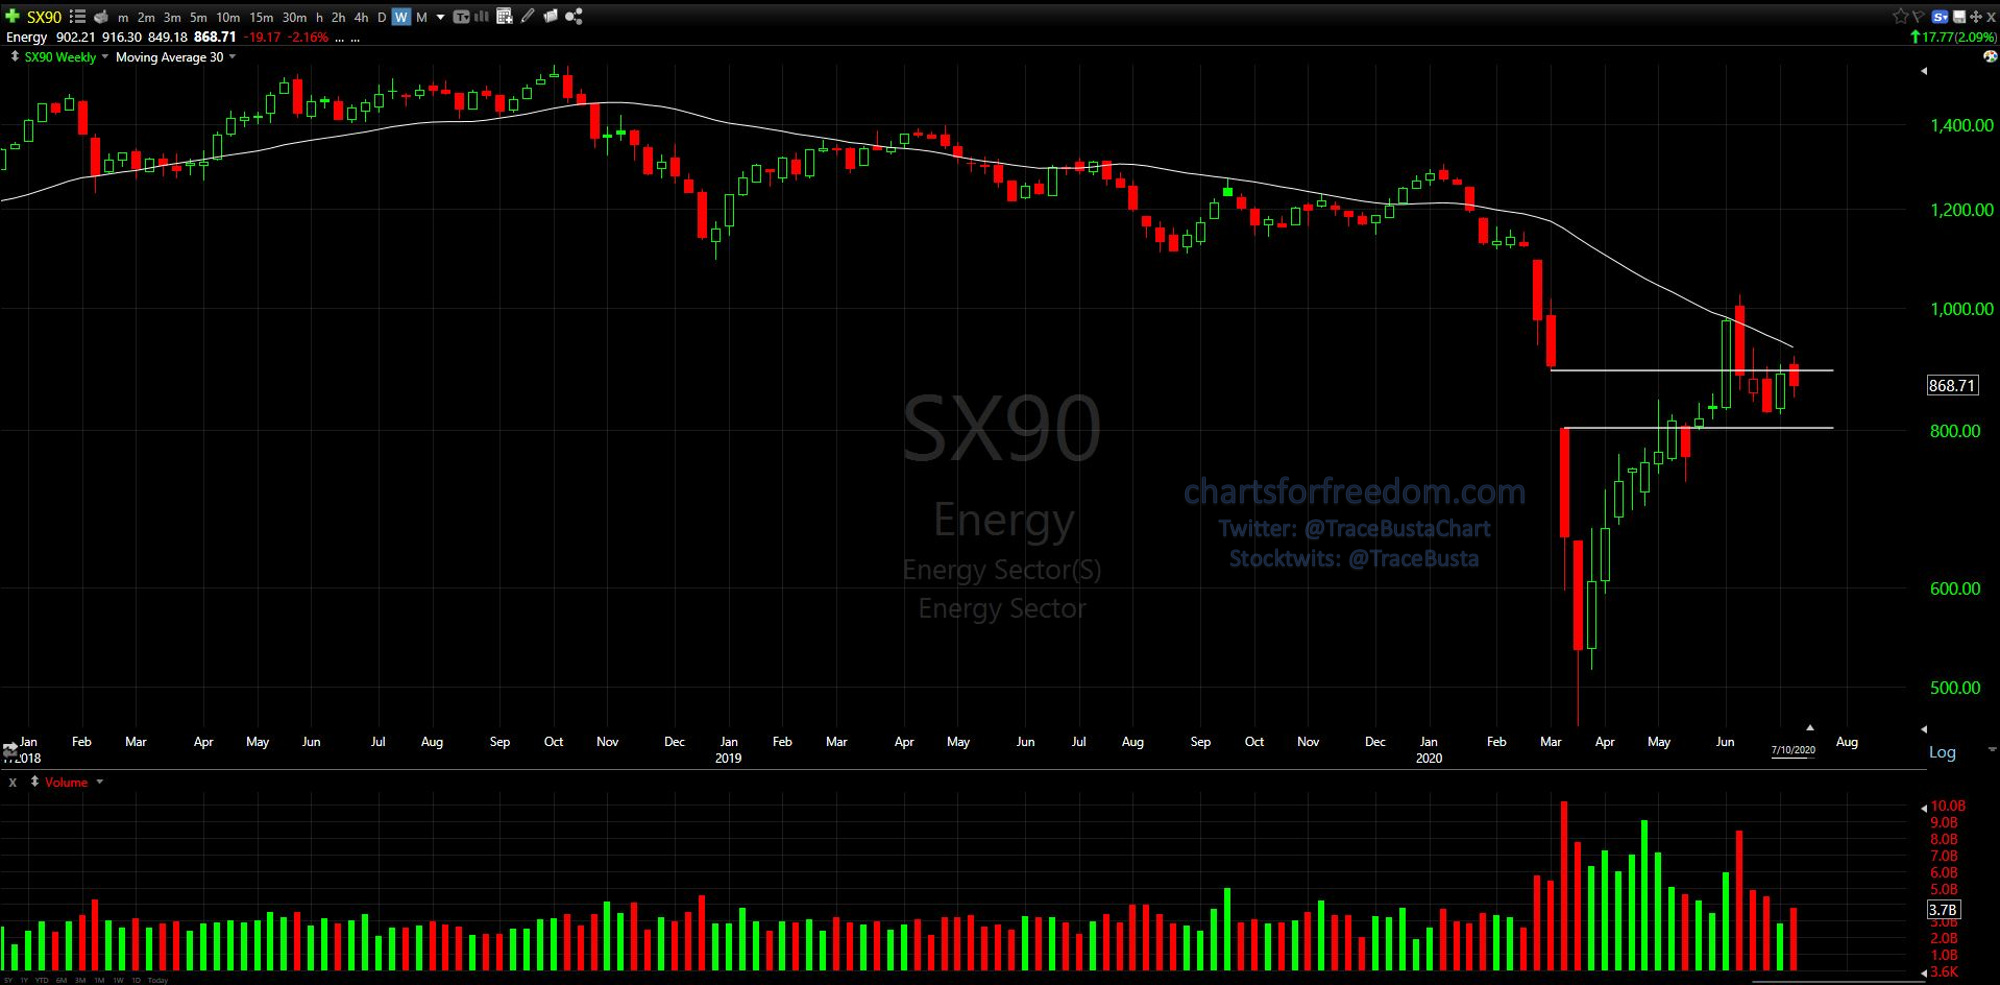
Energy
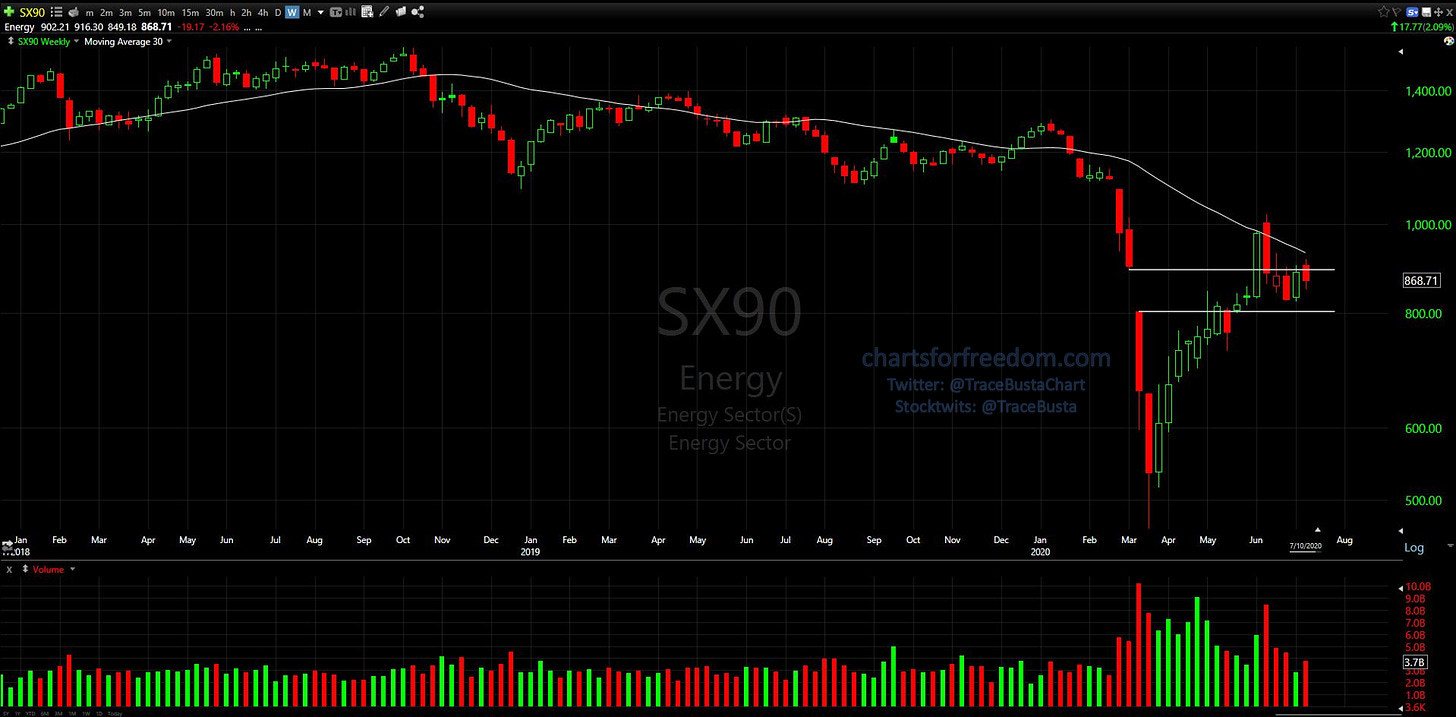
Again, the line drawn on the chart at the March 6 weekly low wick has served as resistance. The declining 30-wk MA is just above.
There aren’t any components in this sector that are coming up in my scans right now.
Financial Services
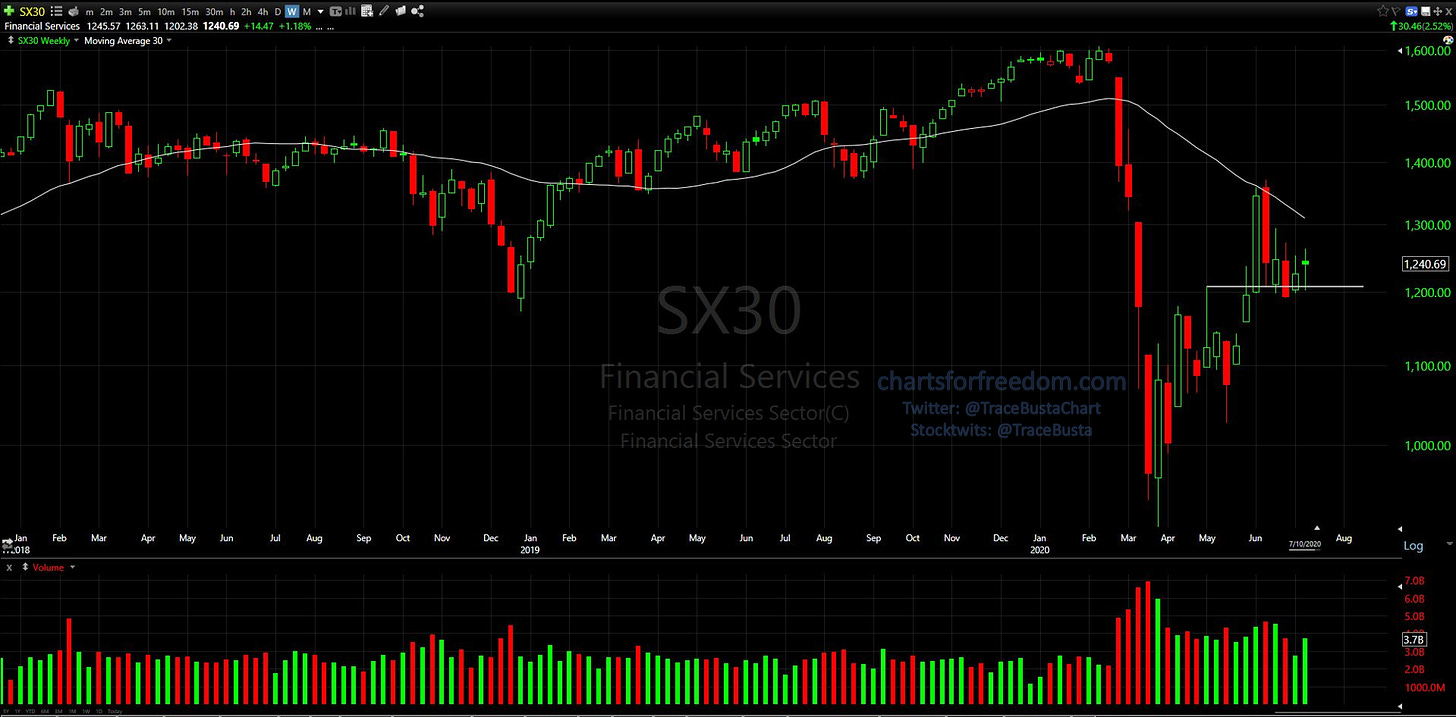
Price has been able to hold above the support line I drew (May 1 weekly high wick). If this level can hold, especially once price tests the 30-wk MA, this would have bullish implications in my opinion.
Some leading components in this sector with impressive charts coming up in my scans include:
PFSI (Specialty Finance)
PLMR (Insurance - Property & Casualty)
MSCI (Financial Data & Stock Exchanges)
MKTX (Capital Markets)
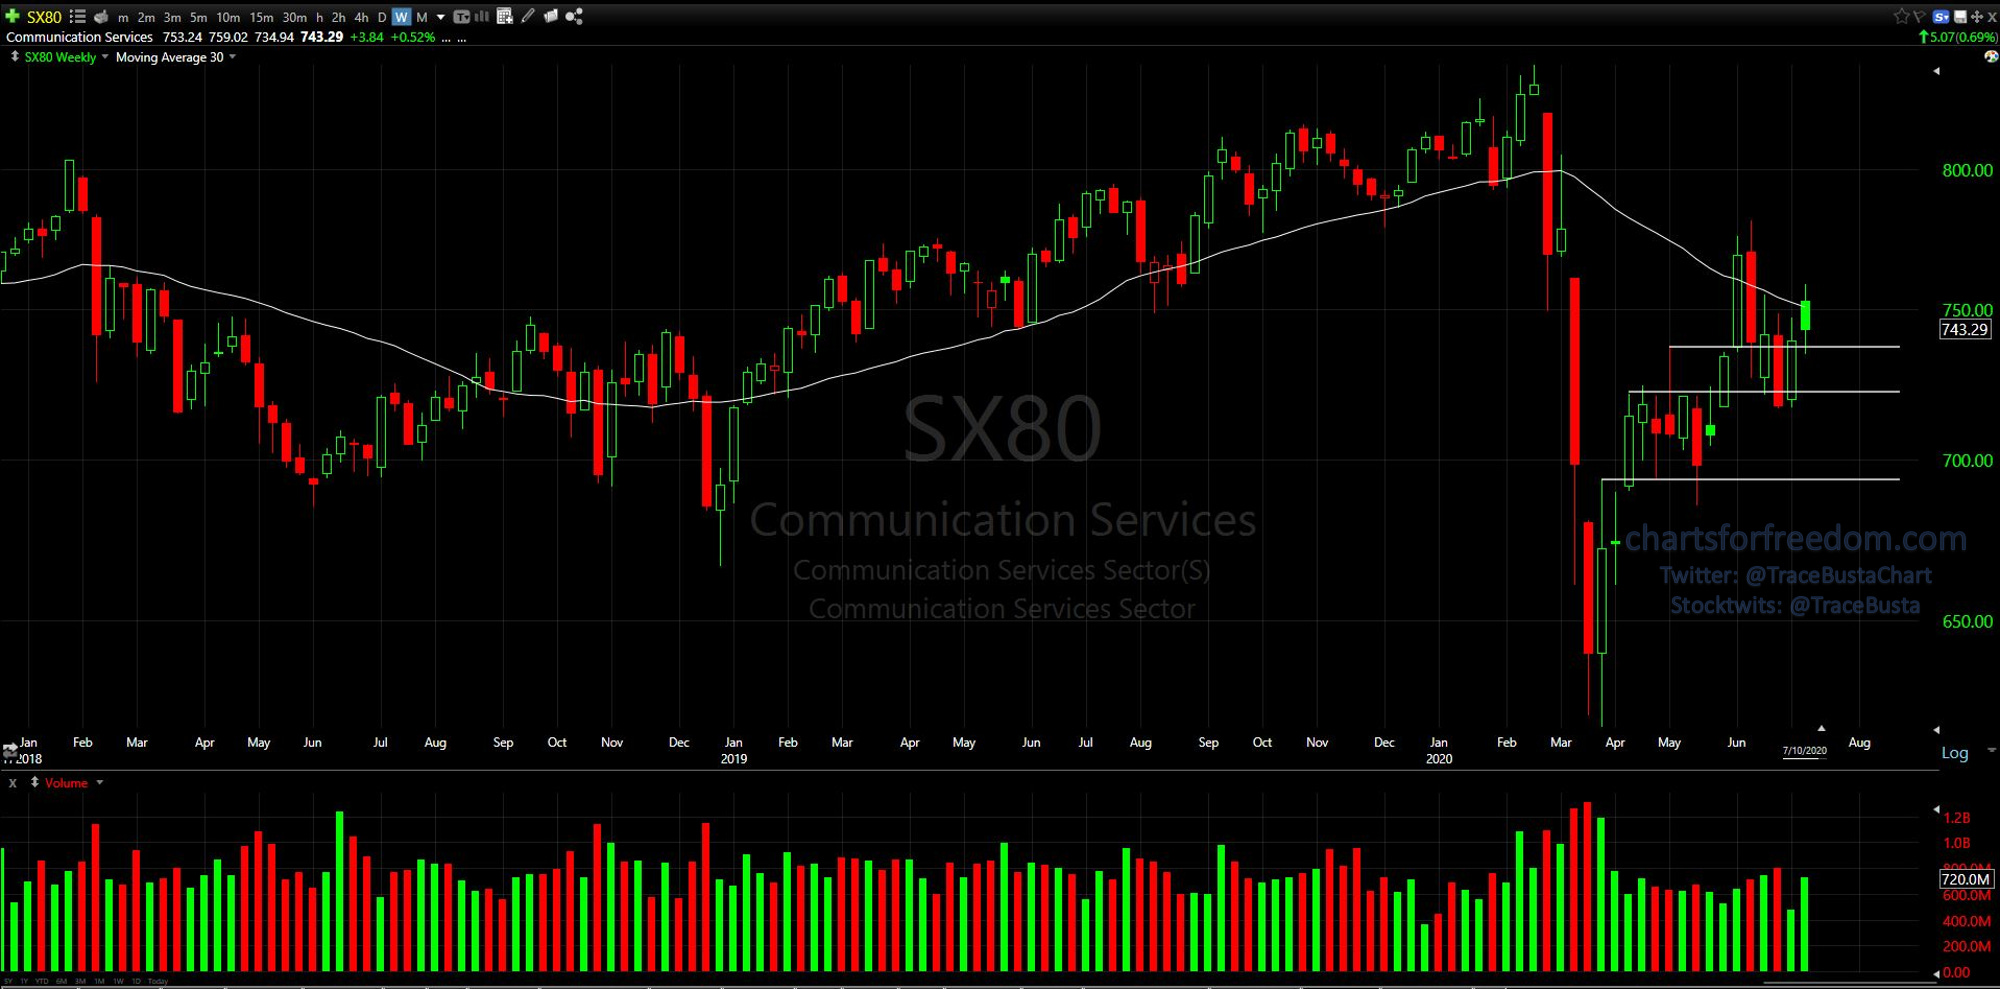
Communication Services

This sector has actually put in the best looking two week period out of all the laggards. If I had to re-rank them today, this would be higher on the list closer to #6. Notice how Price was able to close above the resistance from the May 1 weekly candle high wick, and then used that same level as support the following week?
Some leading components in this sector with impressive charts coming up in my scans include:
ZM (Telecom Services)
TMUS (Telecom Services)
GLIBA (Telecom Services)
Utilities
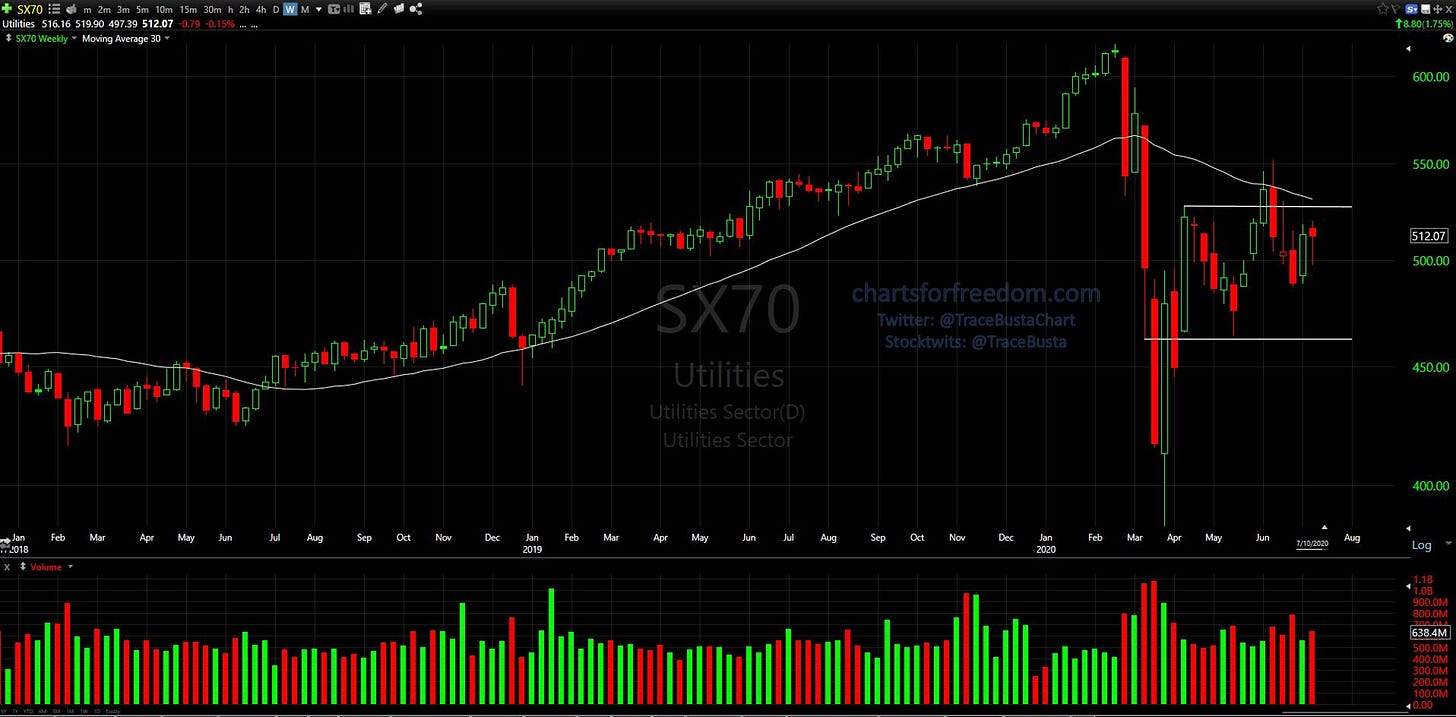
Price still remains within a large trading range indicated by the support and resistance lines I’ve drawn. There is still quite a bit to be done to repair this chart.
There aren’t any components in this sector that are coming up in my scans right now.


To recap, all of these sectors are lagging the overall markets with low relative strength vs. S&P 500. I usually don’t spend much time analyzing the lagging sectors, but when I do, I like to look at the "leaders of the laggards”. Which is why I’ve noted some impressive looking charts below each sector for my future reference. If any of these sectors eventually start to repair their charts and start breaking out, I will be watching the charts of their respective leaders for potential setups. Until then, I am avoiding all of these lagging sectors until their charts improve. So how can they improve?
Rise and close above the 30-wk MA
The 30-wk MA will need to stop declining - I like to be in positions with the “winds at my back”
I would not take any positions in these sectors with a declining 30-wk MA, even if price is above that moving average
I do not take positions in any charts from sectors that have a declining 30-wk MA
Establish a base of tested support
Generate favorable Point and Figure (PnF) counts that represent high reward/risk ratios
Wide expansion bars on high volume can do wonders for a chart
I sincerely hope you have enjoyed and benefited from my public posts. Going forward, to provide more value to the paying subscribers I will limit my free posts to maybe once every month or two. Paying subscribers have access to all of my posts (also sent out as emails at time of post) which include:
The Charts For Freedom portfolio updates (plans, entries, exits)
S&P 500 and NASDAQ 100 futures charts & analysis
Bitcoin and alt-coin charts & analysis
Gold and Silver charts & analysis
General market sector & industry analysis
If you’d like to see what the subscribers have been seeing and join in on future portfolio entries and exits, please subscribe to a monthly ($30) or annual plan ($300). As long as you are on the monthly or annual plan, you will have access to all content mentioned above, including prior posts in the archive.
The portfolio was started less than two weeks ago and is off to an amazing start. I am sharing the entries and exits in real time. The average returns on portfolio positions as of Friday’s close are +10.9% vs. the SPX +2.2% over the same period. I have already closed out one of the trades for a +21% gain in less than a week. A portfolio update was sent out to paying members yesterday (Link), with analysis on each of the open positions and a plan going forward.
Examples of Portfolio picks that are sent out:
NVTA (+10.07% since position taken): Link
SQ (+17.94% since position taken): Link
NFLX (+19.85% since position taken): Link
TSLA (Closed out for 21% gain in less than a week): Link
AMZN (+13.77% since position taken): Link
Paid subscriber-only Pick 1 has gained +11.5% in less than a week since taking position. I believe there is still room to run, with an additional 30% of potential gains from Friday’s close before my PnF Objective count is achieved. This PnF count was shared with members at the time of trade: Link
Paid subscriber-only Pick 2 has gained +9.23% in less than a week since taking position. I believe there is still room to run, with an additional 55% of potential gains from Friday’s close before my PnF Objective count is achieved. This PnF count was shared with members at the time of trade: Link
A paid subscriber-only mid-week update was sent out on Tuesday July 7. This update included bullish PnF counts on the S&P 500 and NASDAQ 100 futures, and showed areas of support with bullish PnF trend lines. When support was being tested two days later on July 9, and many market participants were turning bearish, I used these charts to take a bullish call position which is now up 28%. Link
Here is some early feedback I’ve received:
Hi Trace,
Just a quick note to say that I have really enjoyed your Newsletter and updates this past week. I entered several positions based on the CFF portfolio and am green on each one so far. Even more important is the confidence I have in each position, based on your detailed breakdown of each one. And the stated stop loss provides a very specific exit strategy. Thanks for doing all this, gives me a lot of hope for financial independence going forward.
All the best to you and yours this 4th of July weekend,
Michael
For some insight to my altcoin posts, below are some examples with the resulting gains at the time of this writing:
KNC (Kyber Network) is up 20% since my free post on July 1 was sent out (Link)
LINK (ChainLink) is up 26% since my free post on July 6 was sent out (Link)
Thank you and I hope you enjoy the rest of your weekend. May you stay happy, healthy and safe!