

Market Sector Analysis and Bitcoin Charts
Market Sector Analysis and Bitcoin Charts
Includes Update to CFF Portfolio


Hello,
I hope everyone is enjoying their Independence Day weekend, and is staying happy, healthy & safe! Today I wanted to give some updates to the Charts For Freedom portfolio positions and then I’ll get into the sector analysis. At the end I am including some Bitcoin analysis as well. I hope you enjoy!
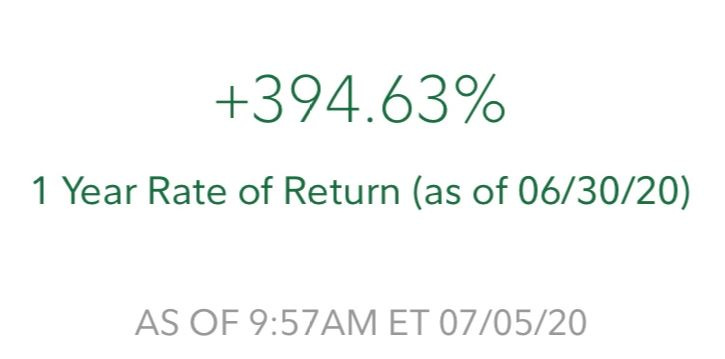
Before I get into the regular updates I want to let everyone know that starting this week I will begin charging $30 for a monthly subscription and $300 for a yearly subscription for my content. I hope my analysis and updates have been helpful for everyone, I know some people are following along and already making money on the portfolio picks, which have all been winners thus far with an overall return of +4.7% vs. SPY +1.01%. Charting the markets is a passion of mine and I take each and every position very seriously. Using a disciplined approach to entries and exits I have been able to make some very nice gains with a 1 Year Rate of Return of +394% vs. the S&P 500 index ($SPX) approximate 5% gain.
I hope you will consider following along on my future journey navigating the markets! Note: The above returns did include options mixed in the portfolio. For this Charts For Freedom blog publication, I will stick to common positions only. If the demand is high enough, I will do a separate options service. Shoot me an email chartsforfreedom@gmail.com or message on Twitter or Stocktwits if you are interested in an options service.
Now on to the Charts for Freedom Portfolio Updates.
Total Return: +4.7% vs. SPY +1.01%
AMZN:
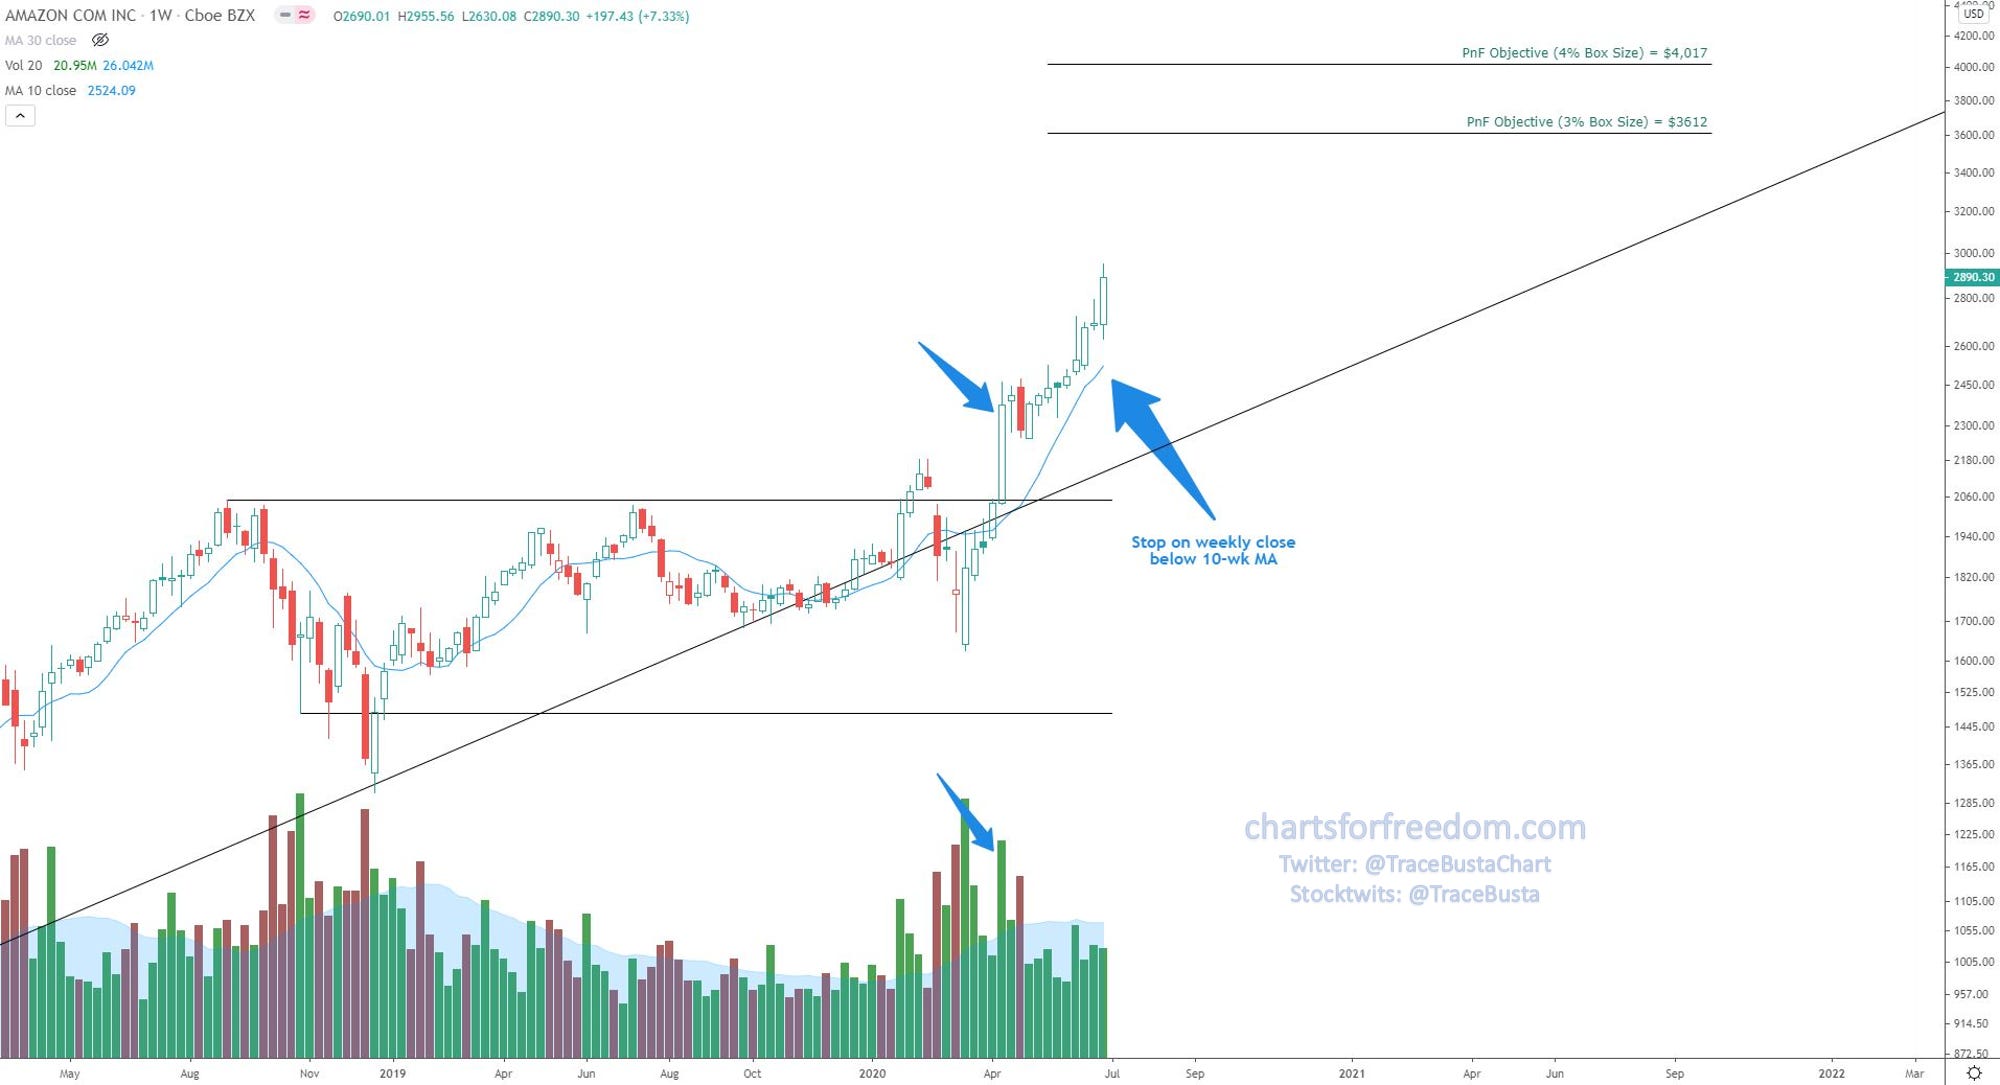
Entry: $2,815.32
Return: +2.67%
Stop: Weekly close below rising 10-wk MA
Notes: Price has recently consolidated allowing the 10 & 20 Day EMA’s to catch up. Recently there was a strong bounce off the 20 day EMA, reinforcing the stride of the rising trend. I’ll look to add to this position on future pullbacks, consolidations, and bounces off these EMA’s
BMRN:
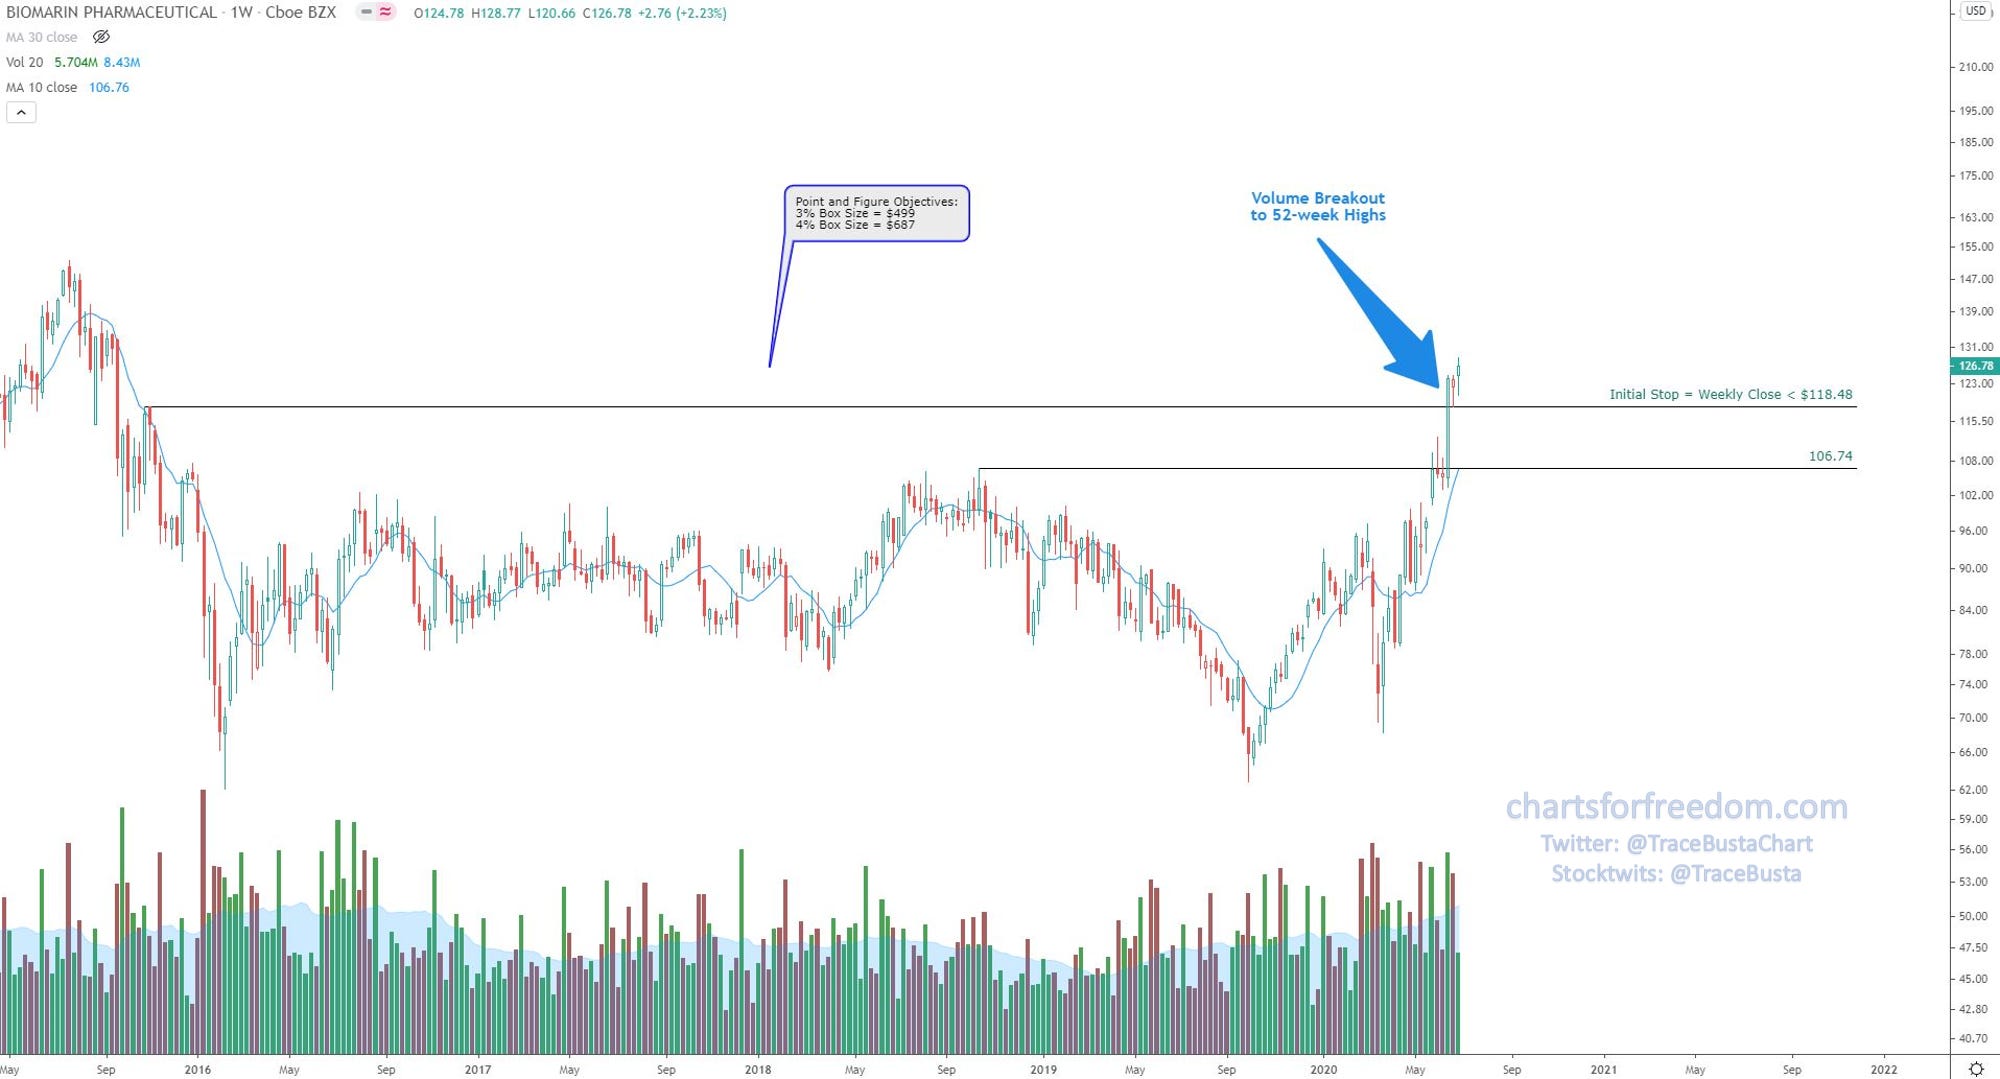
Entry: $123.88
Return: +2.34%
Stop: Weekly close below $118.48
Notes: Will seek additional half position on consolidation & bounce off 10/20-Day EMAs
NFLX:
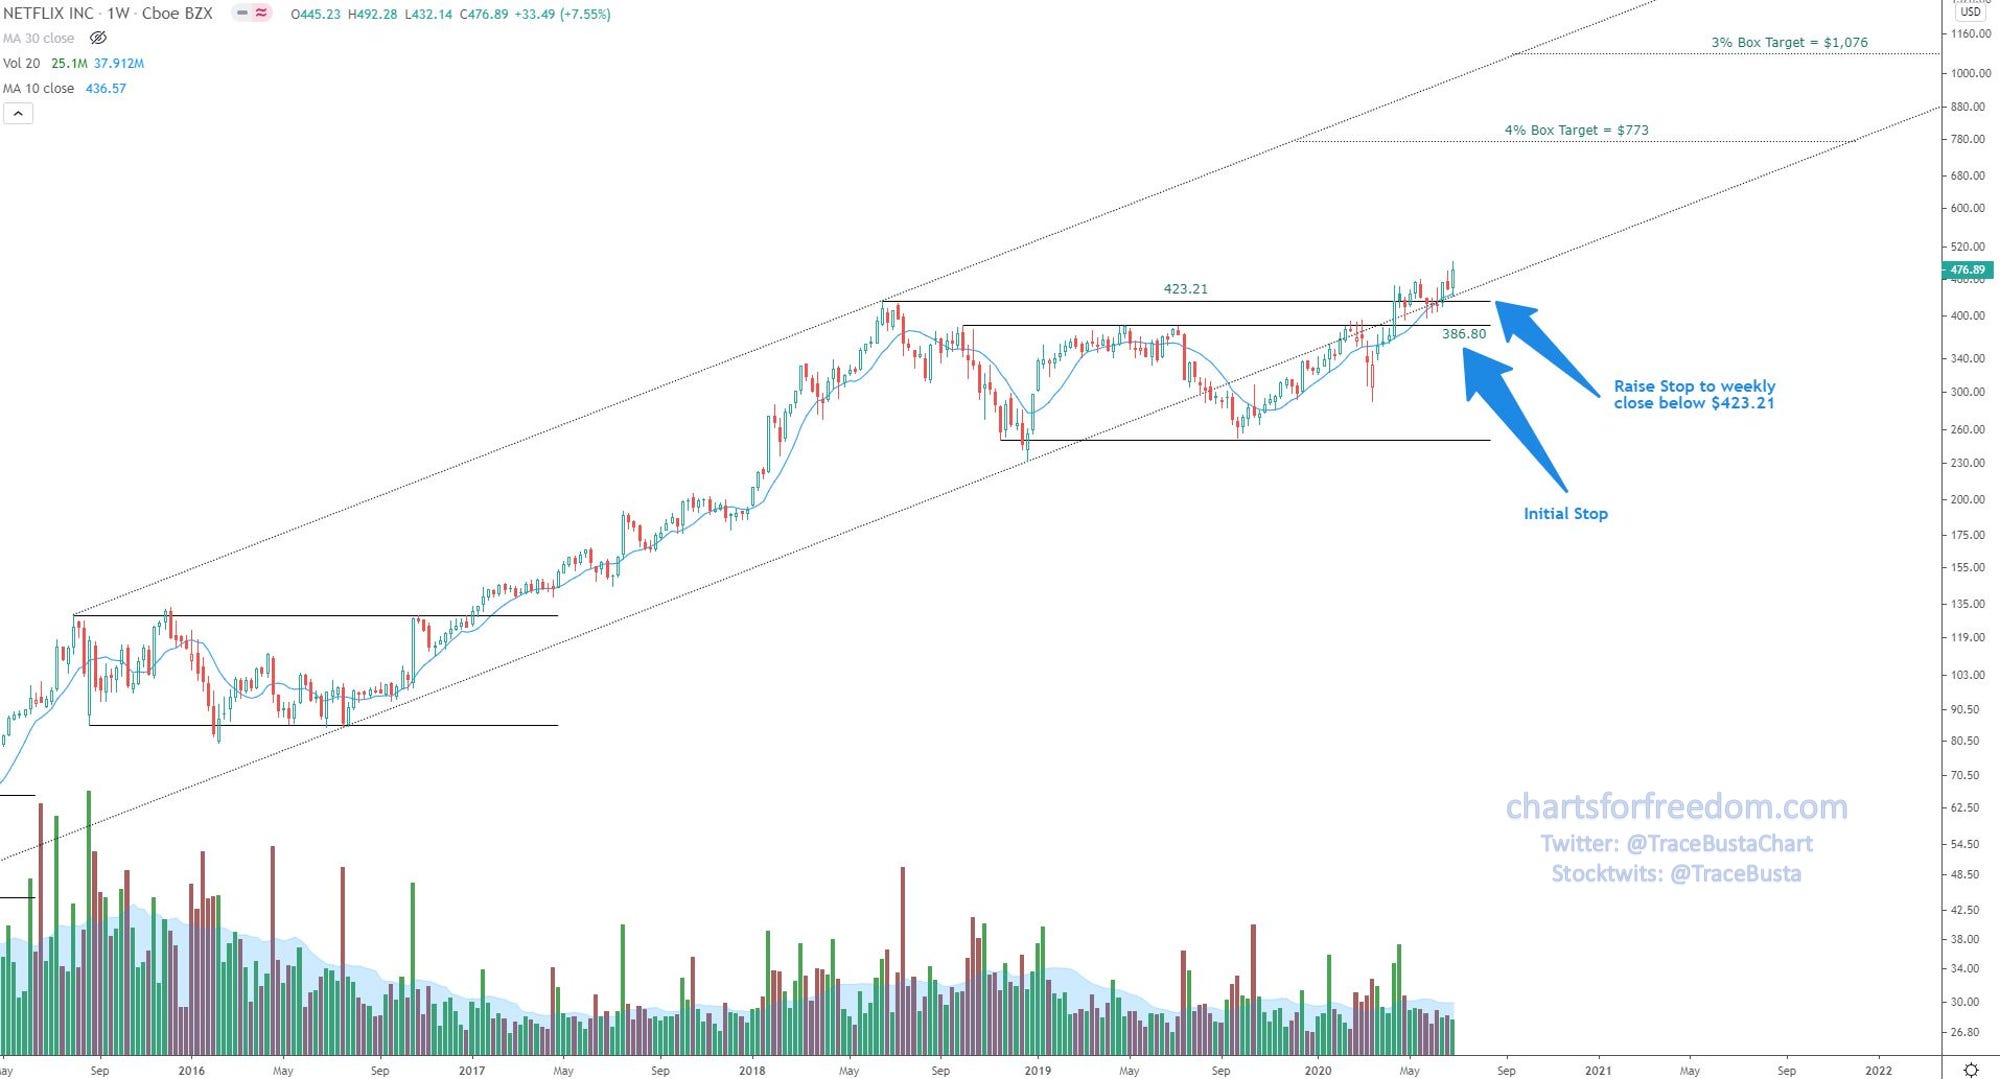
Entry: $386.80
Return: +3.96%
Stop: Updated to weekly close below $423.21 (2018 Buying Climax Level – Top of Prior Range). Initial stop was set at $386.80, which served as a prior resistance level. Now with price back in main trend channel and bouncing off the rising 10-wk MA, which is above $423.21, I will update my stop to that level.
Notes: Will seek additional half position on consolidation & bounce off 10/20-Day EMAs
NVTA:
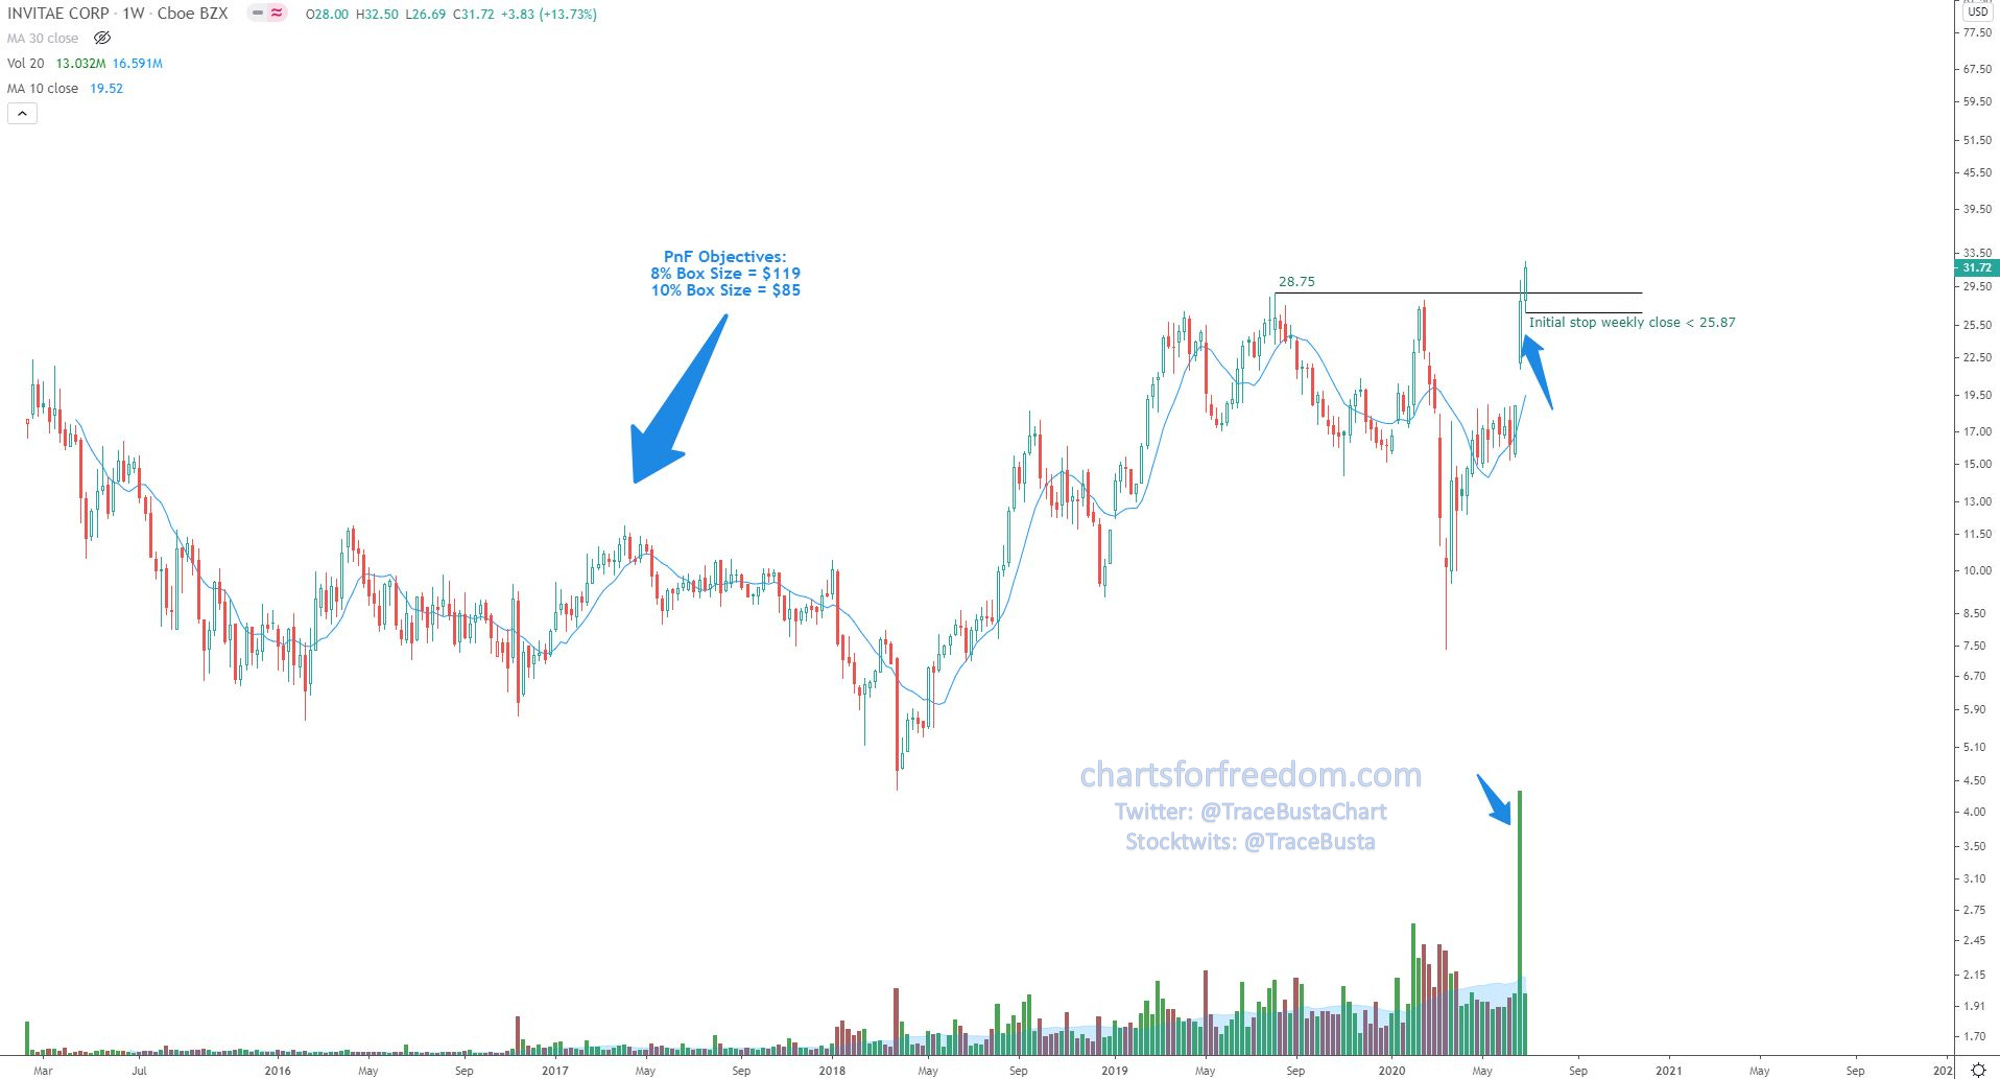
Entry: $30.28
Return: +6.37%
Stop: Weekly close below $25.87
Notes: The volume that came in two weeks ago was astonishing, and the expansion bar it coincided with is what grabbed my attention. This may have been a big short squeeze, with a short float over 20%. I will continue to track the short float statistics as it updates. Because of the wide expansion bar, the 10-wk MA is too low to use as a stop out level, so I am using the $25.87 level until the 10-wk MA catches up.
SQ:
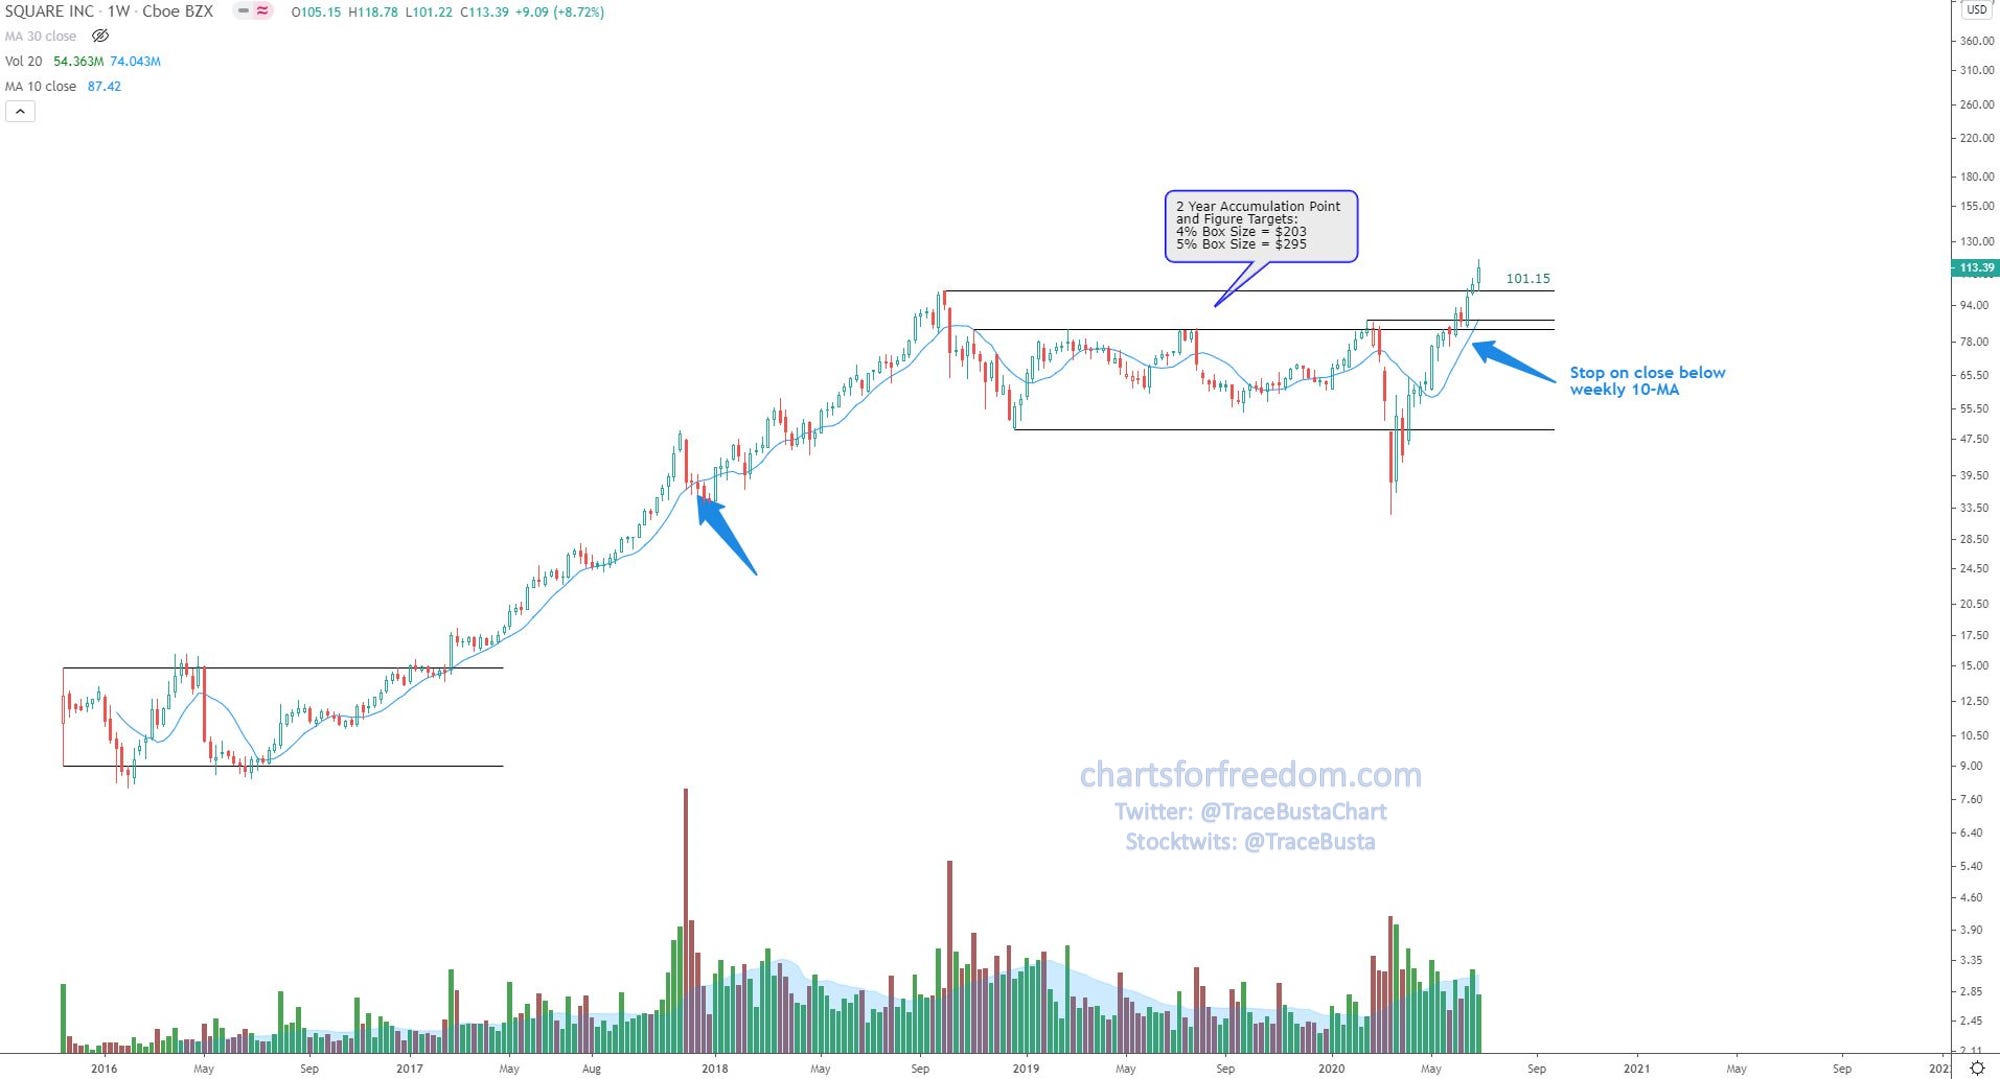
Entry: $108.79
Return: +4.61%
Stop: Weekly close below rising 10-wk MA
Notes: Will seek additional half position on consolidation & bounce off 10/20-Day EMAs. The short float is currently reported as 8.94%. I will continue to track this.
TSLA:

Entry: $1,120.07
Return: +8.31%
Stop: Weekly close below rising 10-wk MA
Notes: I will look to add either at tag of 10-wk MA, or if price consolidates again around the 10 & 20 Day EMAs and bounces higher afterward. The short float is currently reported as 10.27%, I will continue to track this.
For long term trend channel on monthly chart, see here . Some things to point out on chart:
There was a 3-year accumulation objective that was already achieved, as shown on chart
There is a current 2-year accumulation objective (using 5% box size) of $1,630, which is approximately 35% higher from Thursday’s close and 45% higher from the entry price.
Combining the two accumulation periods into one larger accumulation, I’ve increased the box size to 8% to yield an objective of $3,030. While this seems outrageous to some, I am not calling for this to be overnight or right away. This would likely need years to be achieved. As an example on the time required, in April of 2015 $AMZN broke out from $400 and just over 5 years later it is trading just under $3,000. So, a $400 to $3,000 move in TSLA may require further periods of consolidation, chop and allow for a new re-accumulation counts to develop for the $3,000 level.
Sector Analysis:
Following up on last week’s analysis (click here) from best looking to worst looking, the charts below are updated with price only, my lines and levels indicated have not changed.
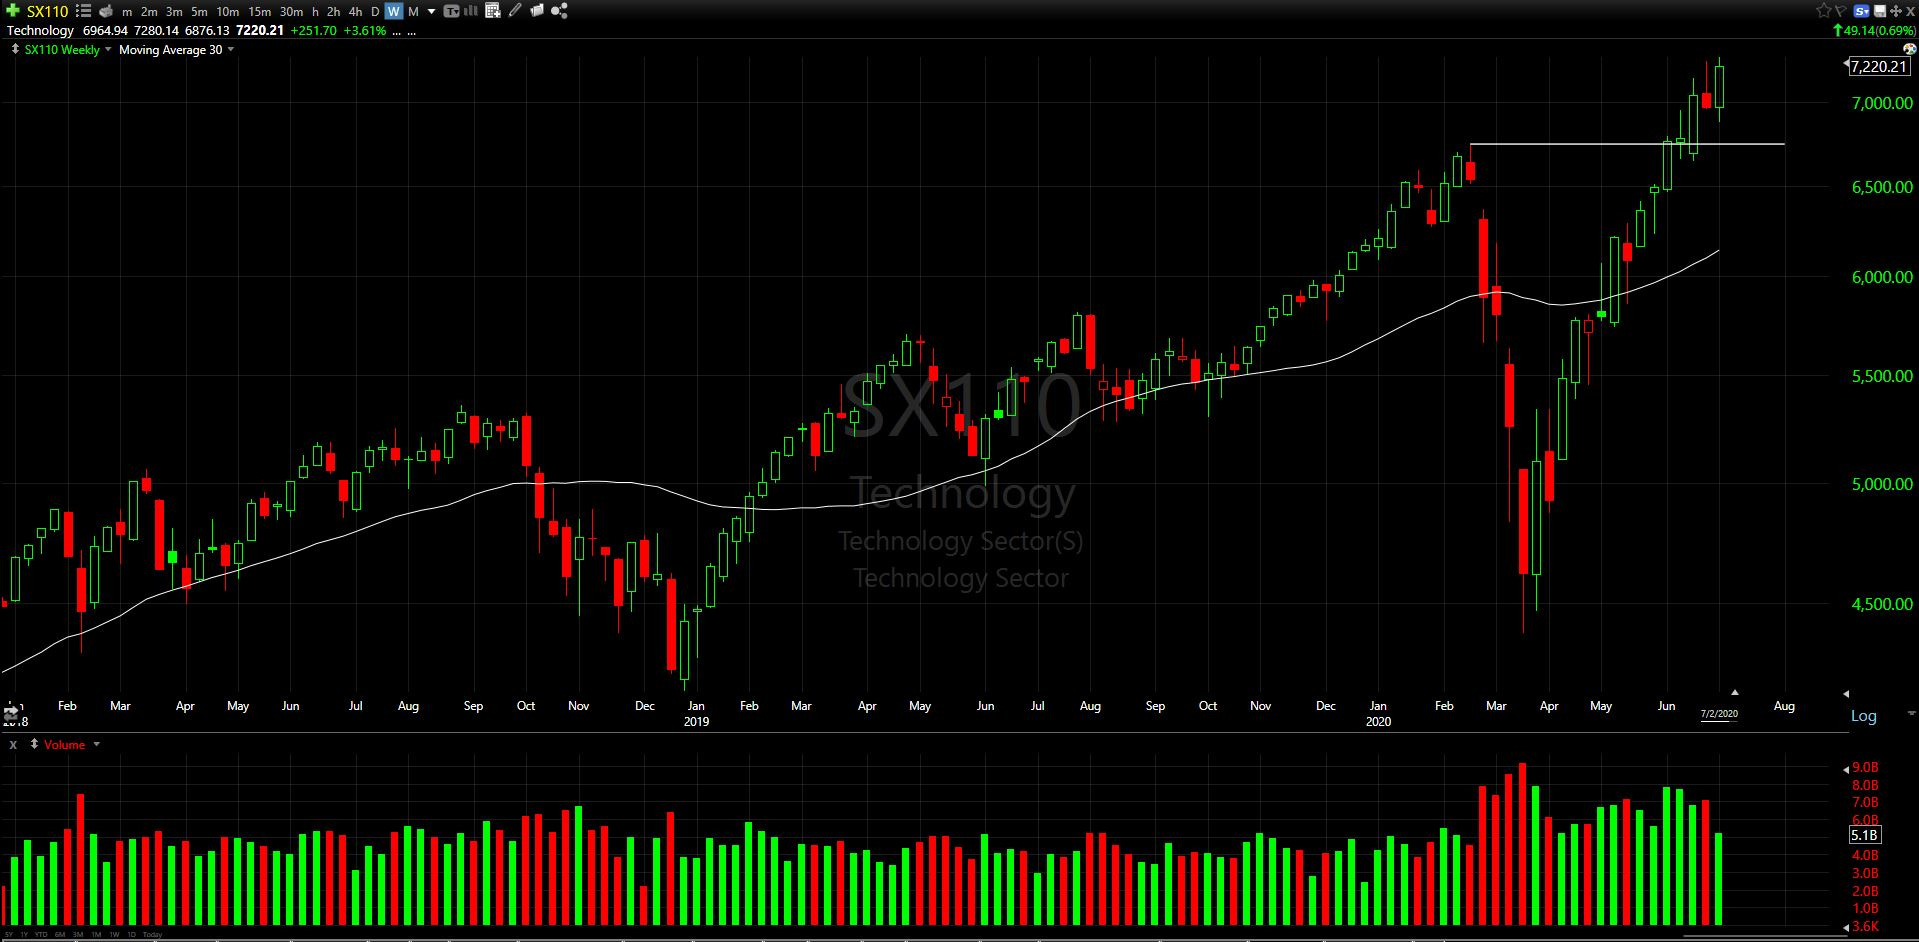
Technology

Very solid bullish engulfing candle on the weekly. Remains the leader of the sectors for now.
Healthcare
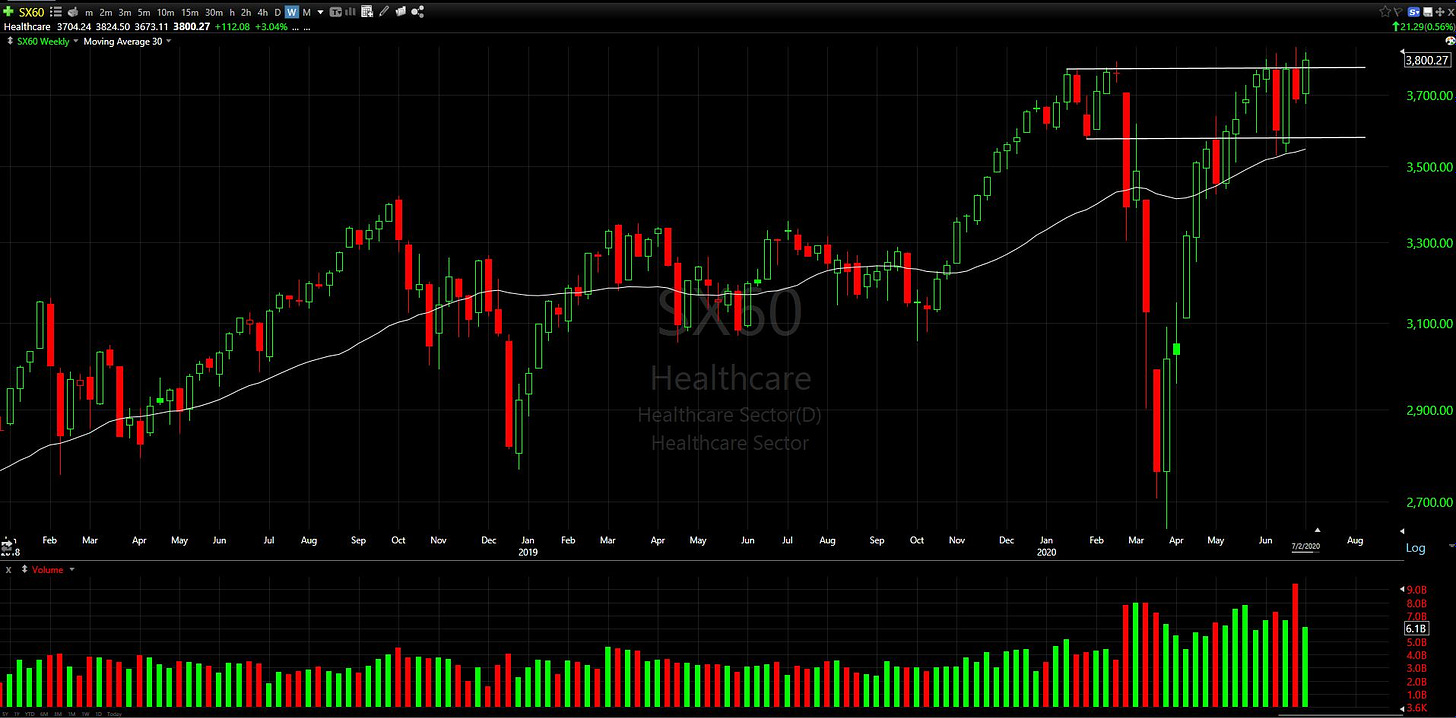
This is the kind of weekly candle I like to see on the bullish side. There was no follow through lower from the previous week, and price put in the highest ever weekly close.
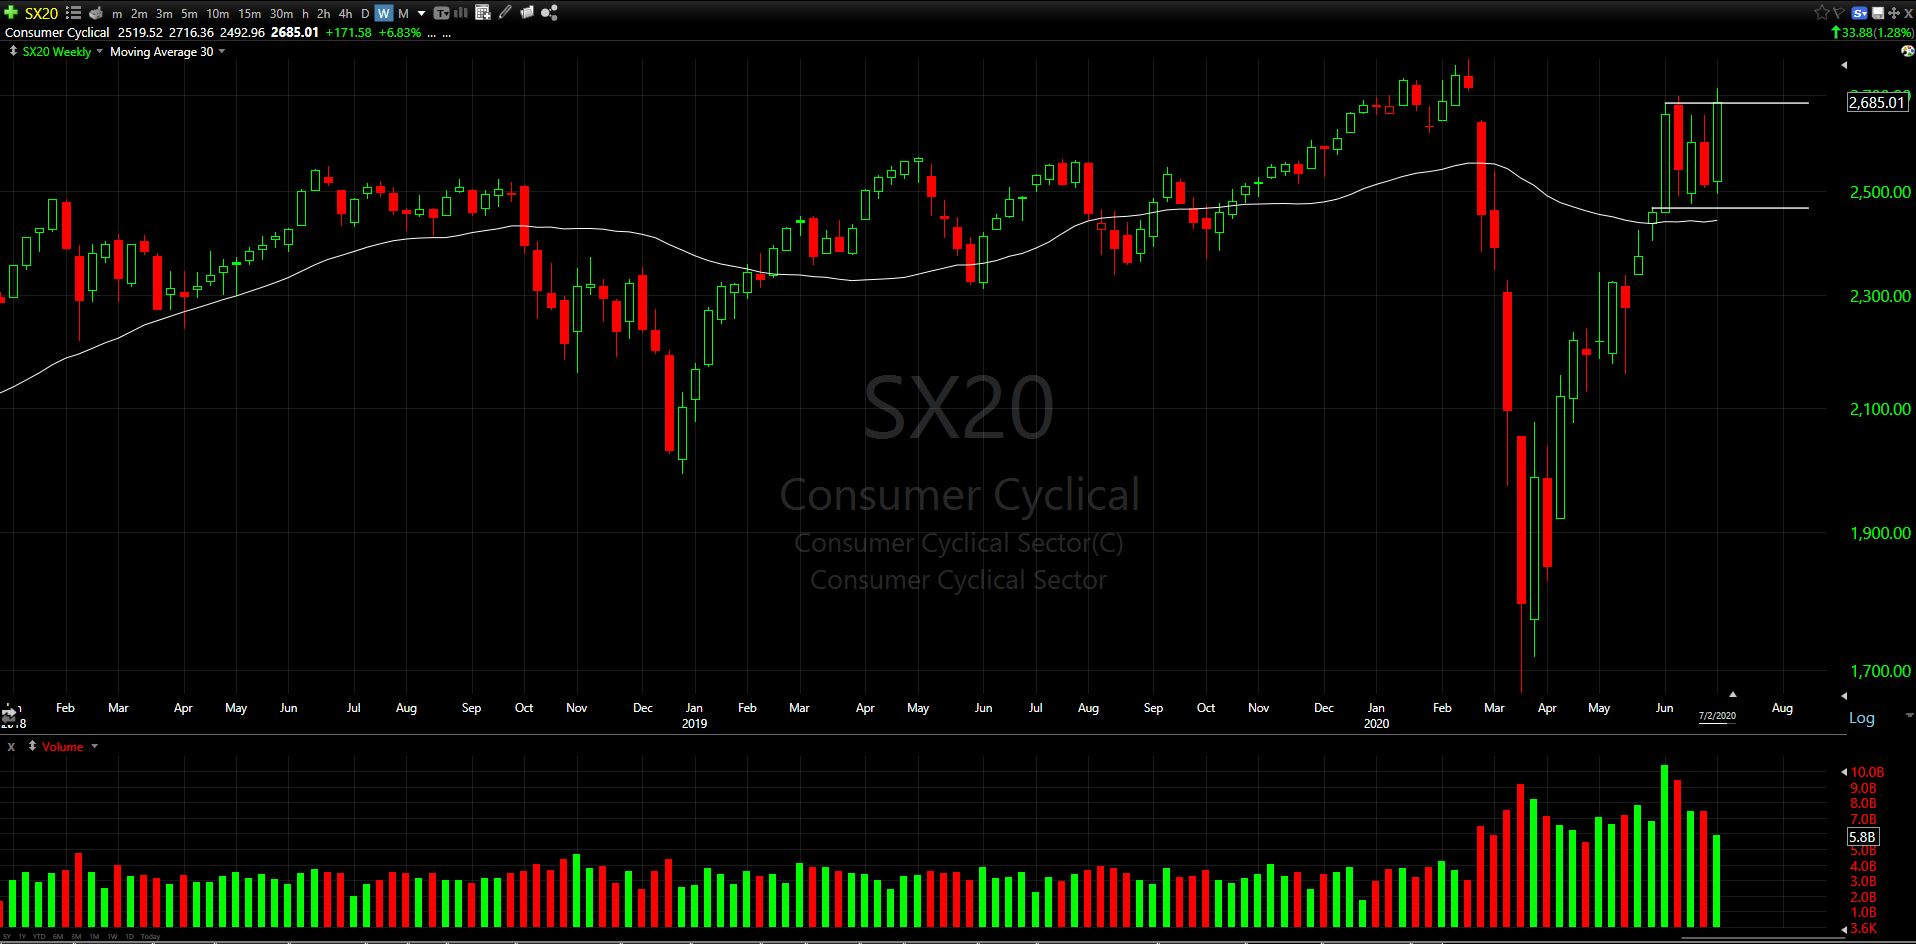
Consumer Cyclical
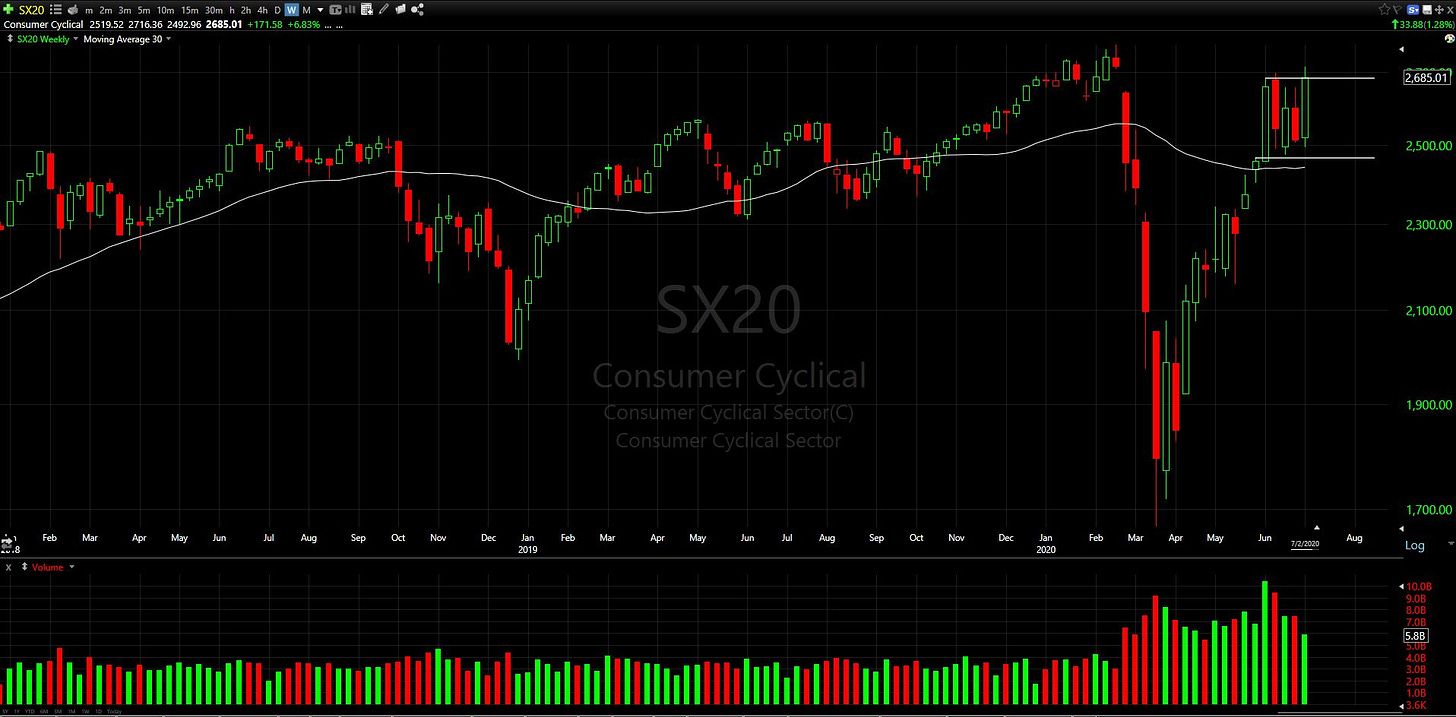
Very solid weekly candle. Closed right above the resistance line indicated last week. The flattish 30-wk MA is starting to curl higher now.
Basic Materials
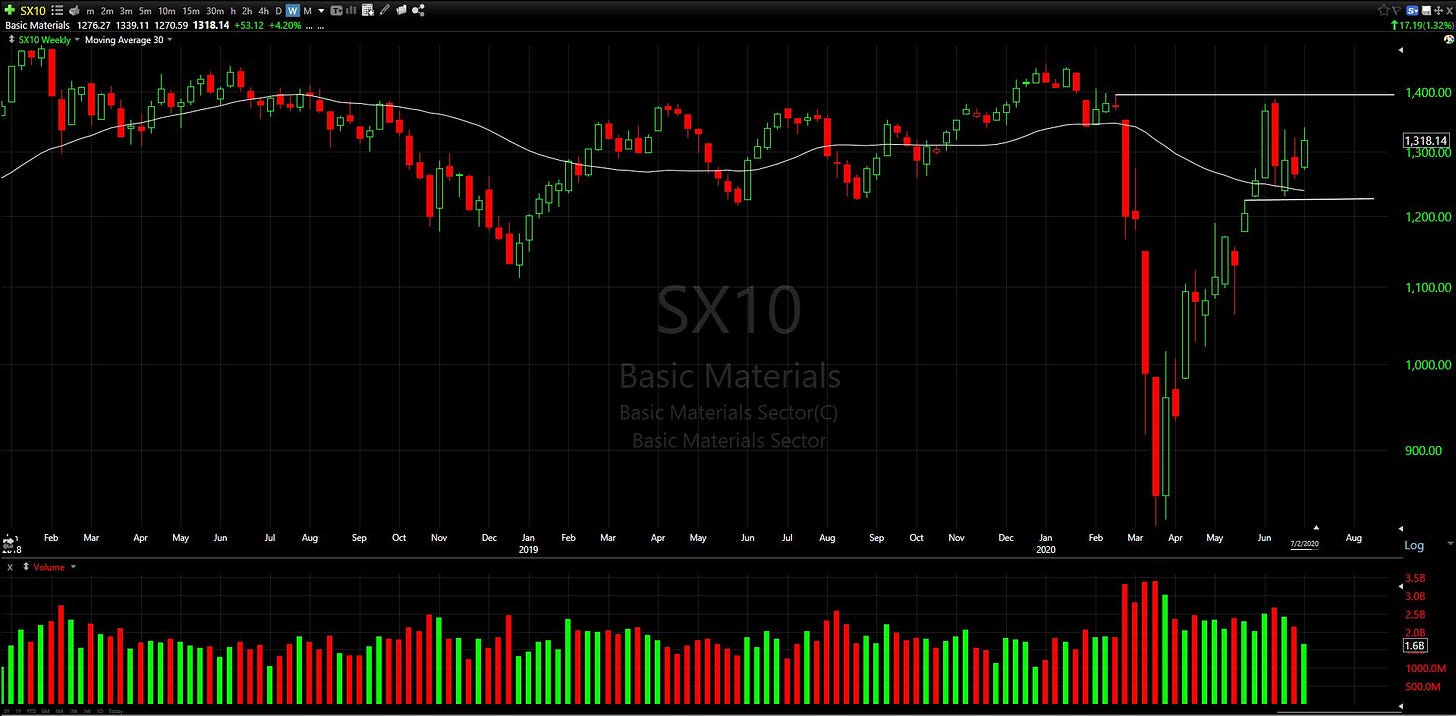
Closed higher for the week, but leaves with a high wick at top and still in a wide range, above a declining 30-wk MA.
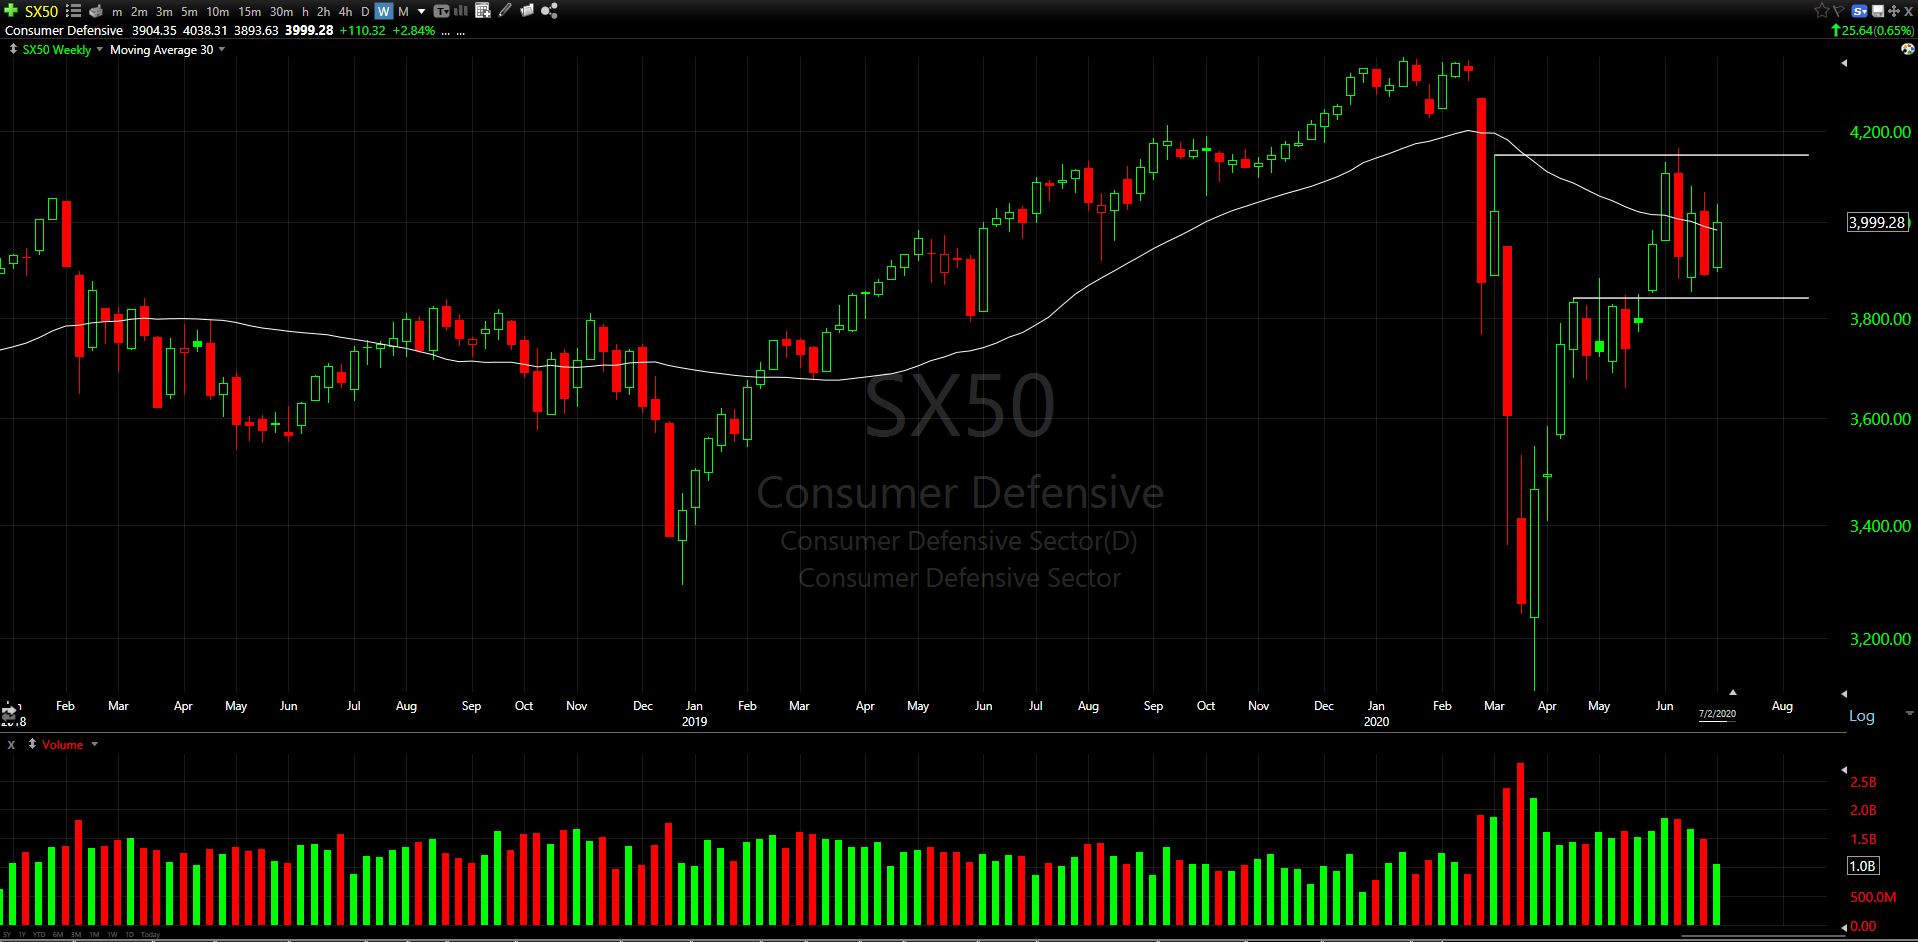
Consumer Defensive
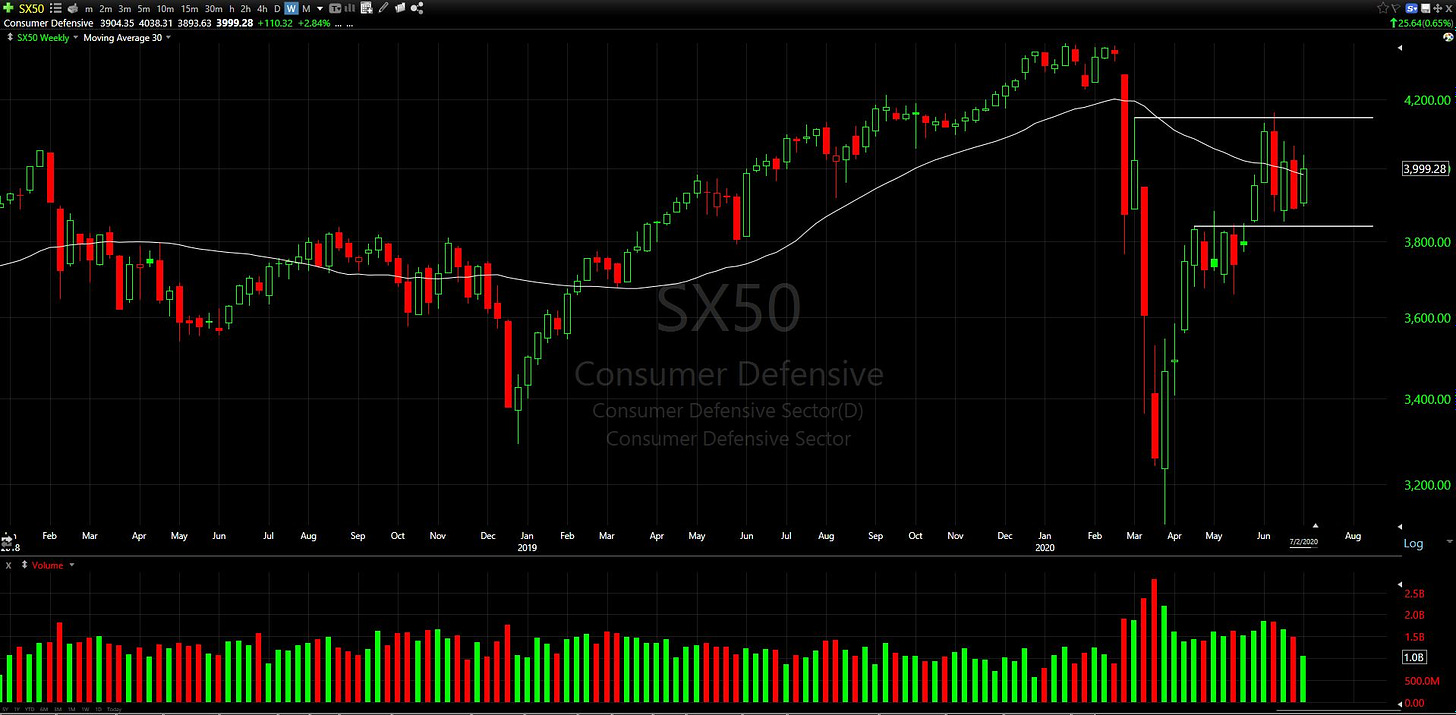
Like the Basic Materials, closed higher with high wick at top, in a range and above a declining 30-wk MA.
through 11. (Industrials, Real Estate, Energy, Financial Services, Communication Services, Utilities)
All share a common theme, closed higher, had wicks at the top and are all below a declining 30-wk MA. I continue to avoid names from these sectors.


Bitcoin Update:
Seasonality from Seasonax
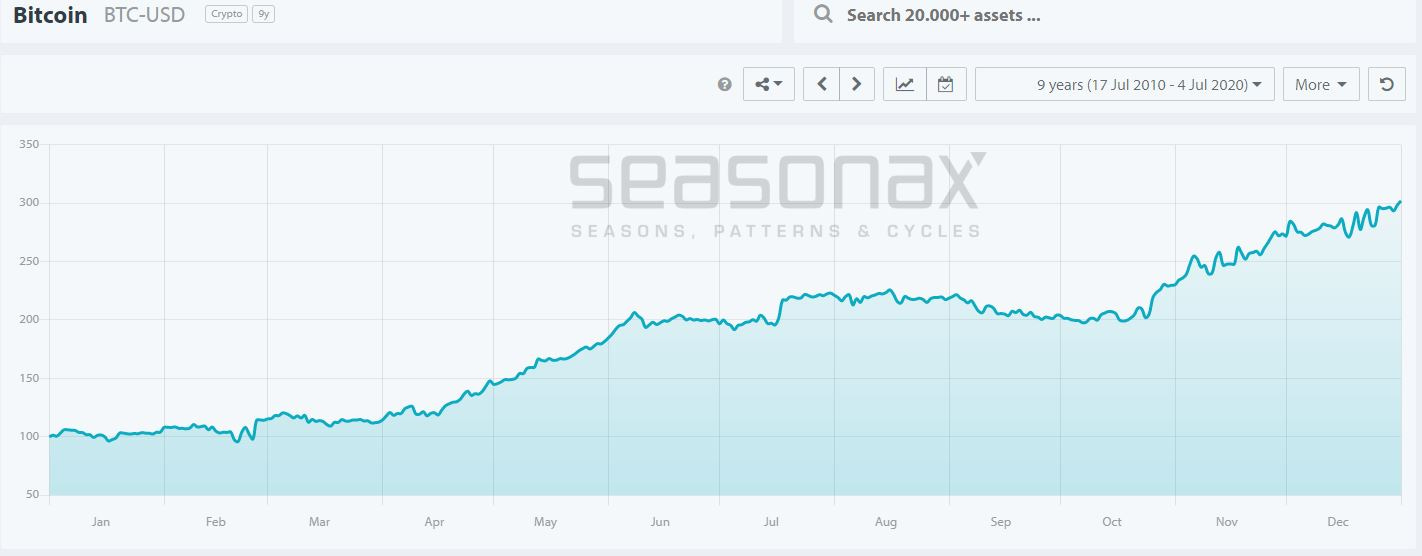
This is 9 years of data, so still a small sample size relative to the market seasonality charts discussed on Friday (link here), but it does give us some useful information nonetheless. There has been a lull throughout the summer months from June-Sept and then a mid to late October run up into EOY.
So now looking at the charts, what I’m looking for is a break above the $11,770 area to get the next bull market up and running. If this were to coincide with a spike in volume, that would be ideal.
Bitcoin Chart 1: Weekly Bitcoin with Breakouts

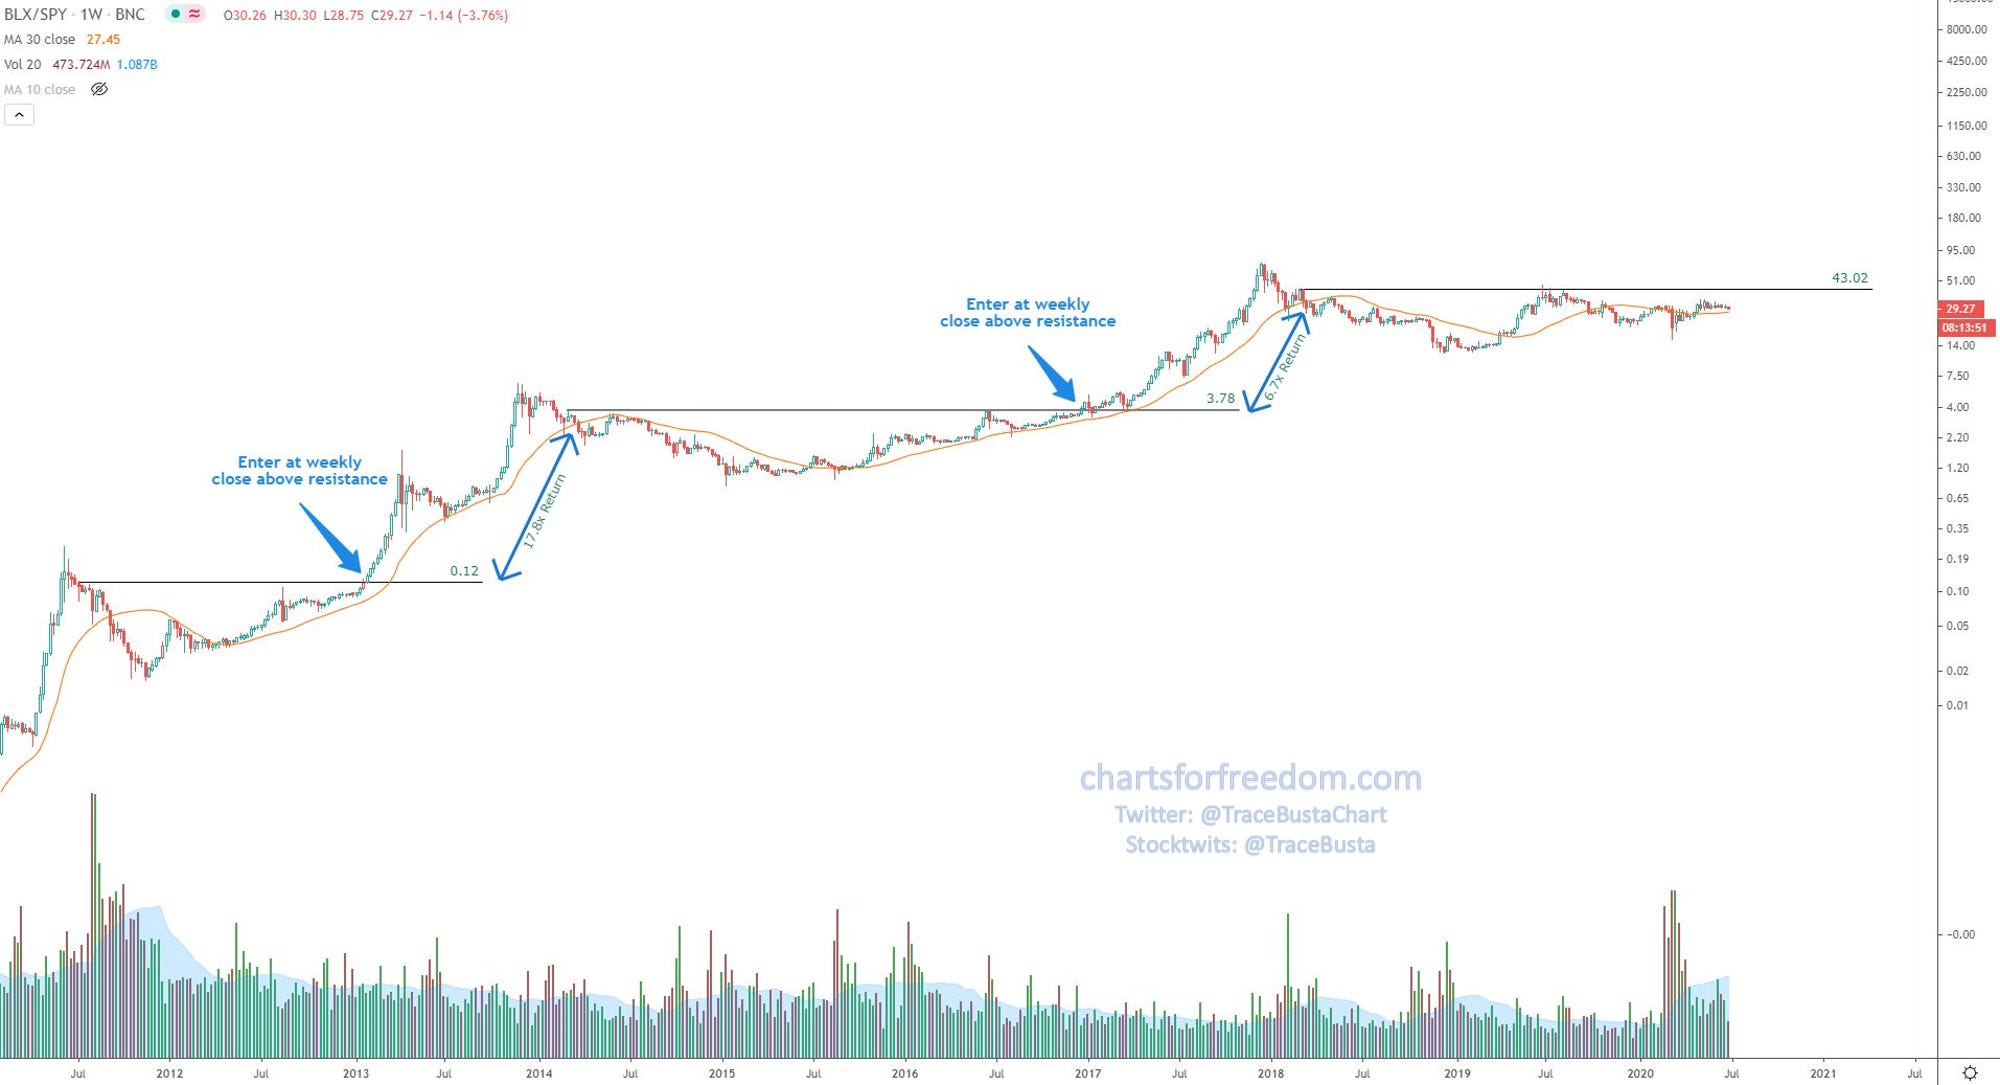
Relative to SPY, Bitcoin could be setting up a very nice leg up soon. See the chart below.
Bitcoin Chart 2: Weekly Bitcoin/SPY with Breakouts
Thank you for reading, I hope you enjoy. Stay safe, be kind and good luck!