

Election Year Cycles & Seasonality
Election Year Cycles & Seasonality
With Chart Analysis of 2000, 2008, and 2020 Election Years

Good Morning,
As we enter into the 2nd half of the year, I am continuously thinking about the election year cycle’s that the market goes through. In last Sunday’s post, I mentioned:
…the 2nd half of election years have historically been some of the most bullish periods for market gains. Perhaps I will dive deeper into this on a follow up post because it’s relevant to the period the markets are about to enter.
I was going to spend time breaking down every election from the 1980’s until present, showing that most have positive 2nd half gains. But then during my research I came across the below charts that do a better job summarizing what I wanted to say. So without further ado, here they are:
Chart 1: Dow Jones Industrials Average Returns - Filtered For US Presidential Election Years. Source: www.seasonax.com
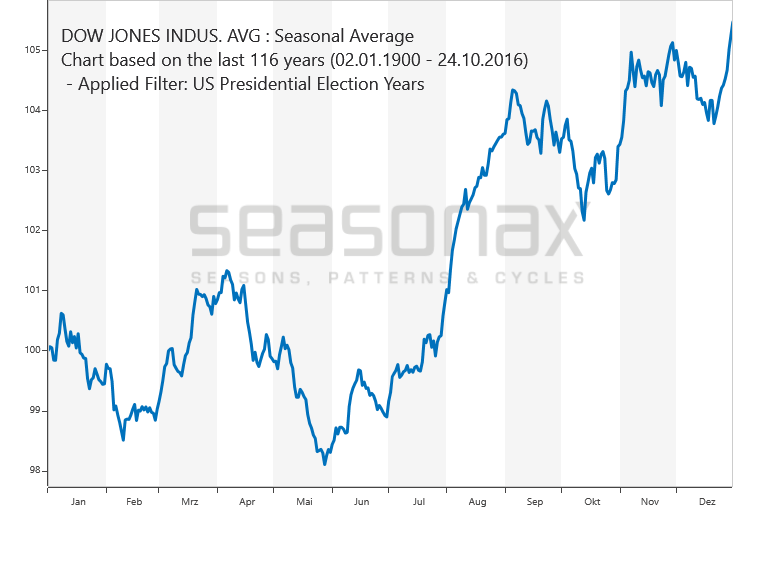
History doesn’t always repeat, and there are certainly exceptions to these historical cycle charts, so I won’t blindly assume we are going to rally into year end. But it has certainly helped me to know and be cognizant of these periods where the “winds are at your back”.
Chart 2: Dow Jones Seasonal 1983-2010. Source: www.seasonalcharts.com
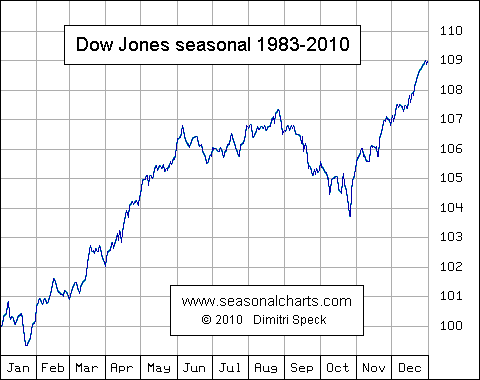
Going further into this theme of seasonality, Chart 2 above shows again a bullish 2nd half. So the election years that I’m quickly reminded of that had trouble, were NASDAQ in 2000 and everything in 2008. What happened? Let’s take a look at some charts from those years:
2000 Election Year Down Jones Industrials:
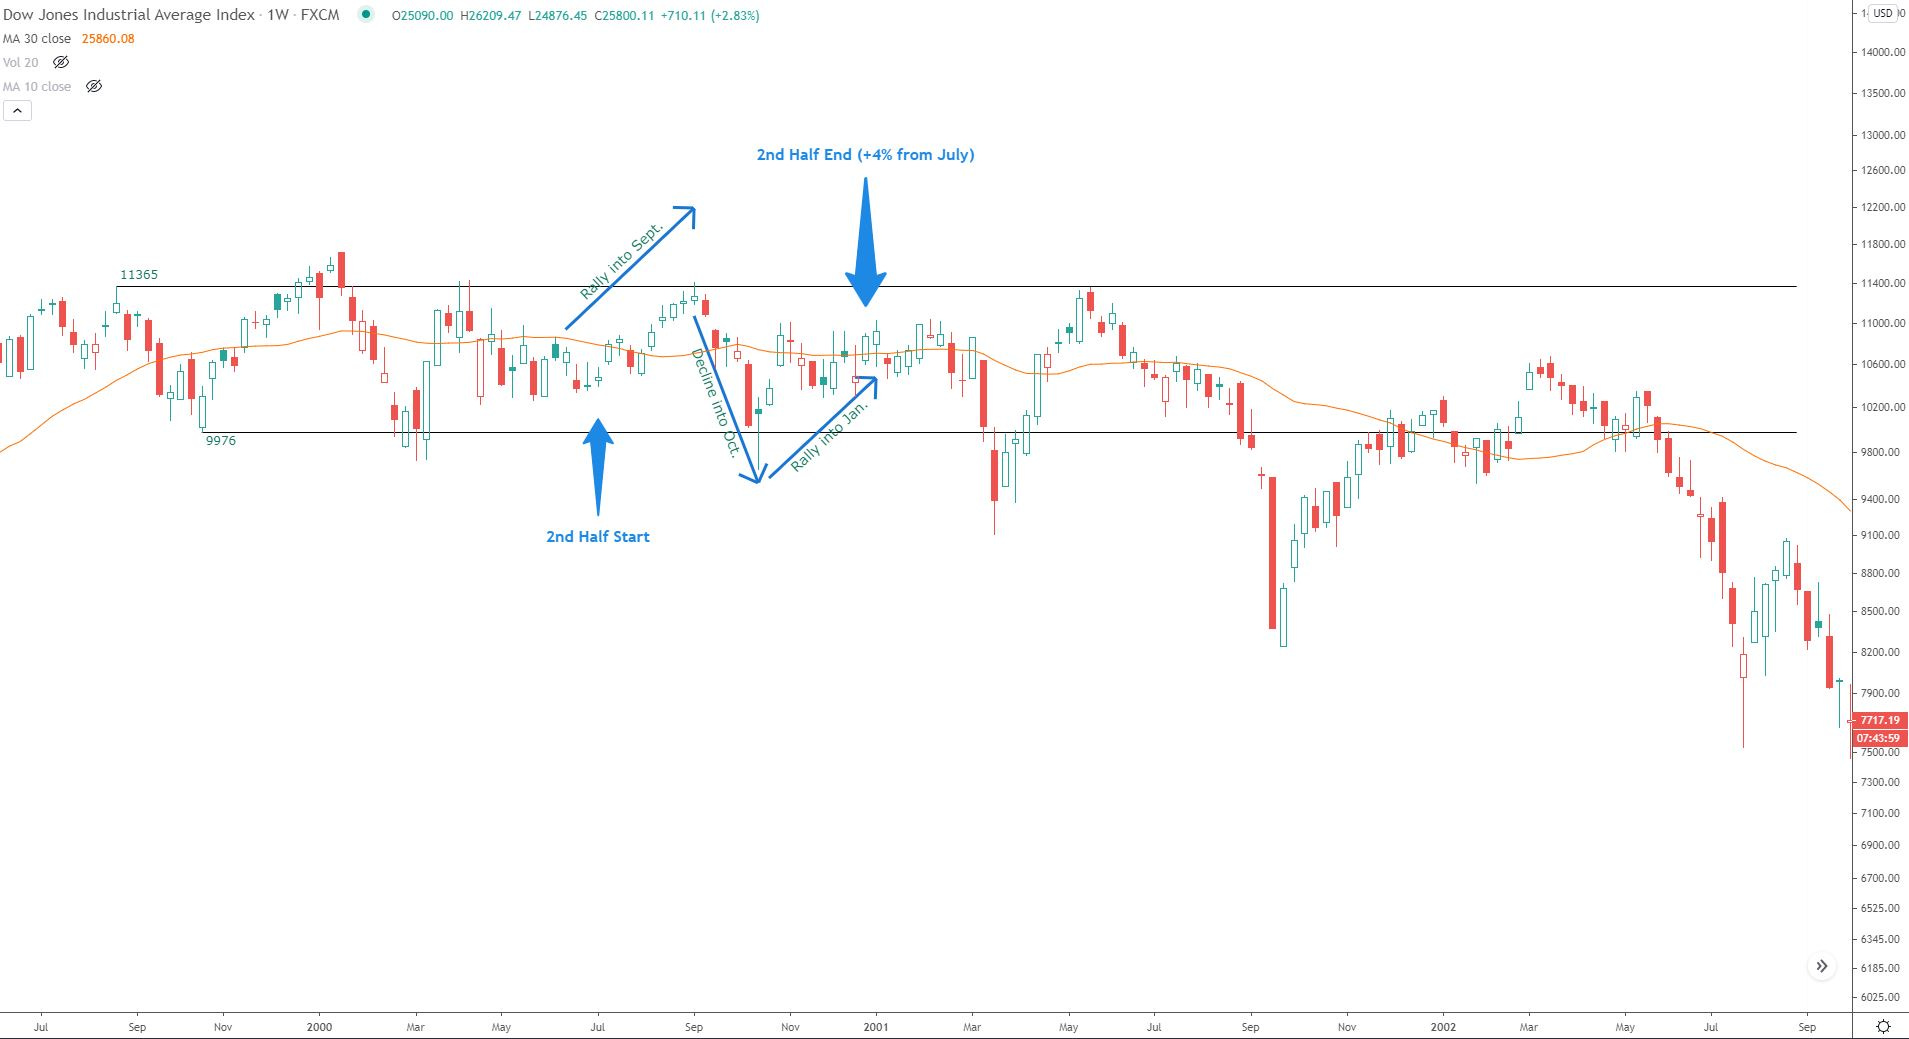
A few things I’ll point out with the chart:
Price had entered a range prior to the 2nd half starting. The 30-wk MA had flattened out. Clearly there was chop.
There was a rally from July-Sept which matches Chart 1 expectations.
There was a decline from Sept-Oct which matches Chart 1 expectations.
There was a rally from Mid-Oct to EOY. Again, matching Chart 1 expectations.
Overall gain from July Start -> EOY was about 4%.
But what about tech? The major Dotcom bubble? Well here is the NASDAQ 100 Index with 3 warning signs of a top:
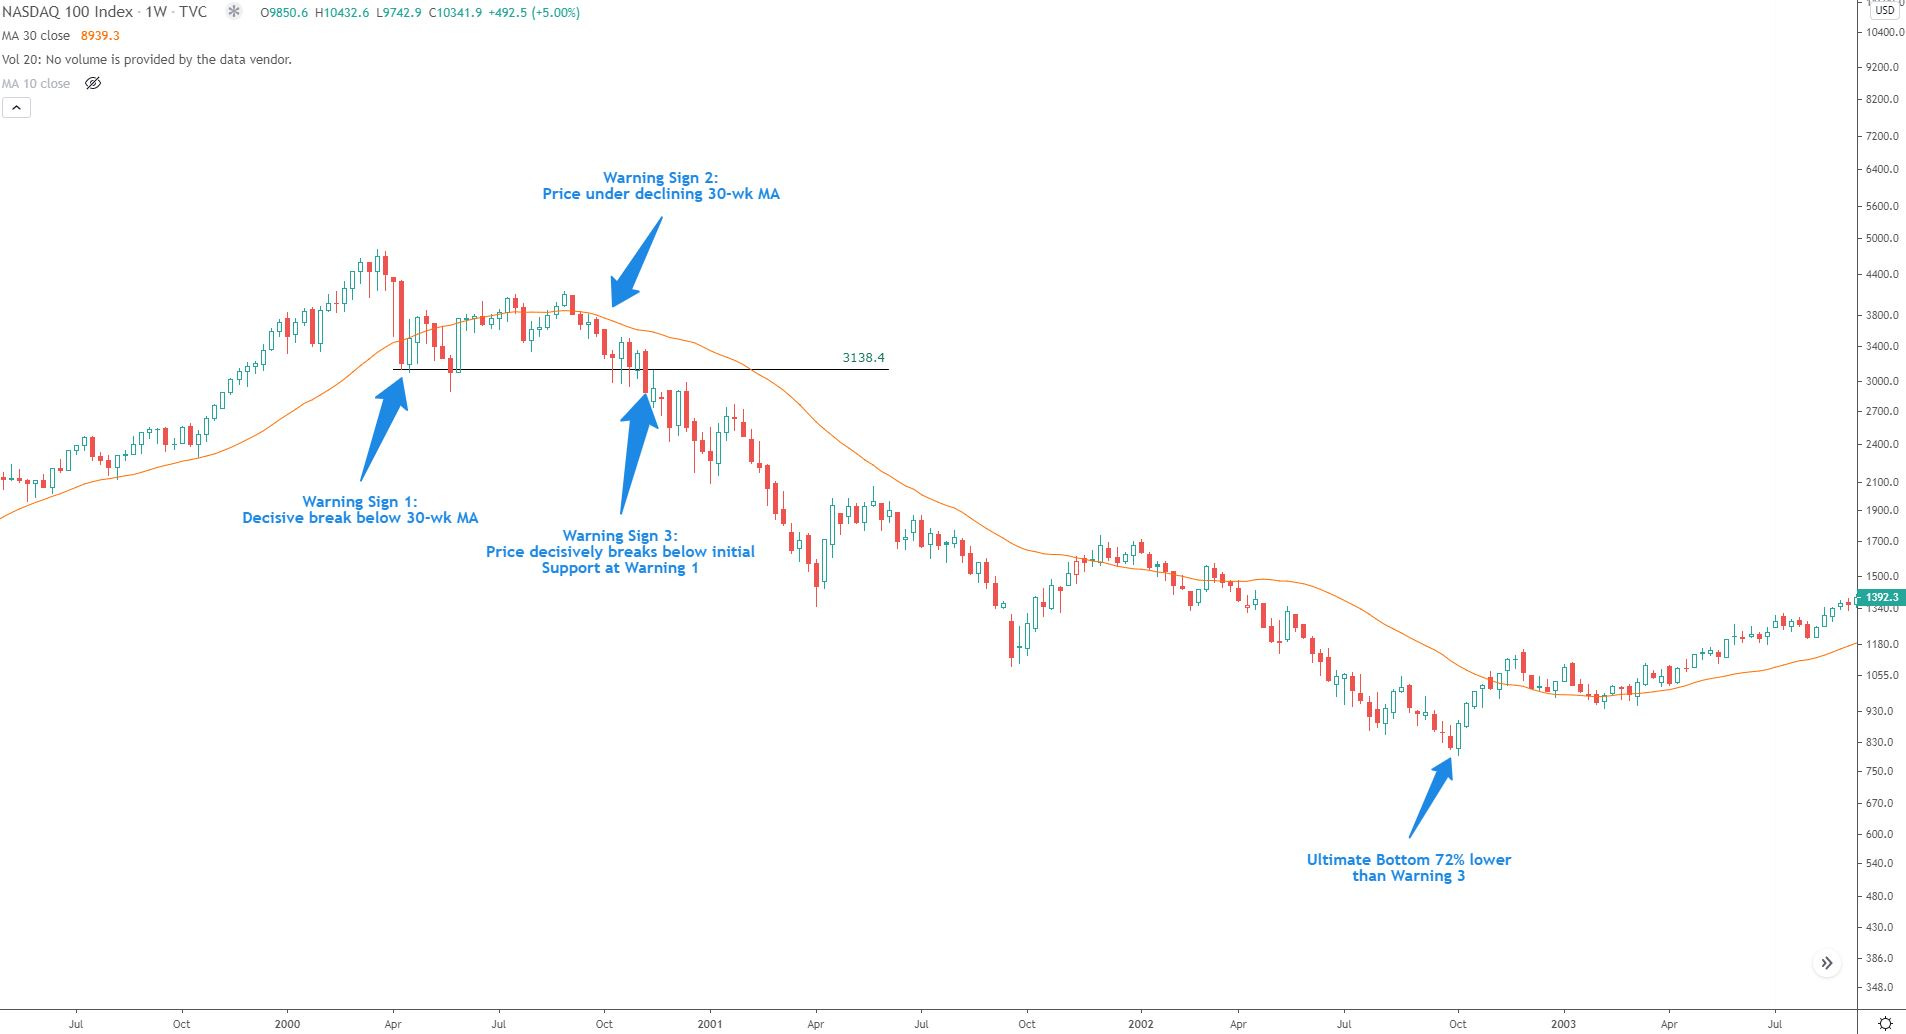
Two of these warnings came before the election itself, and one immediately following. If one hadn’t exited on either Warning 1 or 2, there was definitely still time to get out at Warning 3, which occurred about 70% above the ultimate bottom from that era. Proper portfolio management would have avoided the majority of these declines.
2008 Election Year Down Jones Industrials:
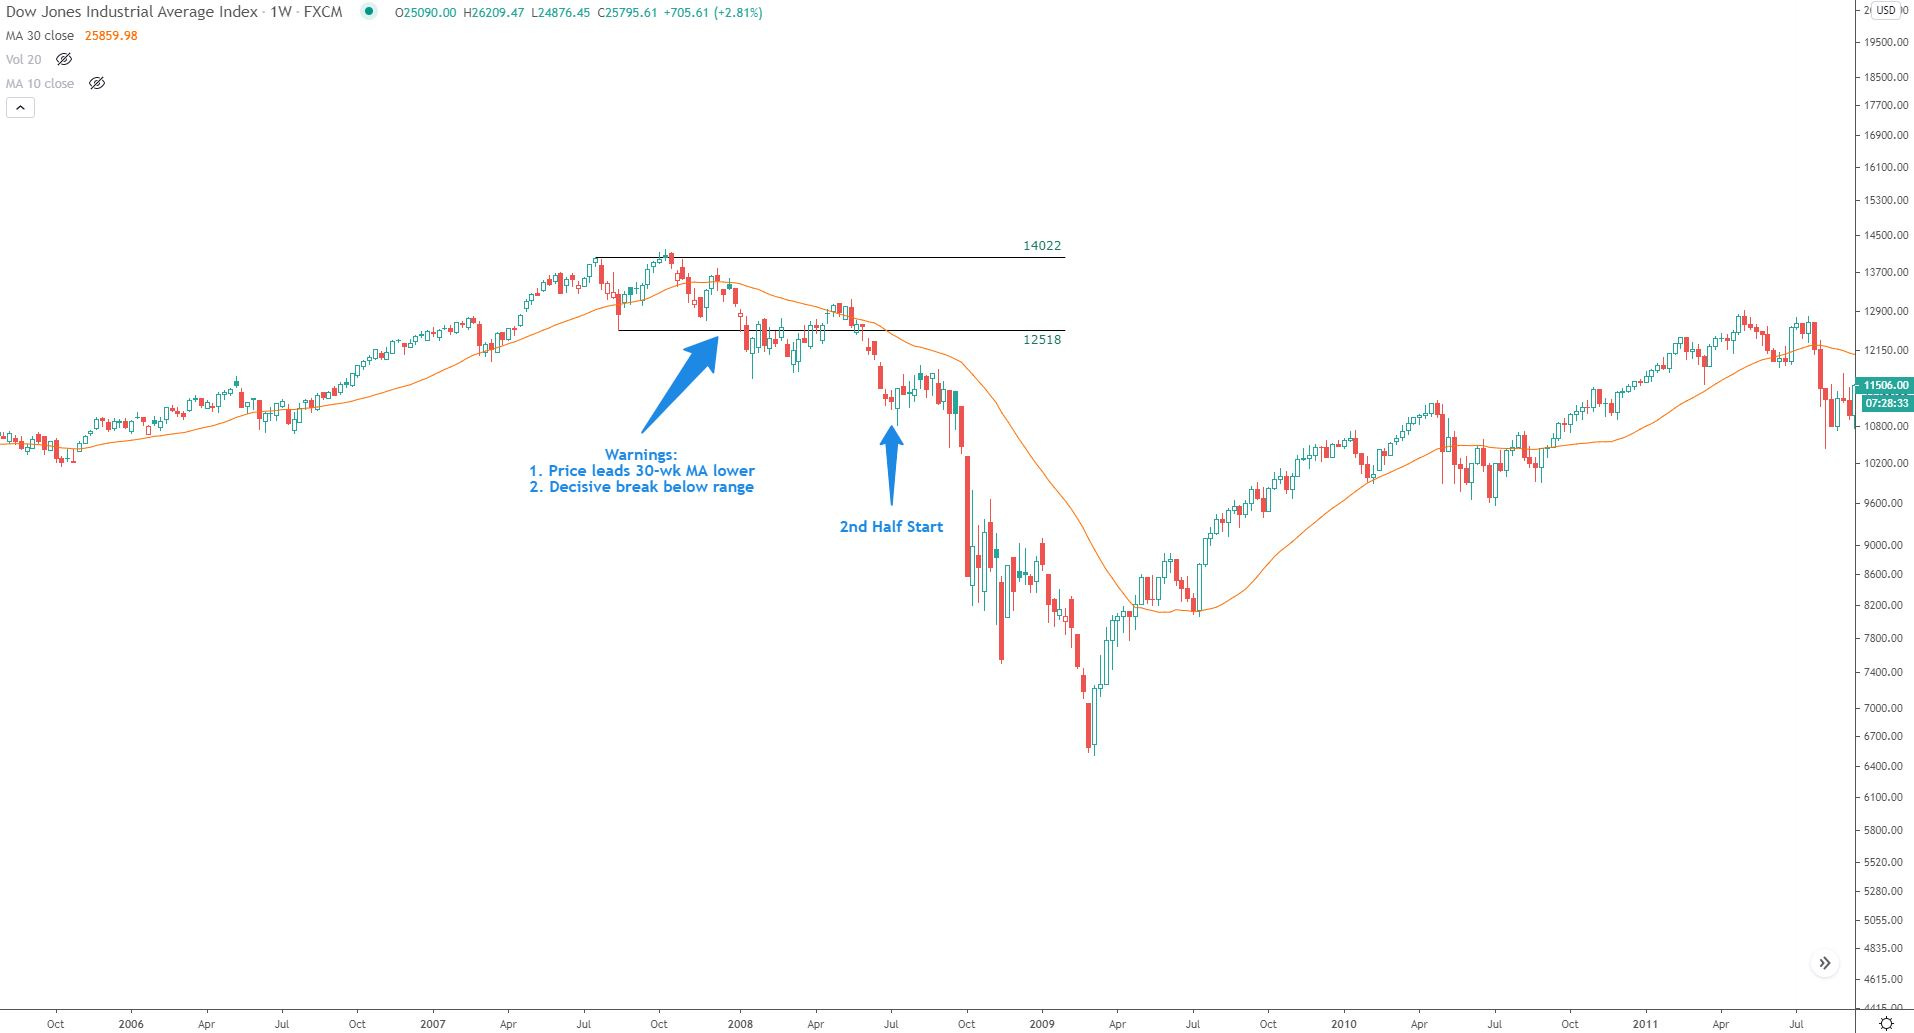
A few things I want to point out and a couple are shown on chart:
Prior to the election year, price had entered a range with chop and flattening 30-wk MA.
By the time the 2nd half of the 2008 election year came around, price was already breaking down and leading the 30-wk MA rapidly lower.
There was actually a rally from July-Sept for those that dared getting in the way of the wreck train.
Again, proper portfolio management would have avoided the majority of these declines.
So where are we now? Stay tuned for Sunday’s update for more where I’ll dive into the markets, but for now here is a chart of the Dow Jones Industrials:

One more thing I’ll point out about the 2000 and 2008 election years and how this year may be different: There is one very accurate bullish technical signal (Zweig Breadth Thrust) that recently triggered, which wasn’t triggered going into either 2000 and 2008. I’ll get into that in a future post.
So finally, what about gold seasonality? Well there’s a chart for that too.
Chart 3: Spot Gold $/Oz. Seasonal Average Returns - Filtered For US Presidential Election Years. Source: www.seasonax.com

As I noted in last Sunday’s post regarding gold:
I recently closed out gold and related positions (miners) not due to weakness, but rather due to fact that price is approaching historical resistance levels. If price should be able to rise and hold above the $1920/oz level, I will consider getting long again.
Here’s a weekly chart of Gold:
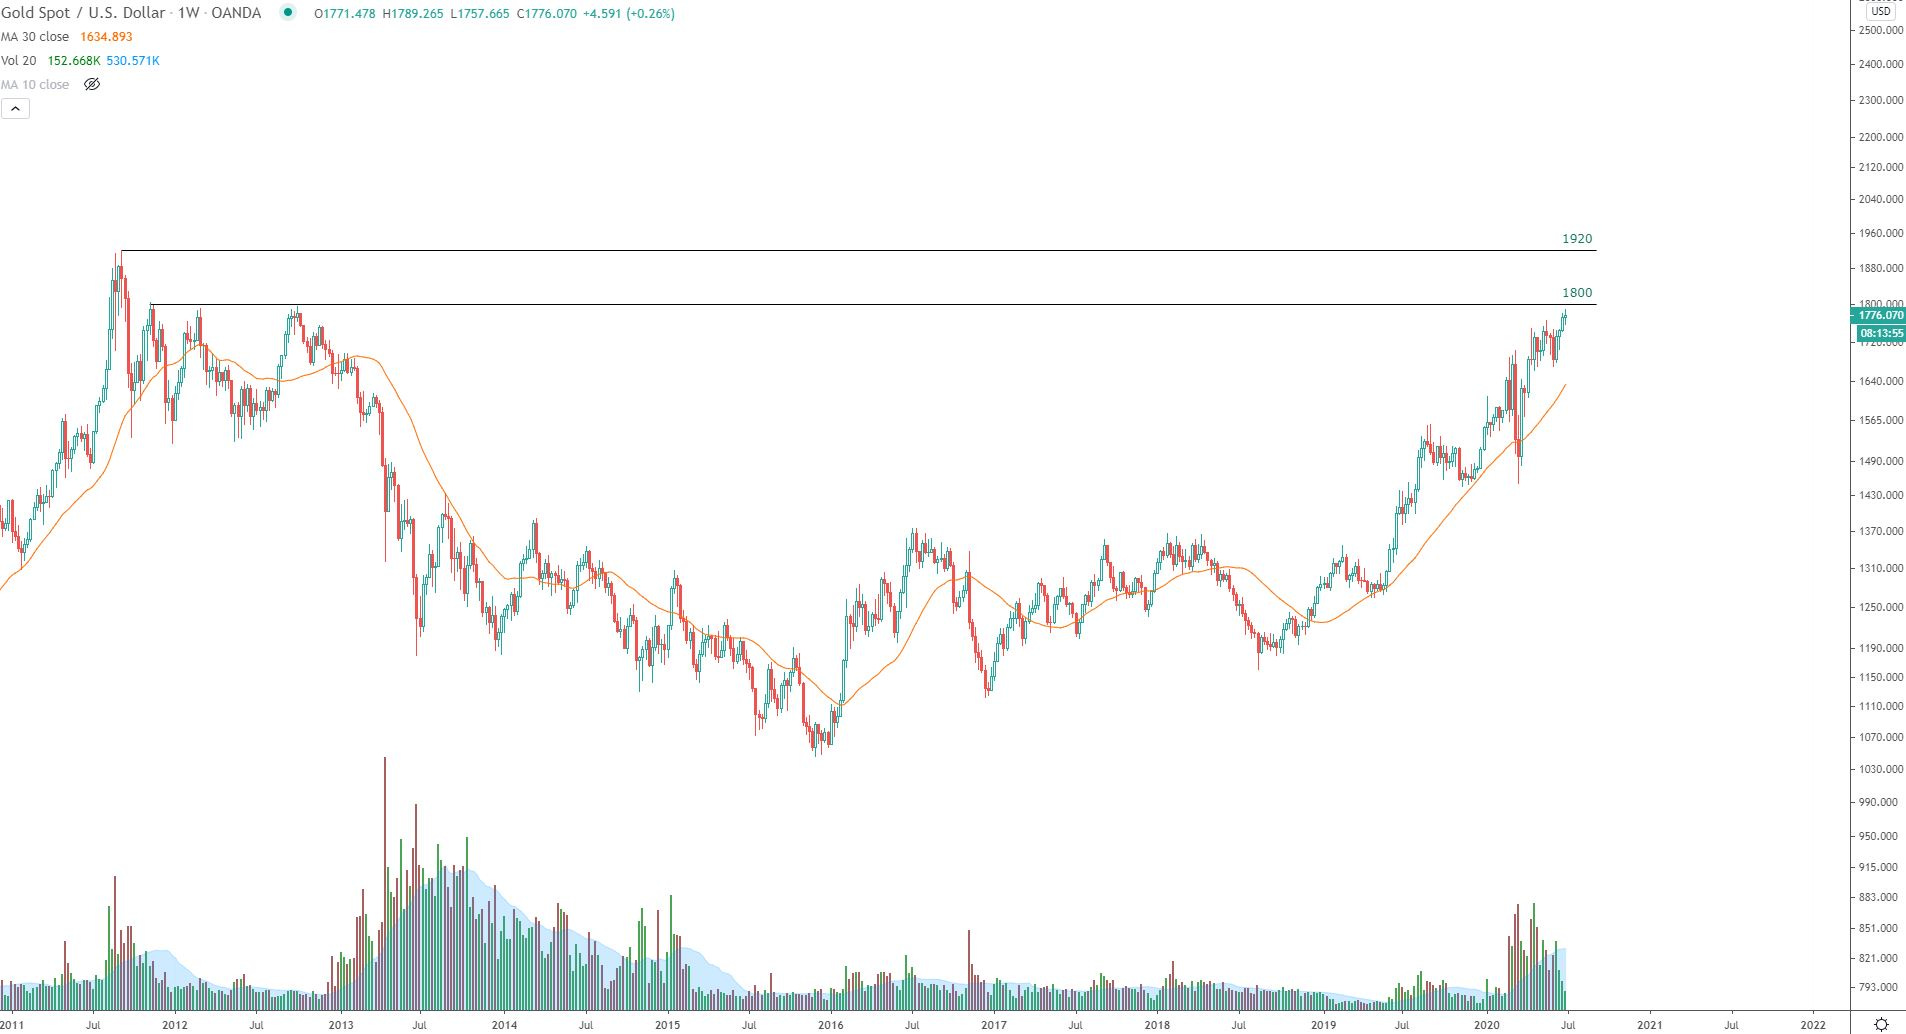
I am currently neutral on Gold, I have no positions, but will continue to monitor closely for price behavior around the $1800/oz level, and then again around $1900. If price is going to stall, or be met with supply from those levels I would much rather deploy my investable capital elsewhere.
Closing thoughts:
I believe we are in a period of chop and clear trading ranges with some leaders and laggards. I have said it repeatedly: This is a stock picker’s market. I believe strong technical analysis with disciplined approaches to entries & exits will prevail. I will continue to share updates on the Charts For Freedom portfolio in these uncertain times and I hope you subscribe to follow along on the journey.
All the best,
Trace