As we close out the month of March, it is time to take a look at the seasonality again. The last update was during the Jan/Feb transition, as the seasonality was entering one of the more bearish periods of the year, when filtered for post-election years.
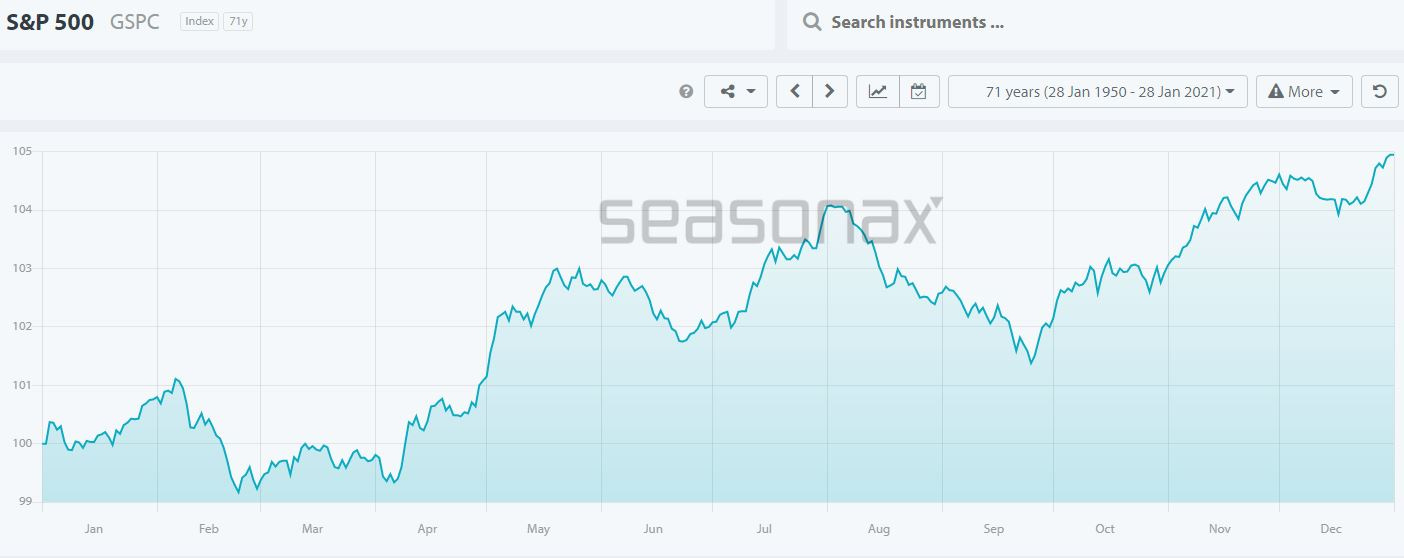
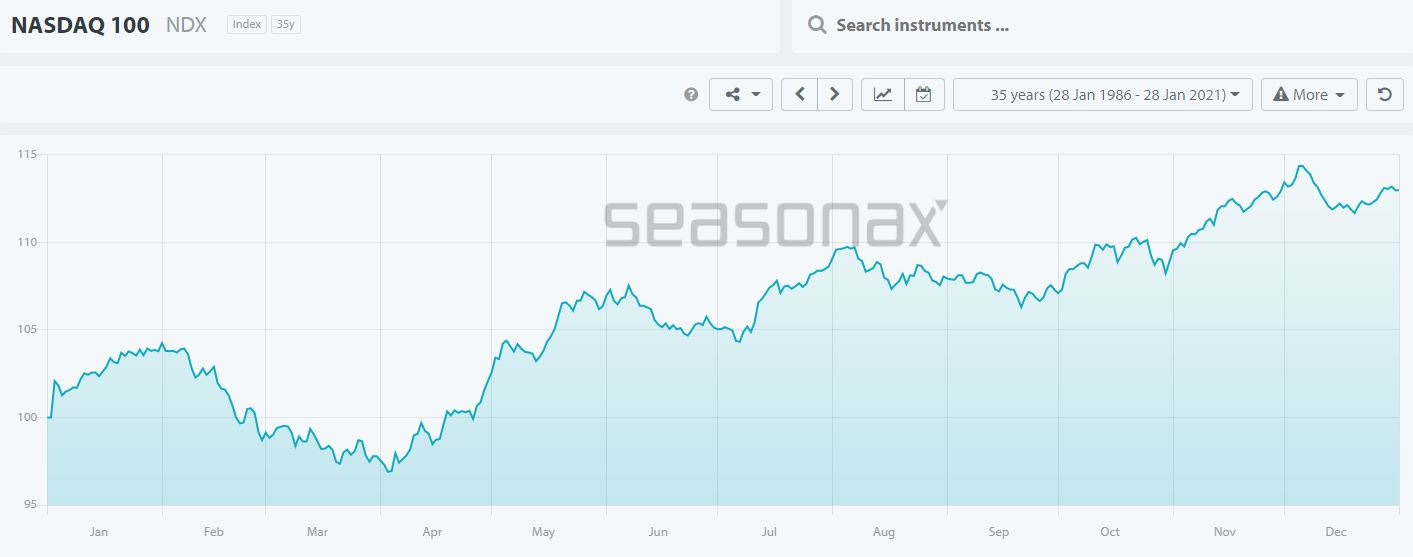
Here are the seasonal charts for SPX & NDX filtered for post-election years:
In general, there is a small window in February where prices either start out in a bullish move (SPX) or stay flat (NDX), but then in both indexes there is a pullback that lasts for a couple months
Nothing is guaranteed here, but this is something that I cannot ignore. I am on high alert for a pullback, and given the futures charts (shown below) I will definitely proceed cautiously on any open positions, and for any bullish positions that I take over the next 2 months or so.
So how did the seasonality (post-election year) impact the tape? Let’s take a look at the Feb & March action:
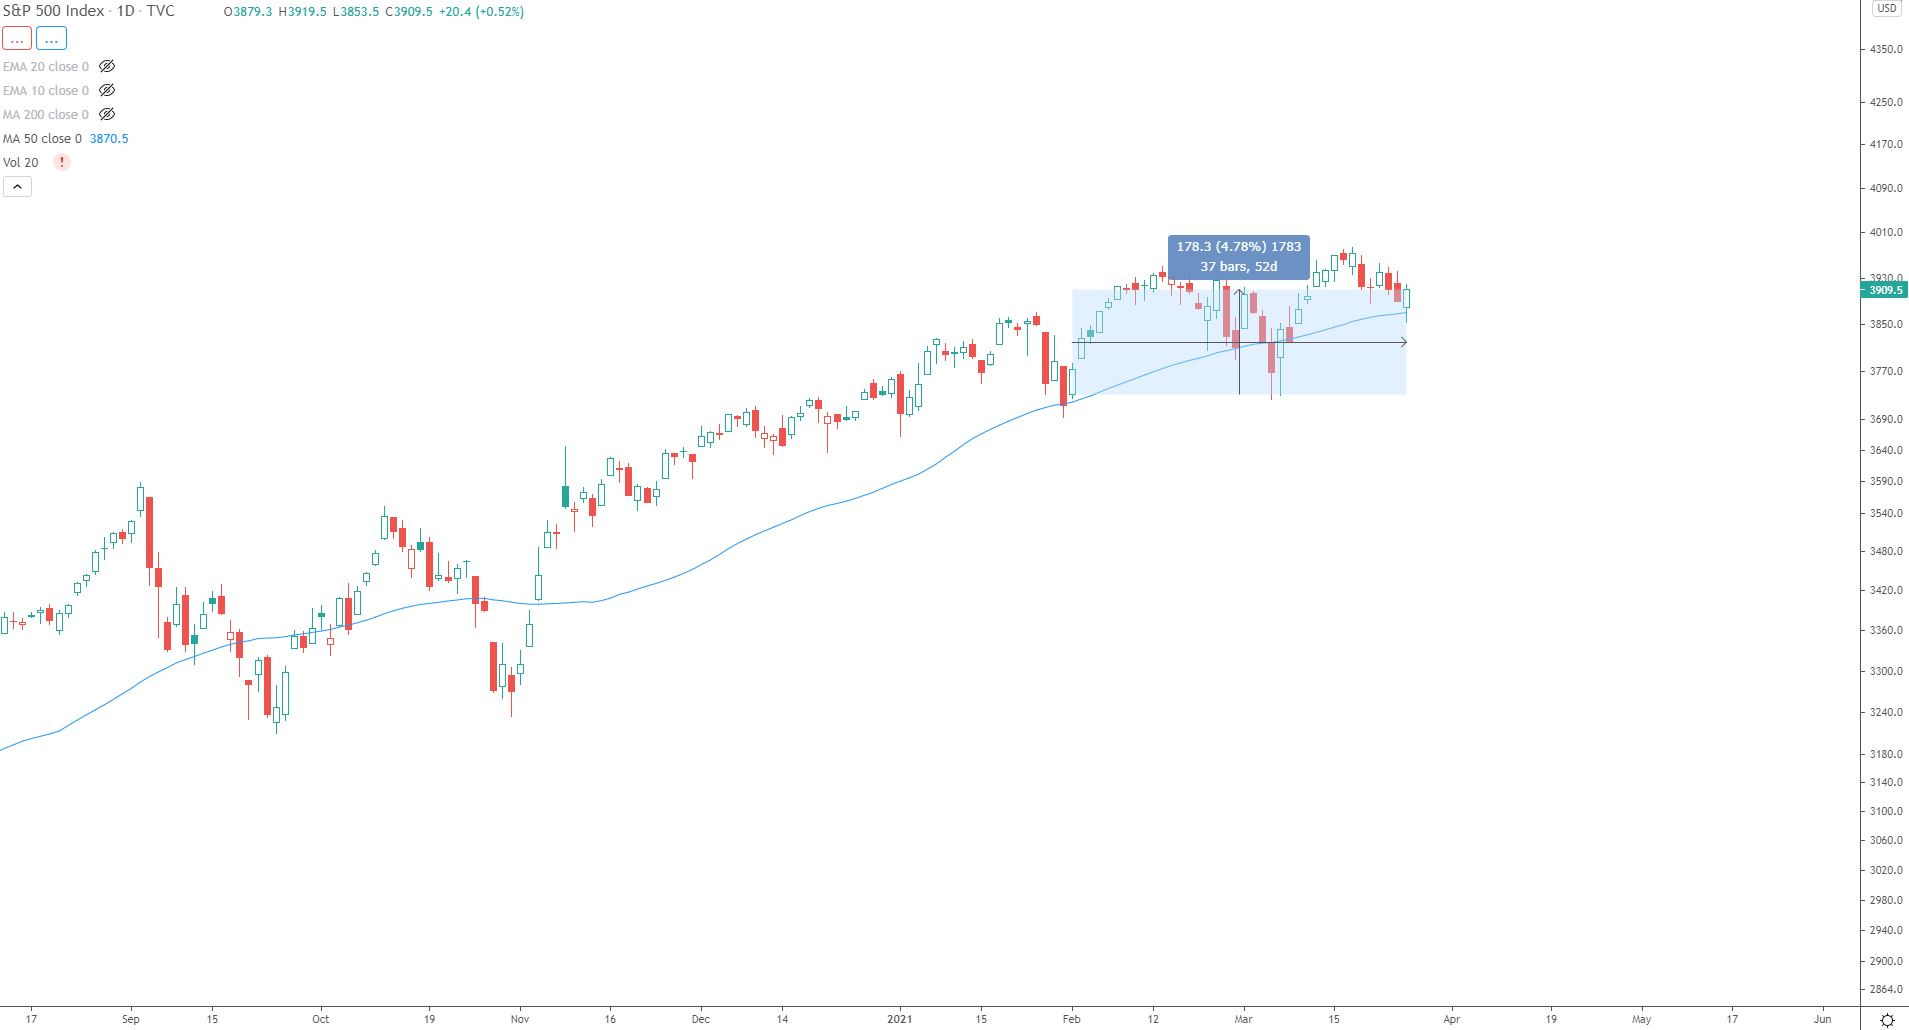
SPX Daily candles with Feb. 1 - March 25 highlighted:
This has showed strength (so far) during a historically bearish season
From the Feb. 1 open to yesterday’s close (March 25) this has increased by 4.78%
NDX Daily candles with Feb. 1 - March 25 highlighted:
This was more in line with the bearish seasonality
From the Feb. 1 open to yesterday’s close (March 25) this decreased by 2.2%
My takeaways:
The seasonality is nice to have in our back pocket for reference, but this isn’t something to put 100% trust in.
There are years where stocks move in the complete opposite direction as the seasonality would suggest (just see SPX from this year).
But I do view the strength in SPX as a very bullish development. NDX played right along with the seasonal headwinds.
Looking forward, the seasonality is suggesting some good times ahead:
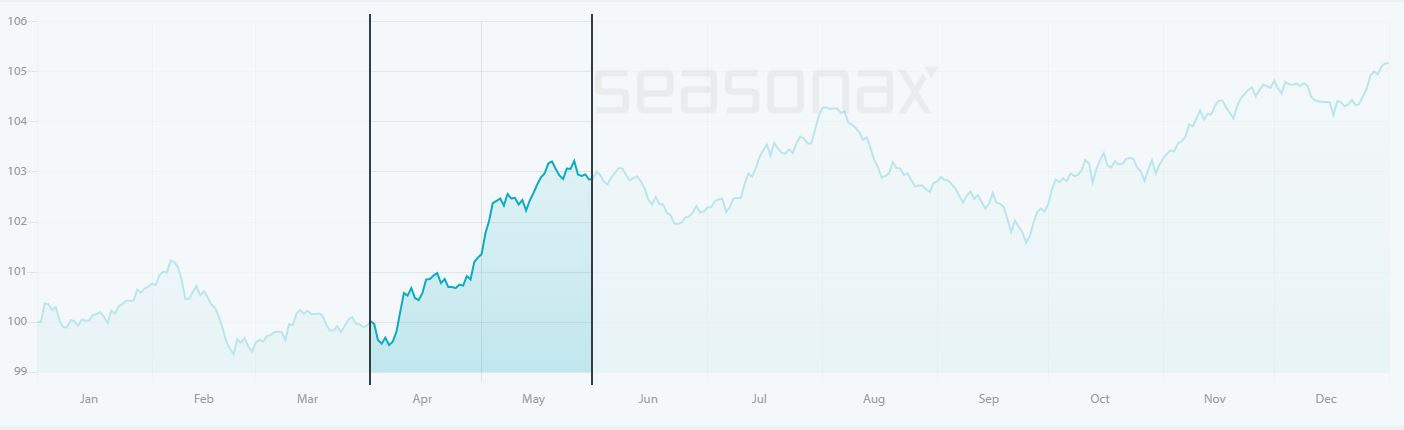
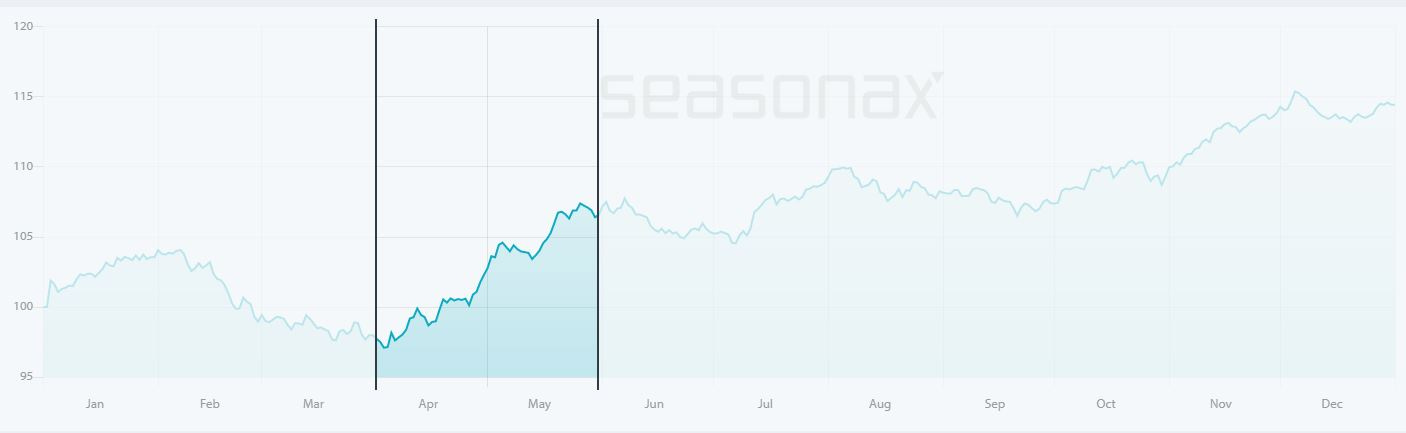
SPX with April 1 - May 31 period highlighted:
The average return is 3.2%, which comes out to 21.09% annualized return. Not bad!
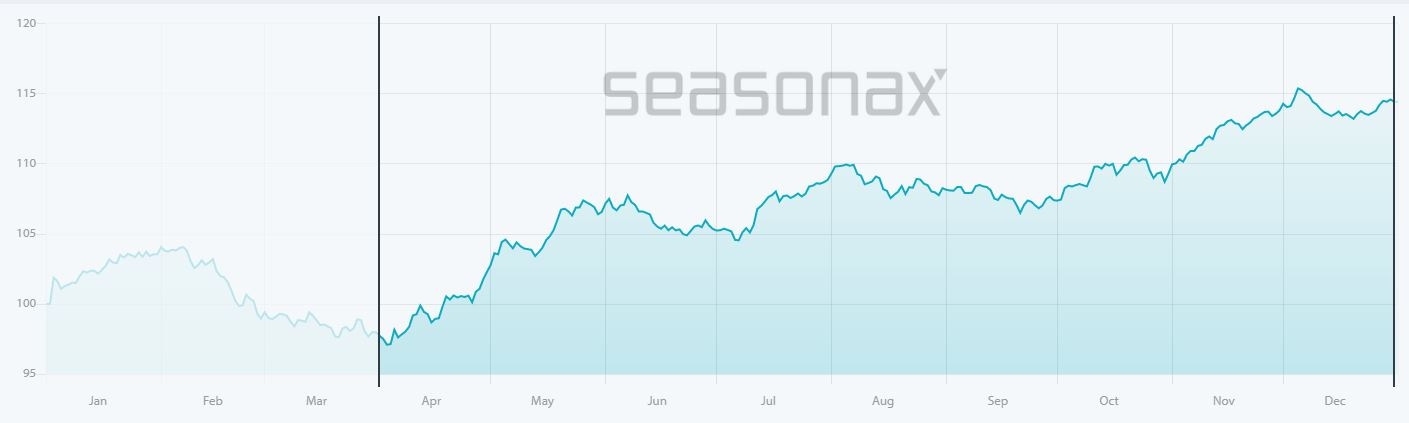
SPX with April 1 - Dec. 31 period highlighted:
There’s some chop along the way, but the rest of year returns starting April 1 are 5.94%, which annualizes to 7.91%.
There’s some rough periods here, which no doubt weigh on the returns. During the month of June and the two month period of Aug-Sep there’s some historically headwinds for the markets.
NDX with April 1 - May 31 period highlighted:
Even better than the SPX, the average return here is 3.71%, which comes out to a very strong 24.85% annualized return.
NDX with April 1 - Dec. 31 period highlighted:
A very impressive 21.2% return, which annualizes to 29.2%.
Bitcoin:
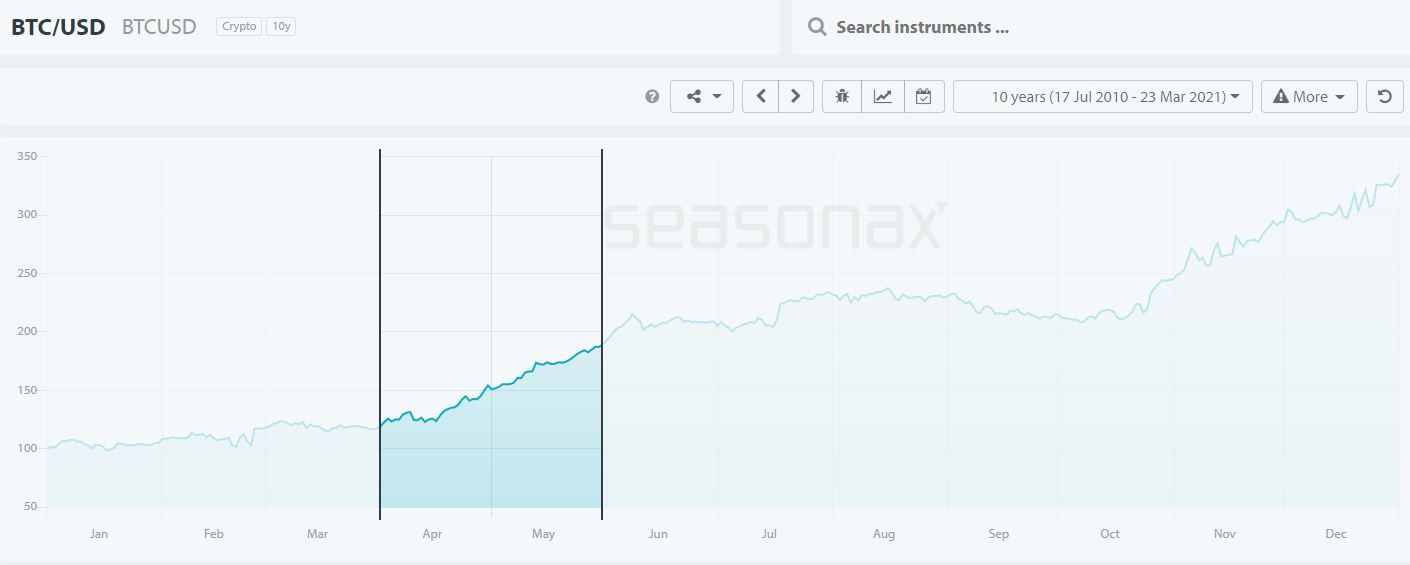
I hesitate to share the bitcoin seasonality because it comes from a VERY small sample size. But it is still interesting to look at nonetheless. The historic gains are so massive that even a fraction of those returns would do wonders.
April 1 - May 31 period highlighted:
I have not filtered out any years due to the short history (10 years of data)
66.4% average returns during the two month period which annualizes to 2,117%. Incredible.
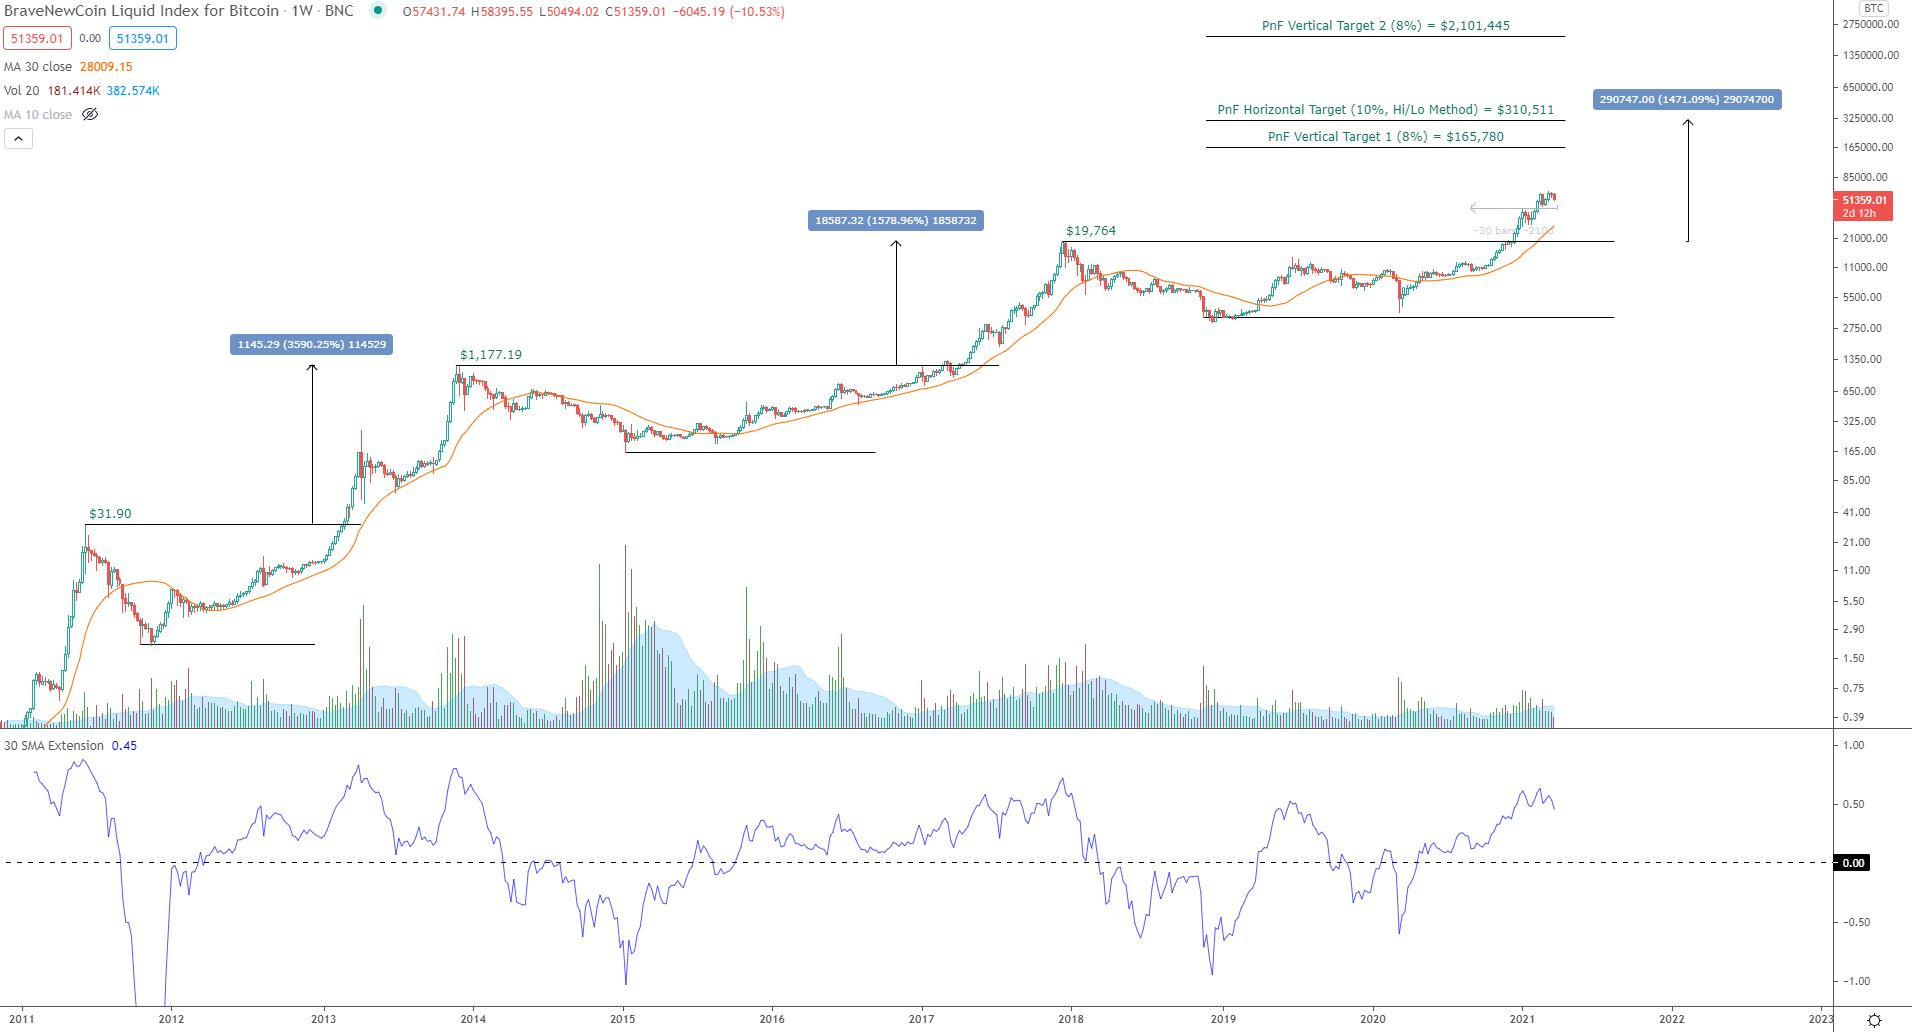
There is a lull mid-year, which would actually line up with the current tape. The price has risen quite dramatically (even for bitcoin) over the last 6 months. From October 1, there has been a 376% rise and the separation from the 30-week sma is pretty wide:
Extension from the 30-week SMA shown at bottom of the chart.
It is great to see an extension of such magnitude, as this historically brings in bull markets.
But each of the prior bull markets had periods where price was required to rest or pullback closer to the 30-week.
Conclusion:
The bullish seasonality that we are about to enter for stocks and bitcoin has been incredible. If this holds true for 2021, we should be in for some great times. But as noted above, this is a “nice to have” for reference. It’s not something I’m going to blindly go all-in on. Risk management is still something that should take priority over seasonality. If I have a position that is due to be stopped out on weakness i.e. closing below the 10-week sma, then by all means I will close it out. Proper position sizing and risk management are always a must.