If you are reading this as a premium member (non-trial) then you will be grandfathered in at the initial rates of $30/mo. or $300/yr. New members will be paying higher rates beginning Monday, February 1. I sincerely thank you for being a founding member over the first 6-7 months and hope to continue with you on-board going forward.
This was a wild week, with probably the most market chatter since the COVID selloff last March. Everyone seemed to have an opinion on the market this week, even text groups I’m in with high school / college friends that are usually dedicated to sports talk & dad jokes were flooded with WSB, Robinhood and GameStop messages. I think there’s a bigger message here, but its too early to make predictions on the long term consequences of what happened with Robinhood and other brokerages shutting down services to some of their clients on certain stocks and crypto purchases.
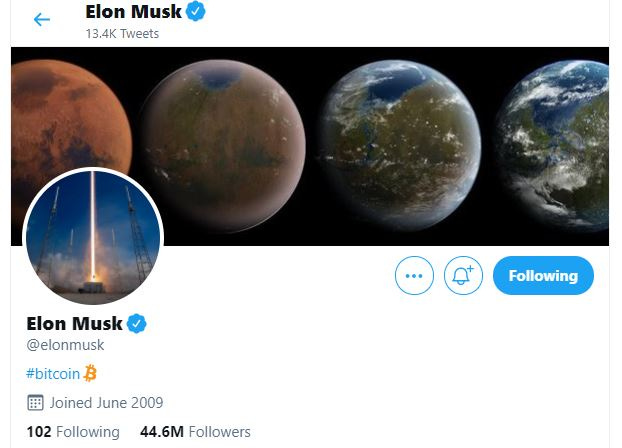
The bitcoiner in me wants to say “see, this is proof that bitcoin is the answer to the current system” but I know I’m biased, and if bitcoin is indeed the answer, it will prove itself in time. With that said, there sure seems to be a movement and gravitation towards bitcoin from some larger players now. Just take a look at Elon’s twitter bio:
Who now joins Jack Dorsey:
My beliefs are the same as those I shared back in the November 15th update, when Bitcoin was trading at the $15k-$16k range:
Bitcoin - Just like falling in love, or falling asleep - it’s going to happen “slowly then suddenly”. Right now this has an approximate $290 billion market cap. I don’t see how this doesn’t become a trillion+ dollar market cap in the next two years. The charts are certainly suggesting it. The brightest minds in the world are working on this network and constantly surprising me with new ways to serve people all over the world.
Just as a frog in warm water comes to a boil “slowly then suddenly”, I sometimes wonder if the frog from this will be the banks and other financial institutions choosing not to implement or embrace Bitcoin. It is inevitable - just like Thanos, but with a better ending.
If I had to choose one trade for the next 15 months, it would be…Bitcoin (even with that potential 30% pullback). I think of it as the Dr. Strange “one scenario” from Infinity Wars:
I suspect, based on the WSB movement that is taking place, there will be a lot of people jumping to crypto and they’ll first find themselves in altcoins because of their “cheaper” prices. But over time, I believe people will realize that it would behoove them to hold some bitcoin in their portfolios. There are large buyers of the corporate and institutional variety lining up to add bitcoin to their balance sheets. Buying begets buying. Jack Dorsey and Paul Tudor Jones are the new type of buyer this bull cycle. They made it less taboo to add bitcoin. Now there are the Michael Saylor’s of the world promoting it. Blackrock just filed paperwork to add it to two of their investments.
Bitcoin just needed a spark, and the rest is going to take care of itself. But this is my biased opinion. All I can do is follow the charts and let them guide me for my investments and trades, so that’s what I will do. /rant
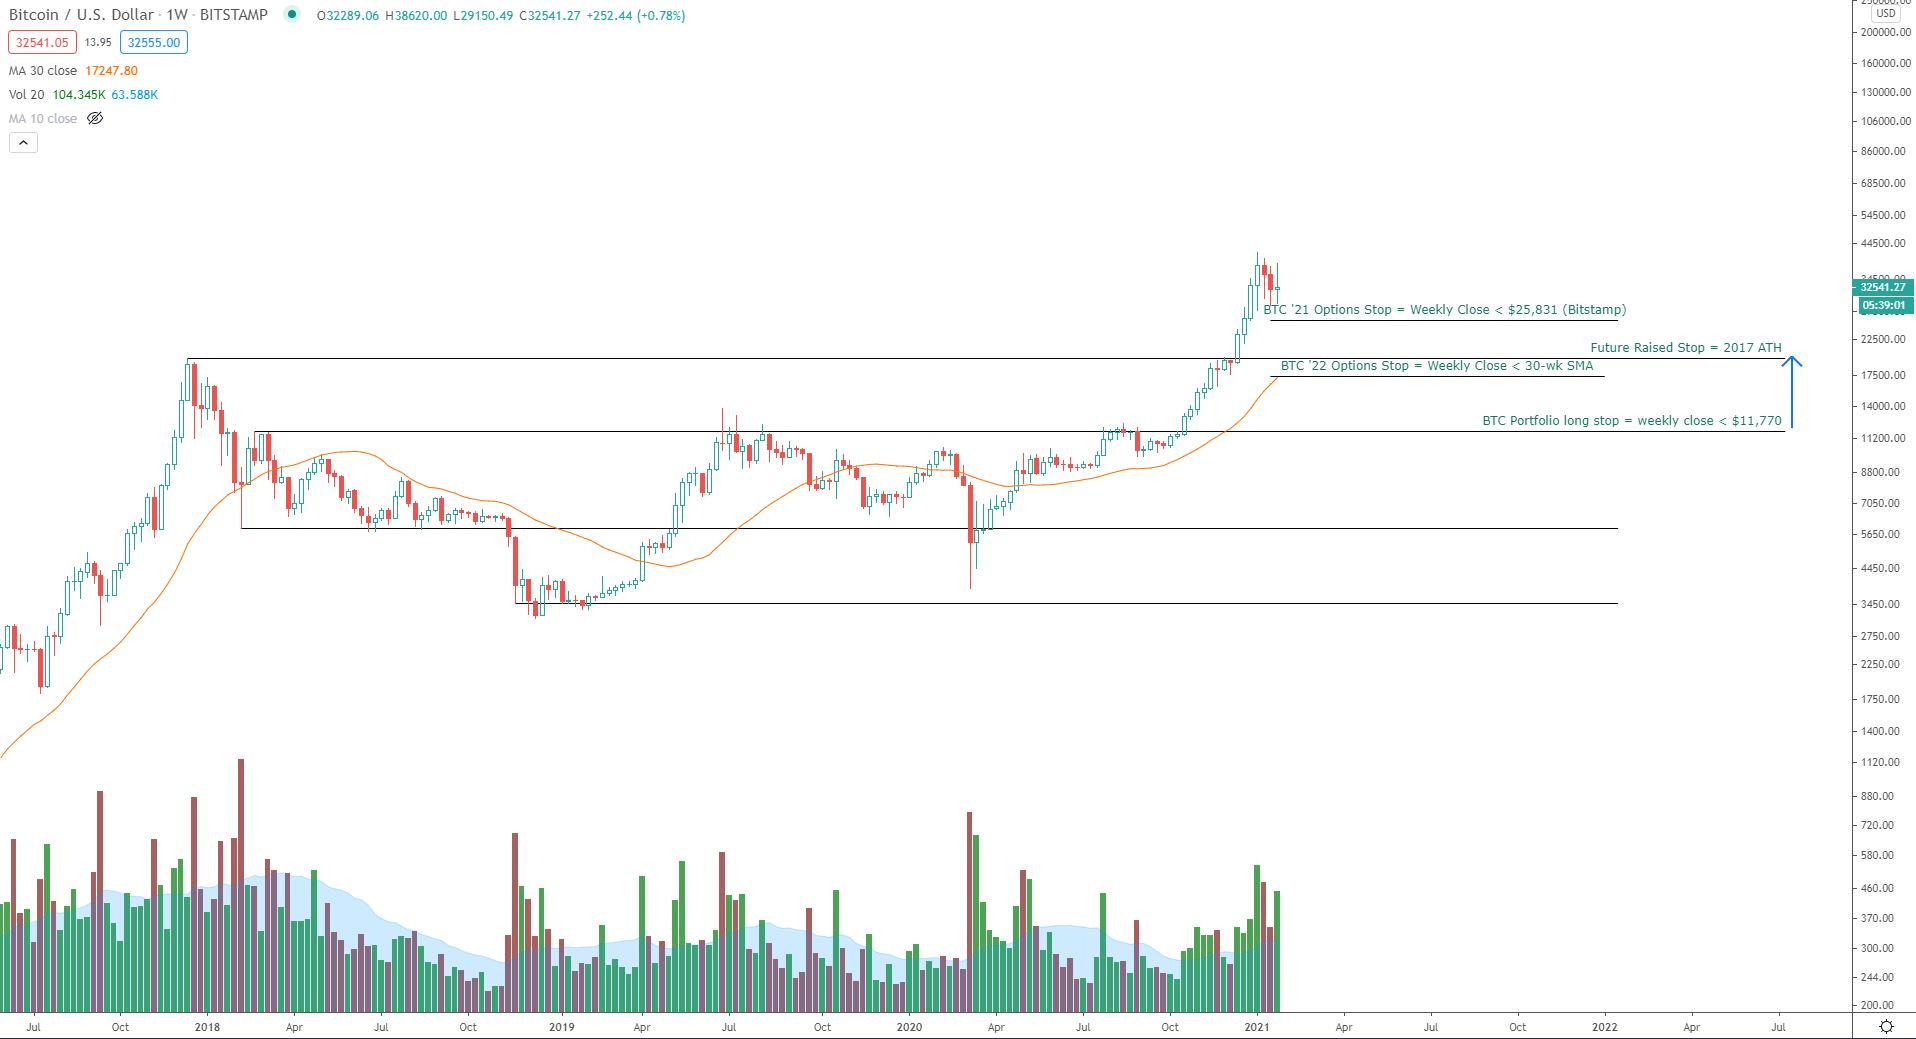
Here is the updated monthly Bitcoin chart:
It looks like the bull market is just getting started, and there is plenty of upside ahead
Based on the wick that was left on the January candle, there may be some pause, which would allow something like the 12-month sma to catch up, or at least get closer to current prices
I am leaving the door open to add even more calls should price pull back to the primary trend line of the 2h PnF chart. Later on, should the 30-week sma get tagged and prices bounce from it, I will possibly add even more at that time.
That’s enough on Bitcoin for now. I want to get into the Major Indexes and their seasonal charts, and take a look at the futures charts, which are showing some cracks and signs of weakness, as the bullish 30 minute PnF trends are now broken and new bearish trends are in place.
Monthly candle charts:
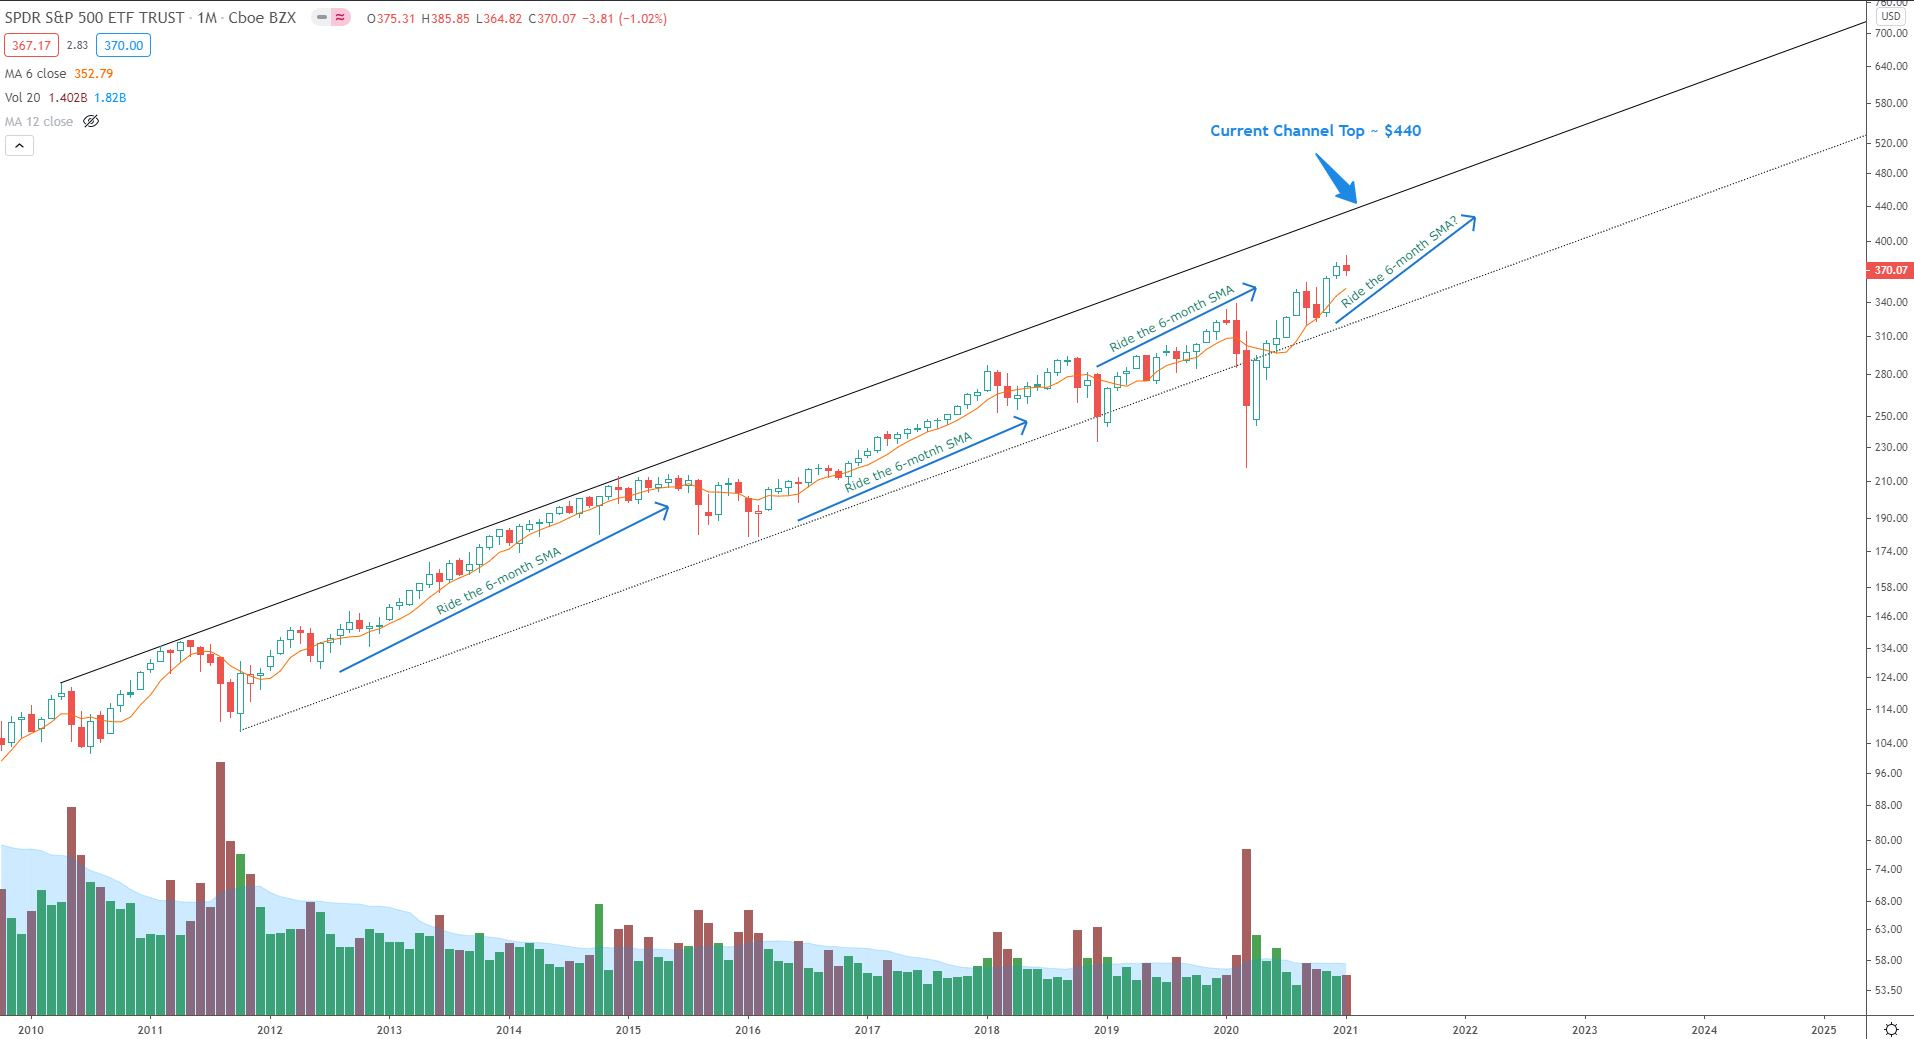
SPY
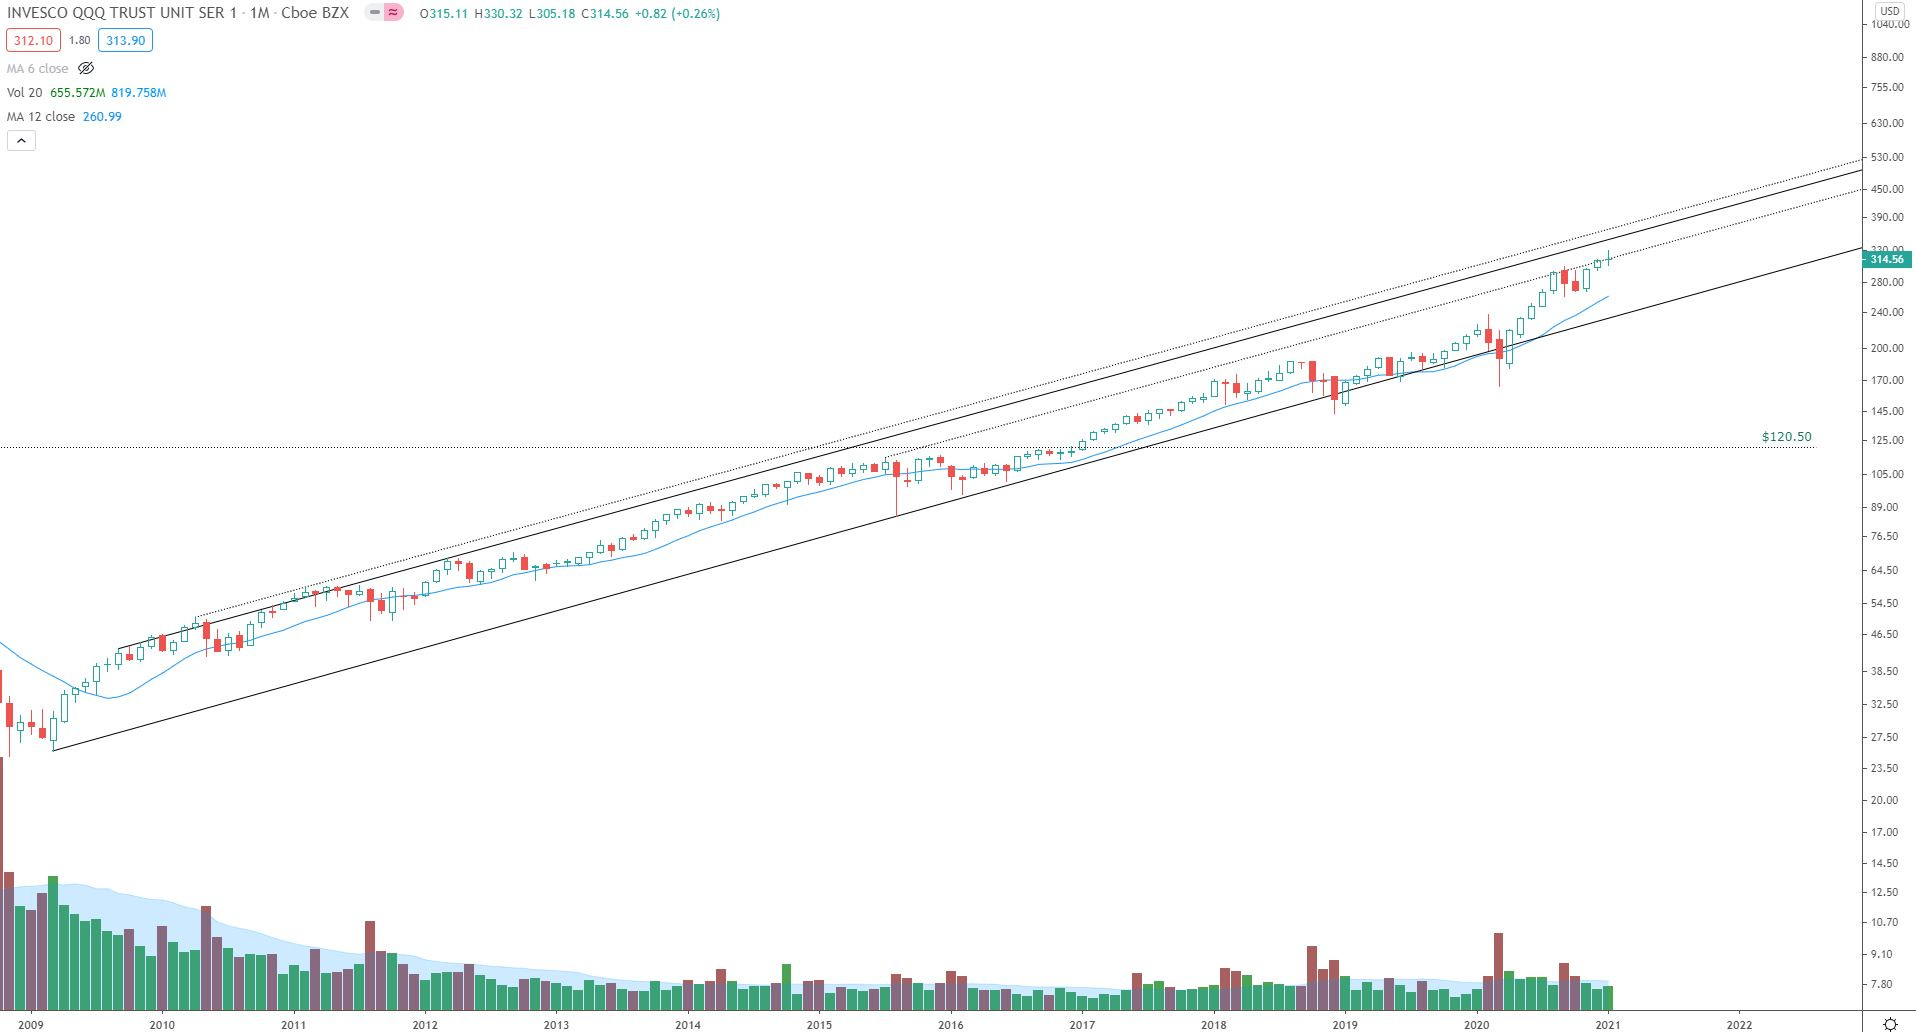
QQQ
IWM
All of the charts above show long wicks above. They are also getting stretched from their key moving averages (6-sma, 12-sma)
The tape is showing a weakening of the upward thrust, there are long wicks above on many charts, and the seasonal headwinds may be coming into play very soon
Seasonality
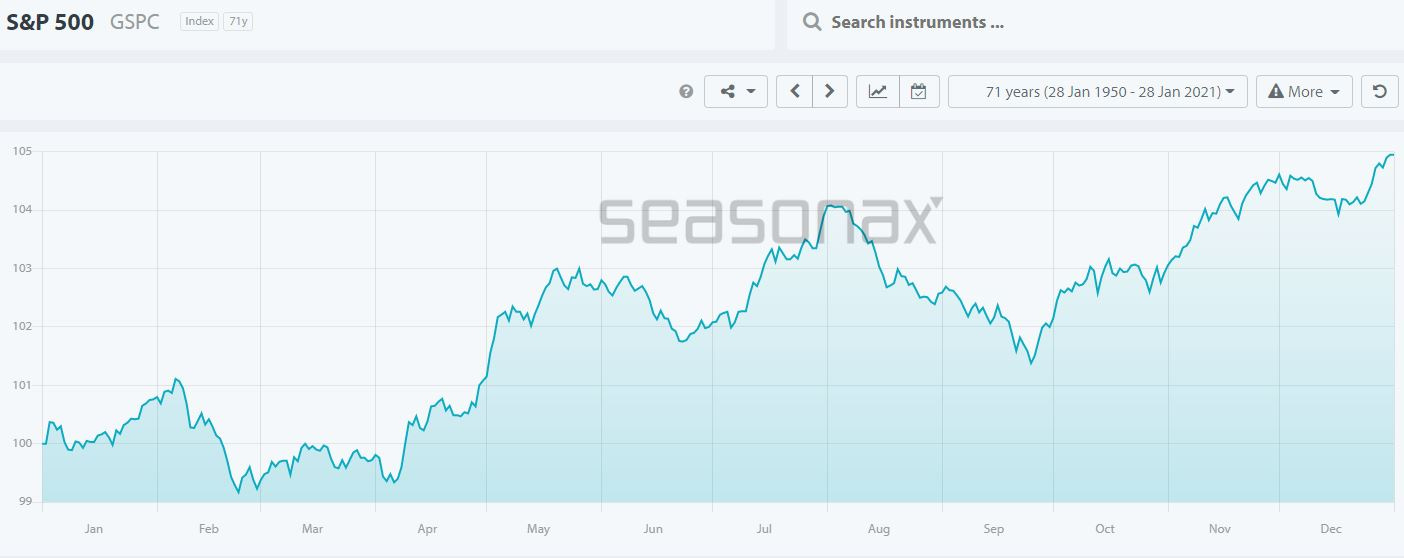
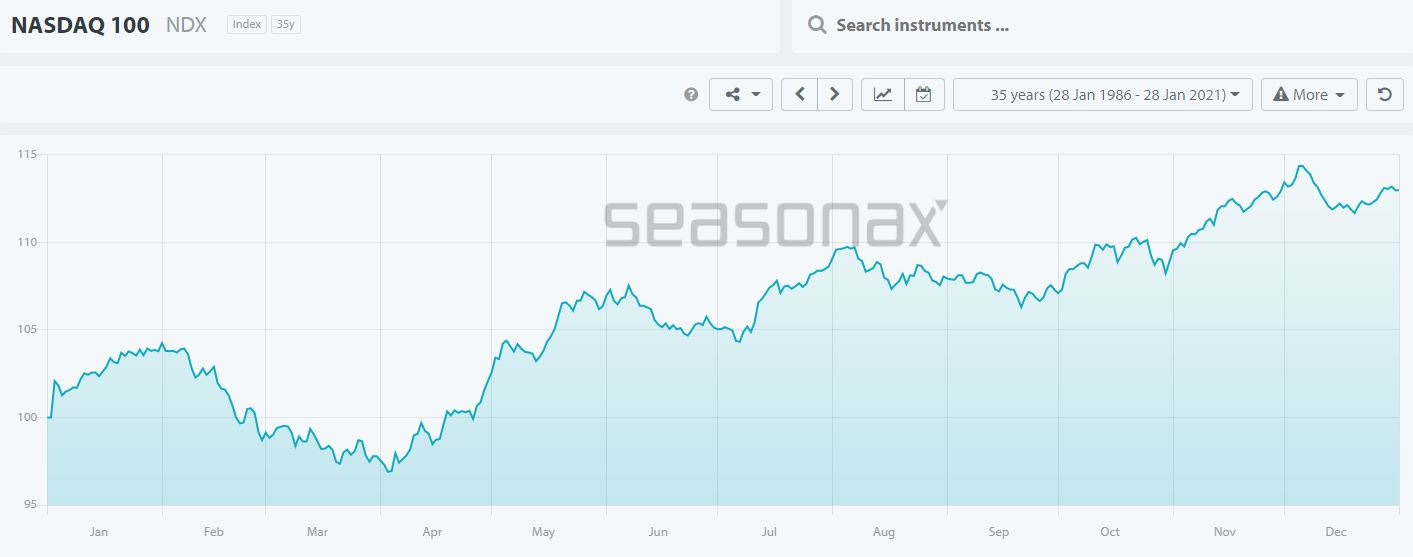
Here are the seasonal charts for SPX & NDX filtered for post-election years:
In general, there is a small window in February where prices either start out in a bullish move (SPX) or stay flat (NDX), but then in both indexes there is a pullback that lasts for a couple months
Nothing is guaranteed here, but this is something that I cannot ignore. I am on high alert for a pullback, and given the futures charts (shown below) I will definitely proceed cautiously on any open positions, and for any bullish positions that I take over the next 2 months or so.
Futures charts
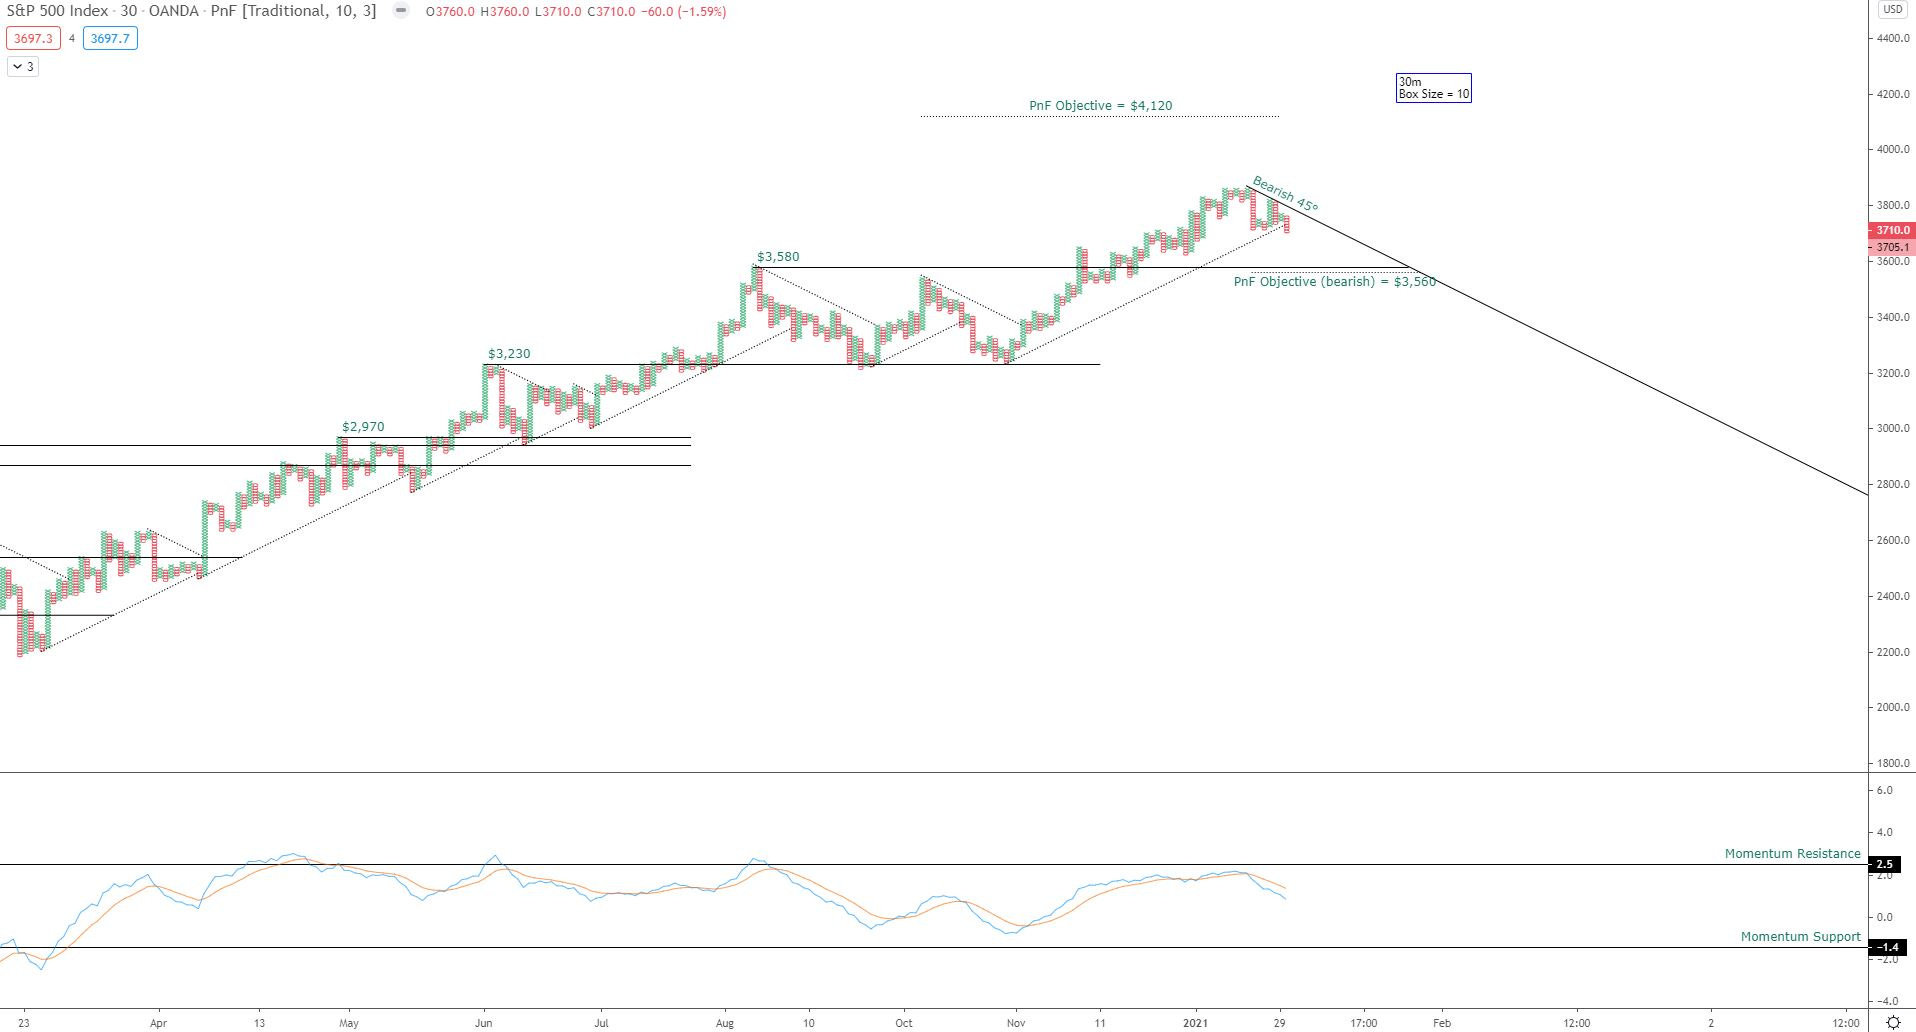
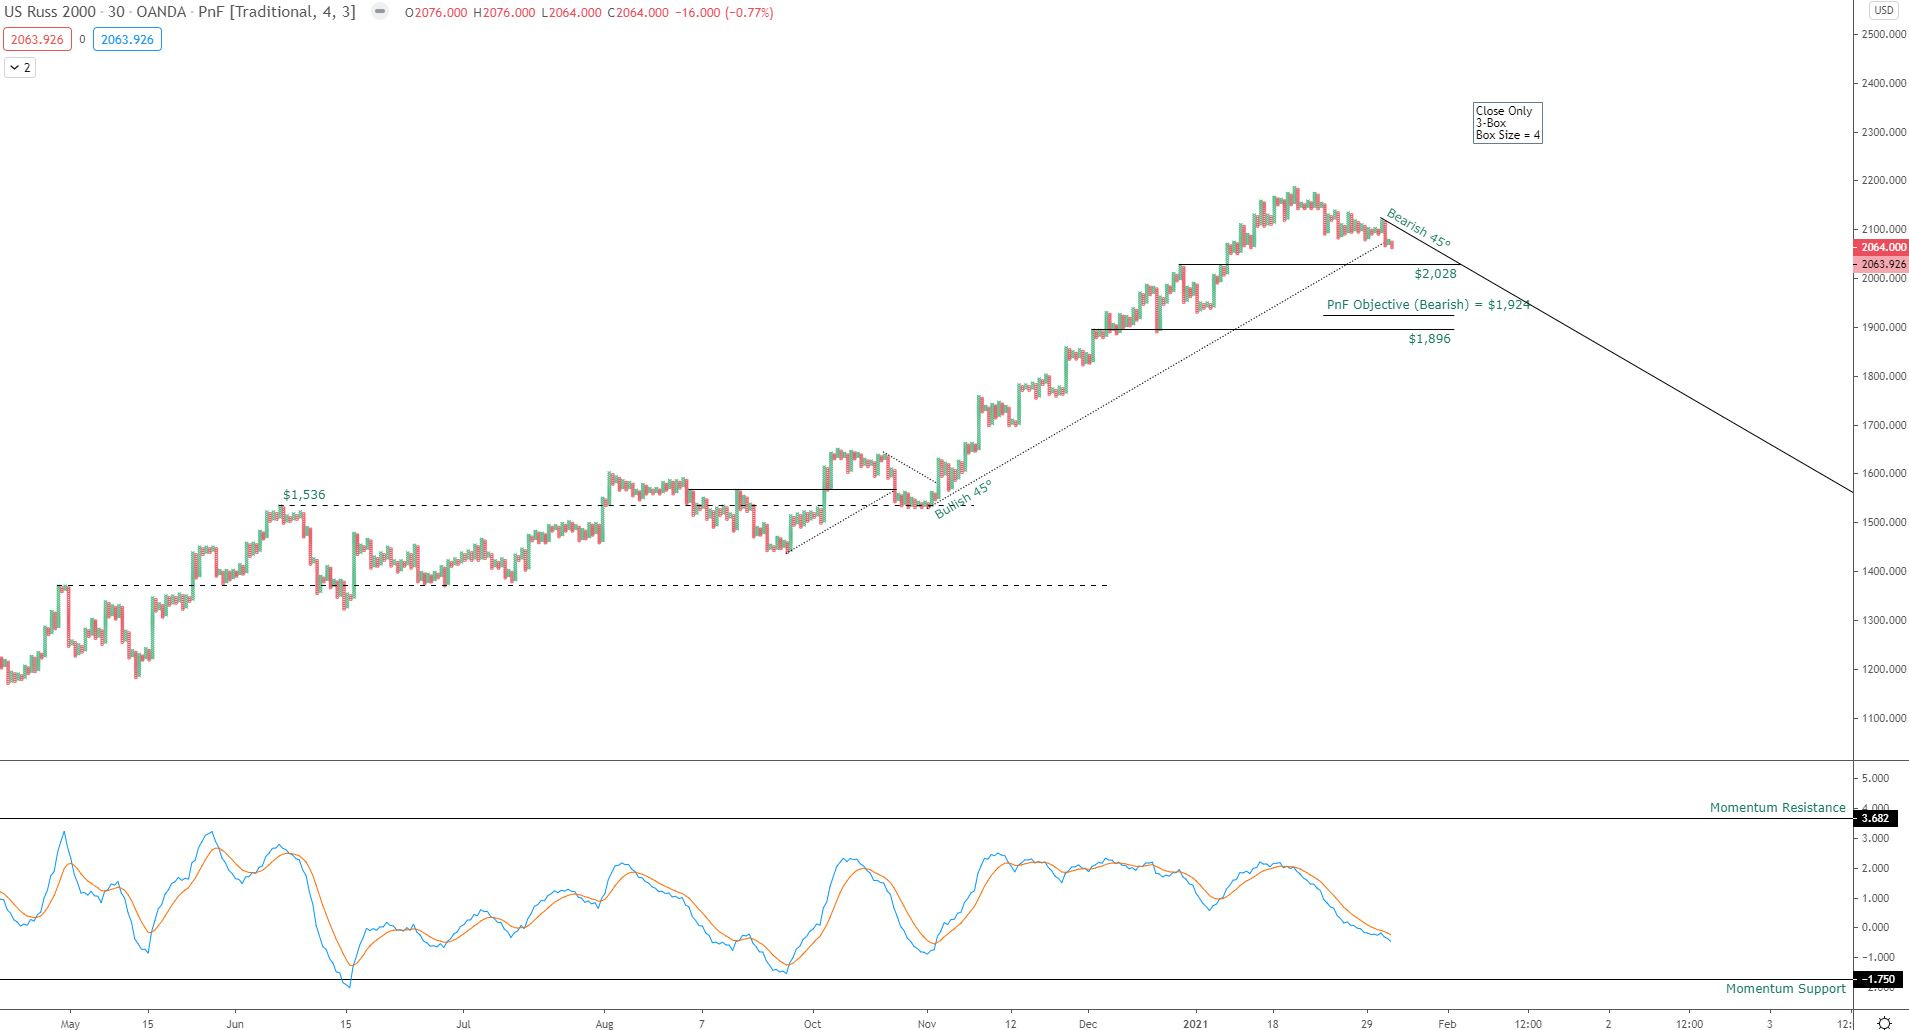
All of the futures charts below are Point and Figure variety, on the 30 minute time frame. They are all now in bearish trends, which is another red flag for me and evidence that the bearish seasonality may be coming into play.
SPX500
I’ve shown a bearish target at $3,560, which also happens to be right in the proximity of the early September buying climax ($3,580)
Momentum was recently rejected at the resistance line, and the bearish crossover is now in
NAS100
I’ve shown a bearish target at $12,475, which also happens to be right in the proximity of the early September buying climax ($12,450)
Momentum had failed to even reach the levels seen in early September, and the bearish crossover is in.
US2000
I’ve shown a bearish target at the $1,924 level, which also happens to be one of the prior upside counts we saw achieved. Remember the targets around $1,912-$1,930 back in December?
A reset to the targets shared above (for all three indexes), would likely shake out some recent bulls and provide the needed sentiment reset to get things going again. Perhaps there will be some chopping action to follow, which would allow the momentum indicators to establish positive divergences by March. Time to be nimble, respect stops, and look for the best opportunities as they present themselves.
Gold and Silver
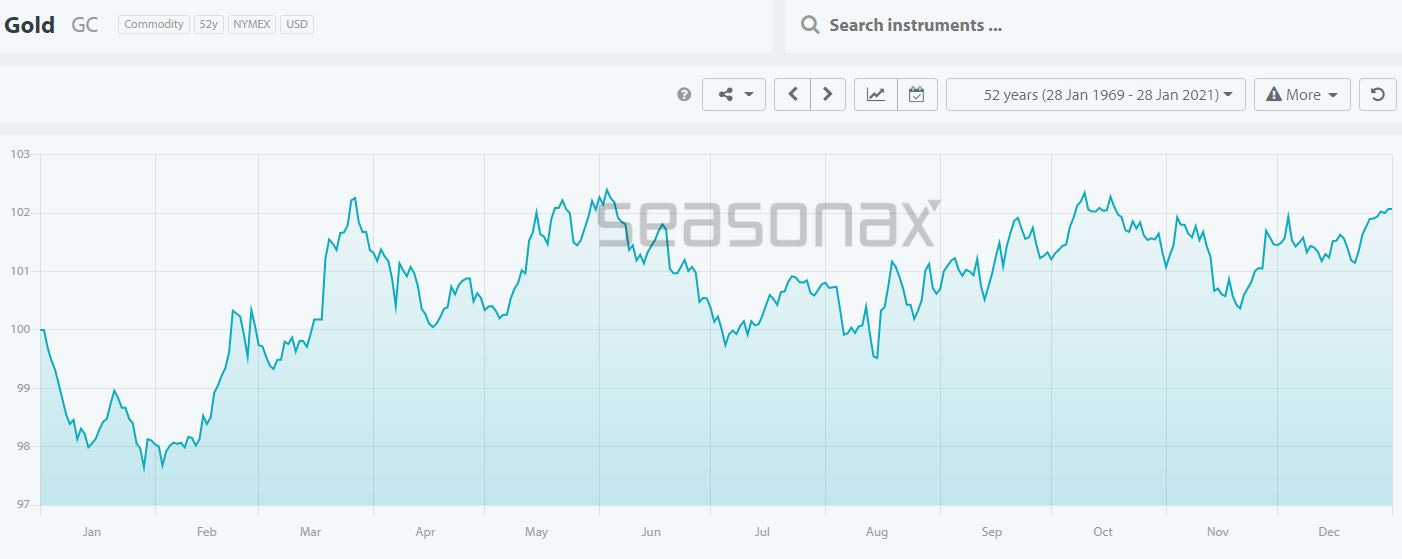
On a brighter note, the seasonality is currently bullish for both metals, filtered for post-election years, as shown in the charts below.
Gold Seasonality (Post-Election Years)
Silver Seasonality (Post Election Years)
Here are the monthly charts of each metals
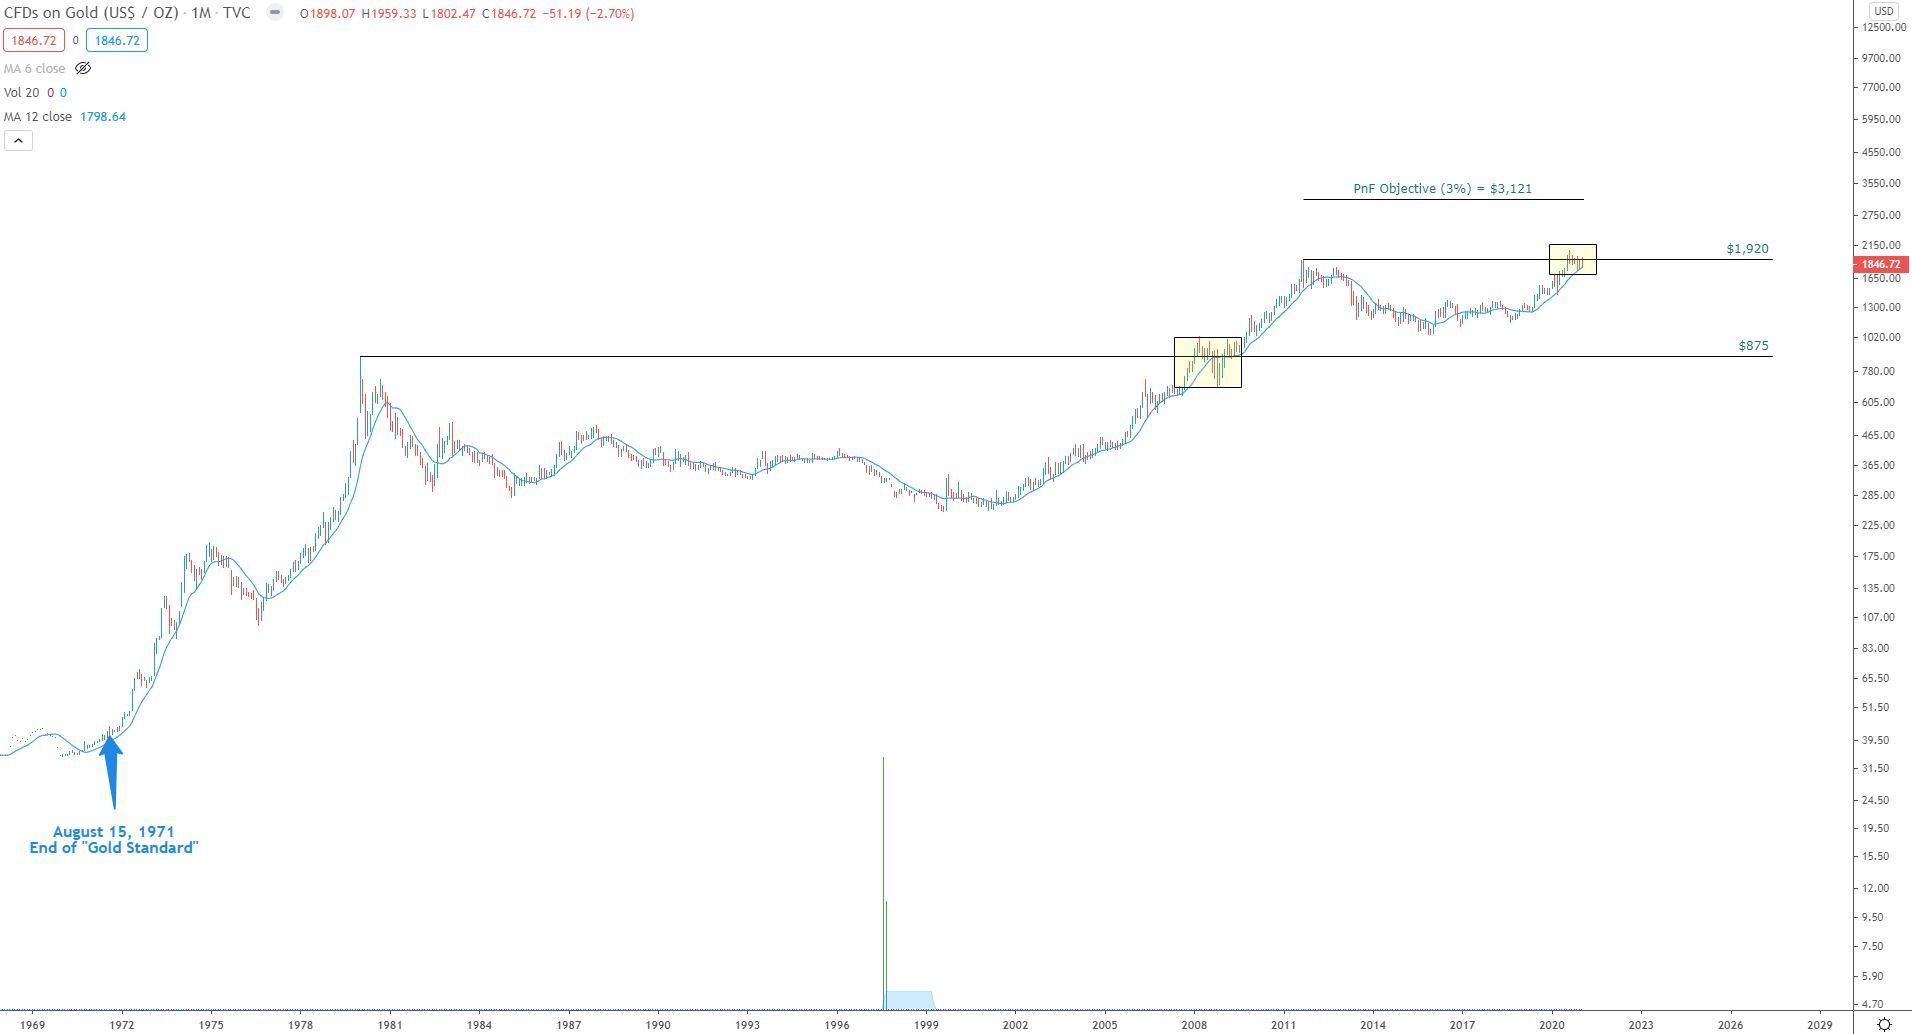
Gold
Very similar to the 2008-2009 period when gold prices were chopping around $875 level which was the buying climax from 1980, they are now once again chopping around the buying climax level from the last bull run that ended in 2011.
I’ve shown these areas in yellow boxes on the above chart
Should price be able to escape from this level ($1920), there is a decent upside count at $3121 that I’ve shown on the chart
Side note: I’ve shown at the bottom left when President Nixon ended the gold standard in 1971. You can see what happened afterwards. This led to a run up in scarce hard assets, as denominated in fiat currencies
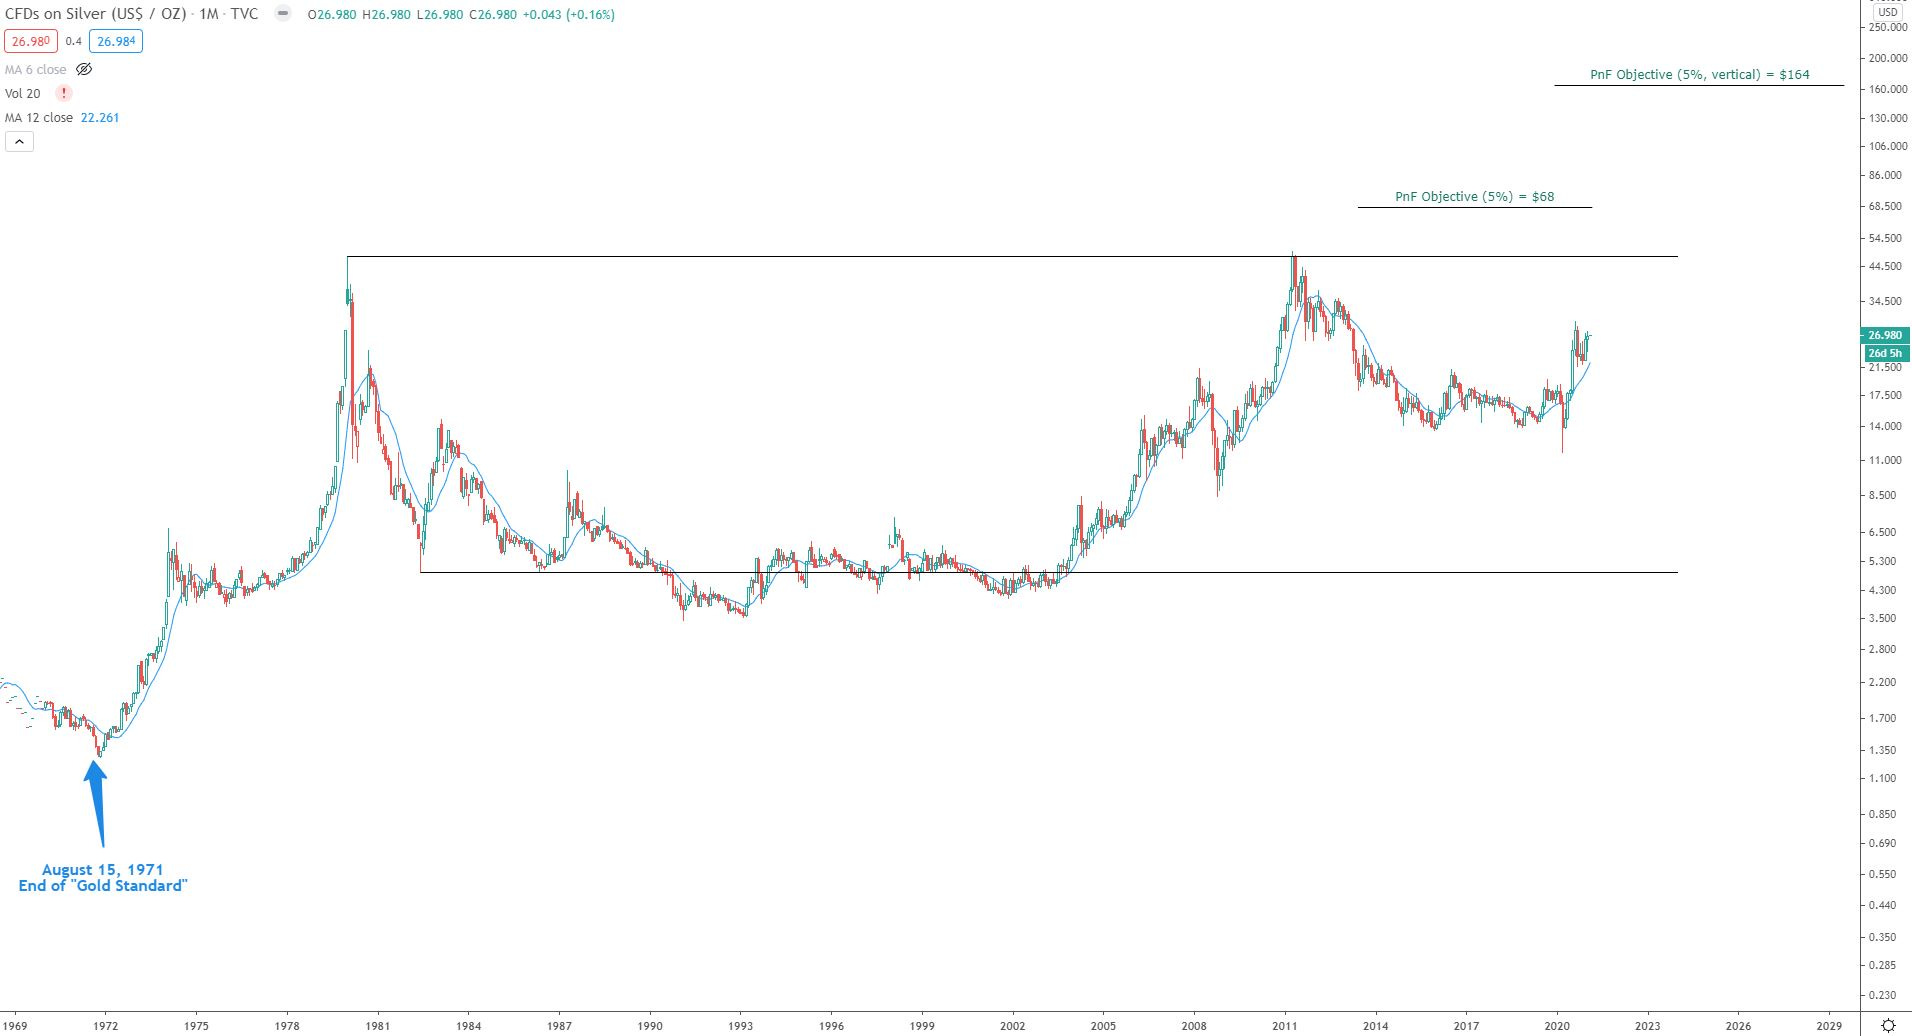
Silver
Silver looks like a massive cup & handle here, as it is working on the handle
There are some very high upside counts here at $68 and $164
I’ll be watching the futures and will send out any noteworthy updates for premium members, as I see them.