This week’s Market Outlook will be dedicated to Bitcoin, which I view as the fastest horse in the race, and some difficult lessons I’ve learned along the way that ultimately led me to TA over FA - which ultimately led me back to Bitcoin. A very virtuous cycle.
The fastest horse:
If my objective is to maximize returns, it makes sense to have exposure to the assets yielding the best returns. Much easier said than done. Nothing comes without risk. But as I hope I’ve communicated by now in my prior posts, I believe Bitcoin will outperform traditional equities - and by a large margin. A rising tide lifts all boats, and the “shitcoins” and bitcoin stocks (HUT, MARA, MSTR, etc.) should benefit from Bitcoin’s success.
It’s still a volatile environment, and risk management is still important, but I’m trying to set myself up for success via as much Bitcoin exposure as possible.
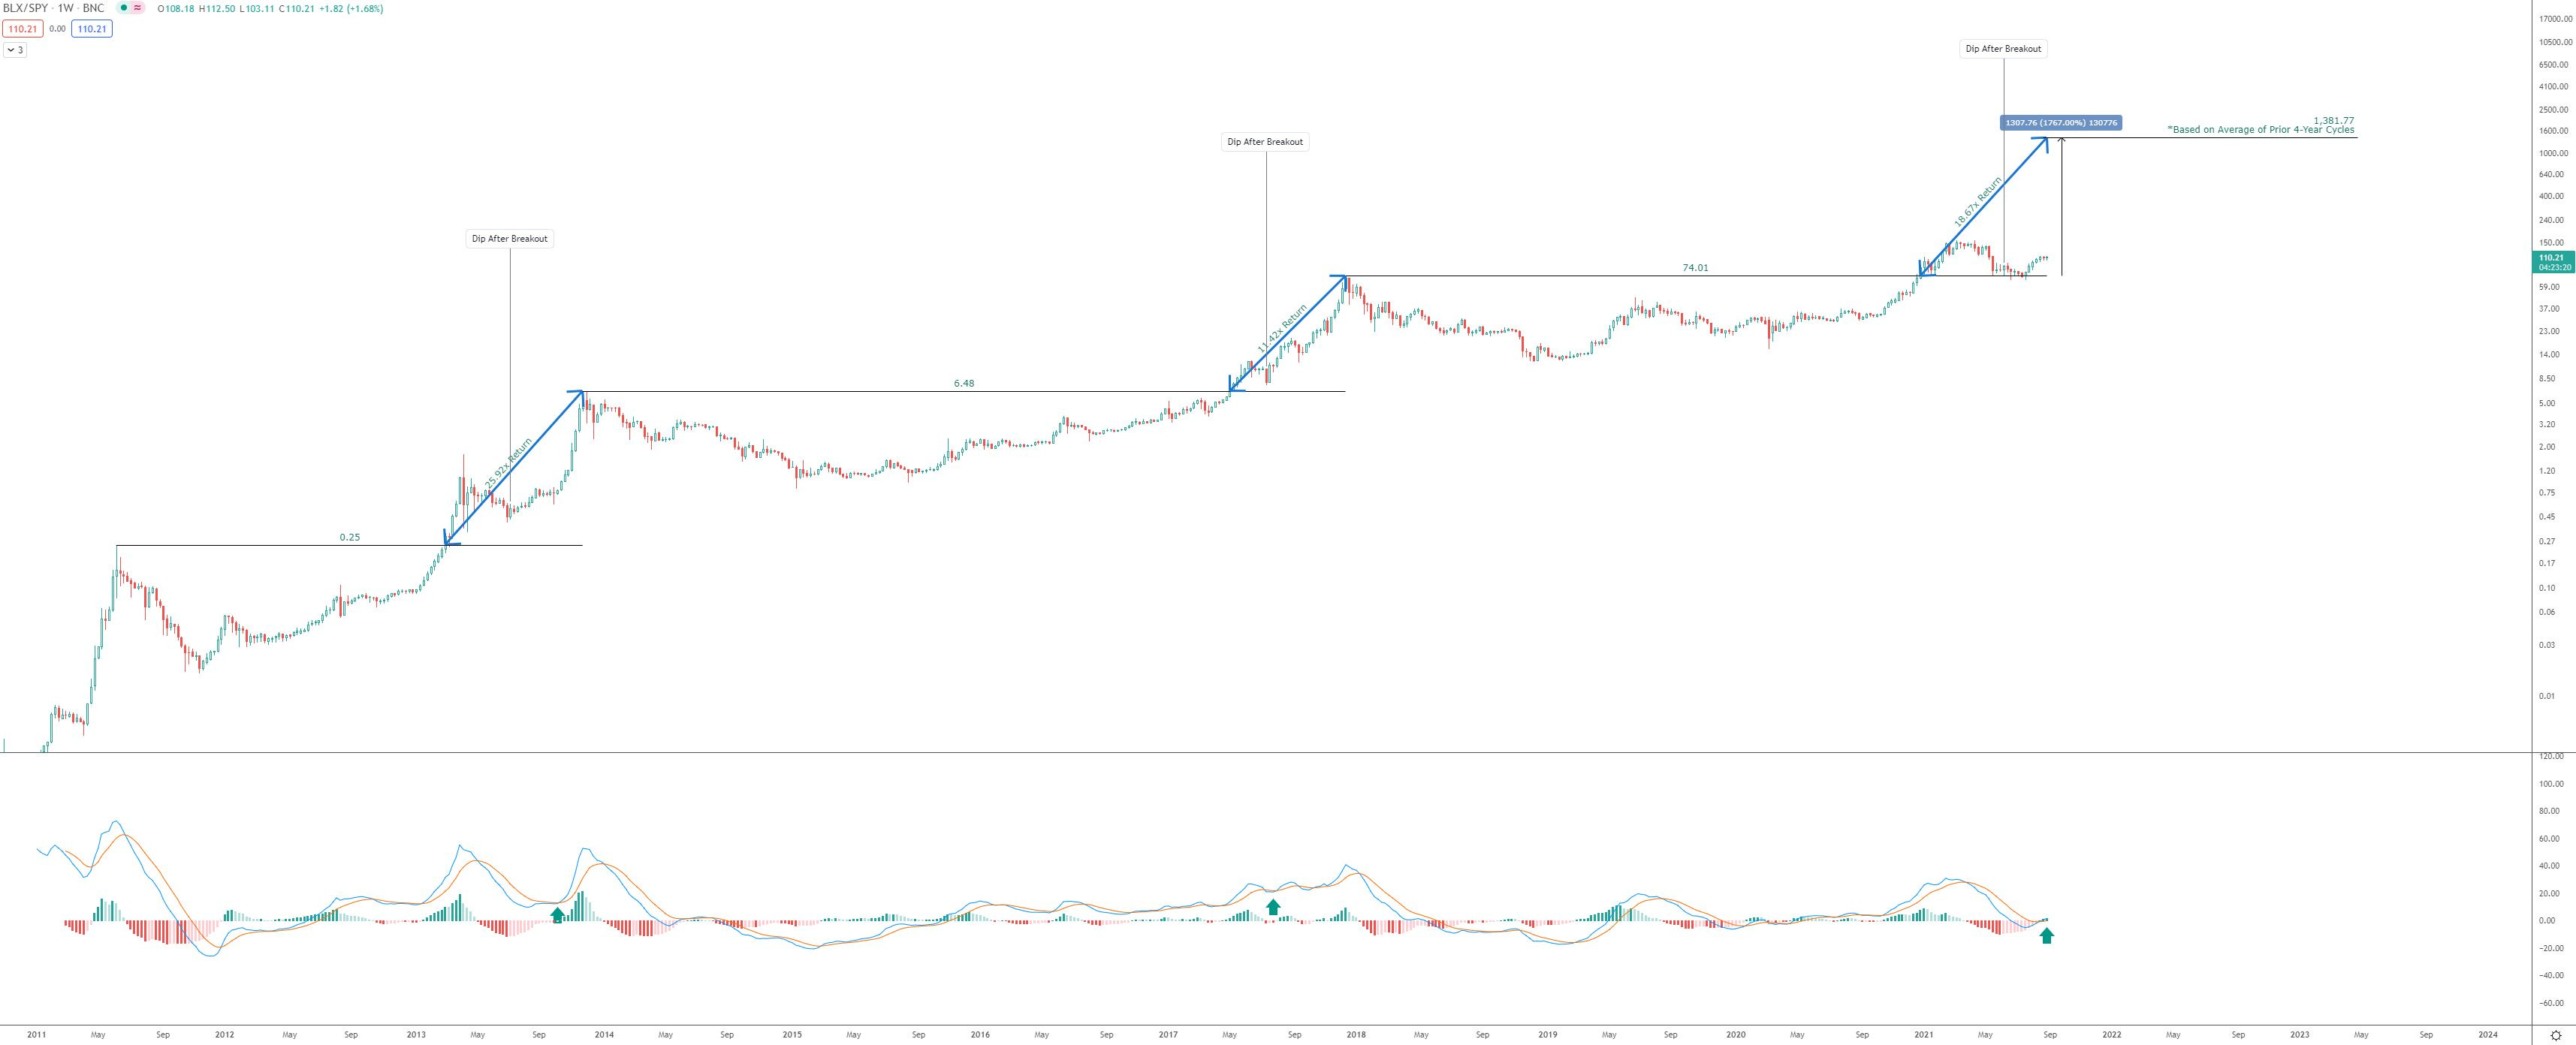
Bitcoin vs. SPY, weekly candles
Bitcoin has a history of drastically outperforming equities. In the above chart, I use SPY as a proxy for the general market. The outperformance has happened in boom/bust cycles, with each boom far outpacing SPY. And each time, there was a pullback after the initial breakout. Bitcoin recently experienced a breakout relative to SPY, and it also pulled back to test the breakout level.
Each time there has been a pullback, there has later been a momentum crossover (Shown via PPO indicator at the bottom of the chart). Every cycle is different, and sometimes this momentum crossover occurs at different levels. In this most recent crossover, it occurred after dipping below zero. As I look at the chart now, I believe this deep momentum crossover indicates there is A LOT of gas in the tank. This aligns with my Point and Figure targets at $300k, $400k, and $2 million.
Nothing is guaranteed, I can’t stress that enough, so risk management is imperative. But with the historical data suggesting a large markup (I know - sample size of 2), I want to position myself in Bitcoin heavily.
I know the saying “generational buying opportunity” gets used a lot. I see it on 10% dips. But zooming way out, I truly believe the opportunity of our lifetimes, and possibly generations to follow, is here. Right now.
As noted earlier, from my Point and Figure analysis, I can generate price targets in the $300k-$400k range, and another one above $2 million:
I know this seems crazy to some. The above chart is what an S-curve might look like. Maybe it happens in this cycle. Maybe not. But that doesn’t take away the legitimate point and figure counts.
Many people believe the current cycle started at the lows in Dec. ‘18. And we are already in the mature stages of the current cycle. I thought that, too, until the COVID selloff in March ‘20.
Simply put, I think we are still very early in Bitcoin.
As far as Bitcoin vs. the “Shitcoins”:
The “Bitcoin Dominance” chart shows an exciting support level coming into play right around the 39 level. Currently trading at 41, there is a potential double bottom forming. This may take a couple of months to play out, but ultimately I’ll be looking for two things:
BTC.D to cross up and through 50
BTC.D to cross up and through the 30-week SMA (shown in orange)
When either of those happens, that will signal to me that the altcoins are due for some painful times relative to the King.
Technical Analysis > Fundamental “Funnymentals” Analysis:
I like to think I’ve come a long way from my first trade placed ~15 years ago. I’ve learned a few things along the way, and today I’d like to share some of my painful lessons. I oftentimes see technical analysis get a bad rep by people who honestly haven’t put the time and effort into it to understand it fully. I see countless examples of bad charts with too much noise, so I am not surprised if people write it off without giving it a second thought. Technical analysis doesn’t guarantee an outcome, but it can help give signals, entries, and exits. It helps know when to hold ‘em and when to fold ‘em. Dismiss it at your own peril.
A great example of how funnymentals can lead one astray is in the Gold vs. Bitcoin debate. It is ok to be wrong. It is not okay to stubbornly stay wrong. I see gold bugs like Peter Schiff missing out on the most epic rally of our lifetimes, time and time again due to his fundamentals. But fortunately for his namesake, his son has seen the light and joined in on the bitcoin movement.
Hopefully, Peter someday realizes his mistake, swallows his pride, and accepts that Bitcoin is here to stay. But if he doesn’t, that’s fine with me too.
My journey to 100% technical analysis
Through NFLX, I first observed this phenomenon where someone could continuously be wrong and not accept their mistakes. In the early 2010s, there was a NFLX perma-bear Michael Pachter. All you have to do is google his name + NFLX, and you’ll see plenty of examples and articles of his constantly bearish calls that have turned out to be wrong. I have to credit Michael for helping me open my eyes to a better way to navigate markets: Technical Analysis.
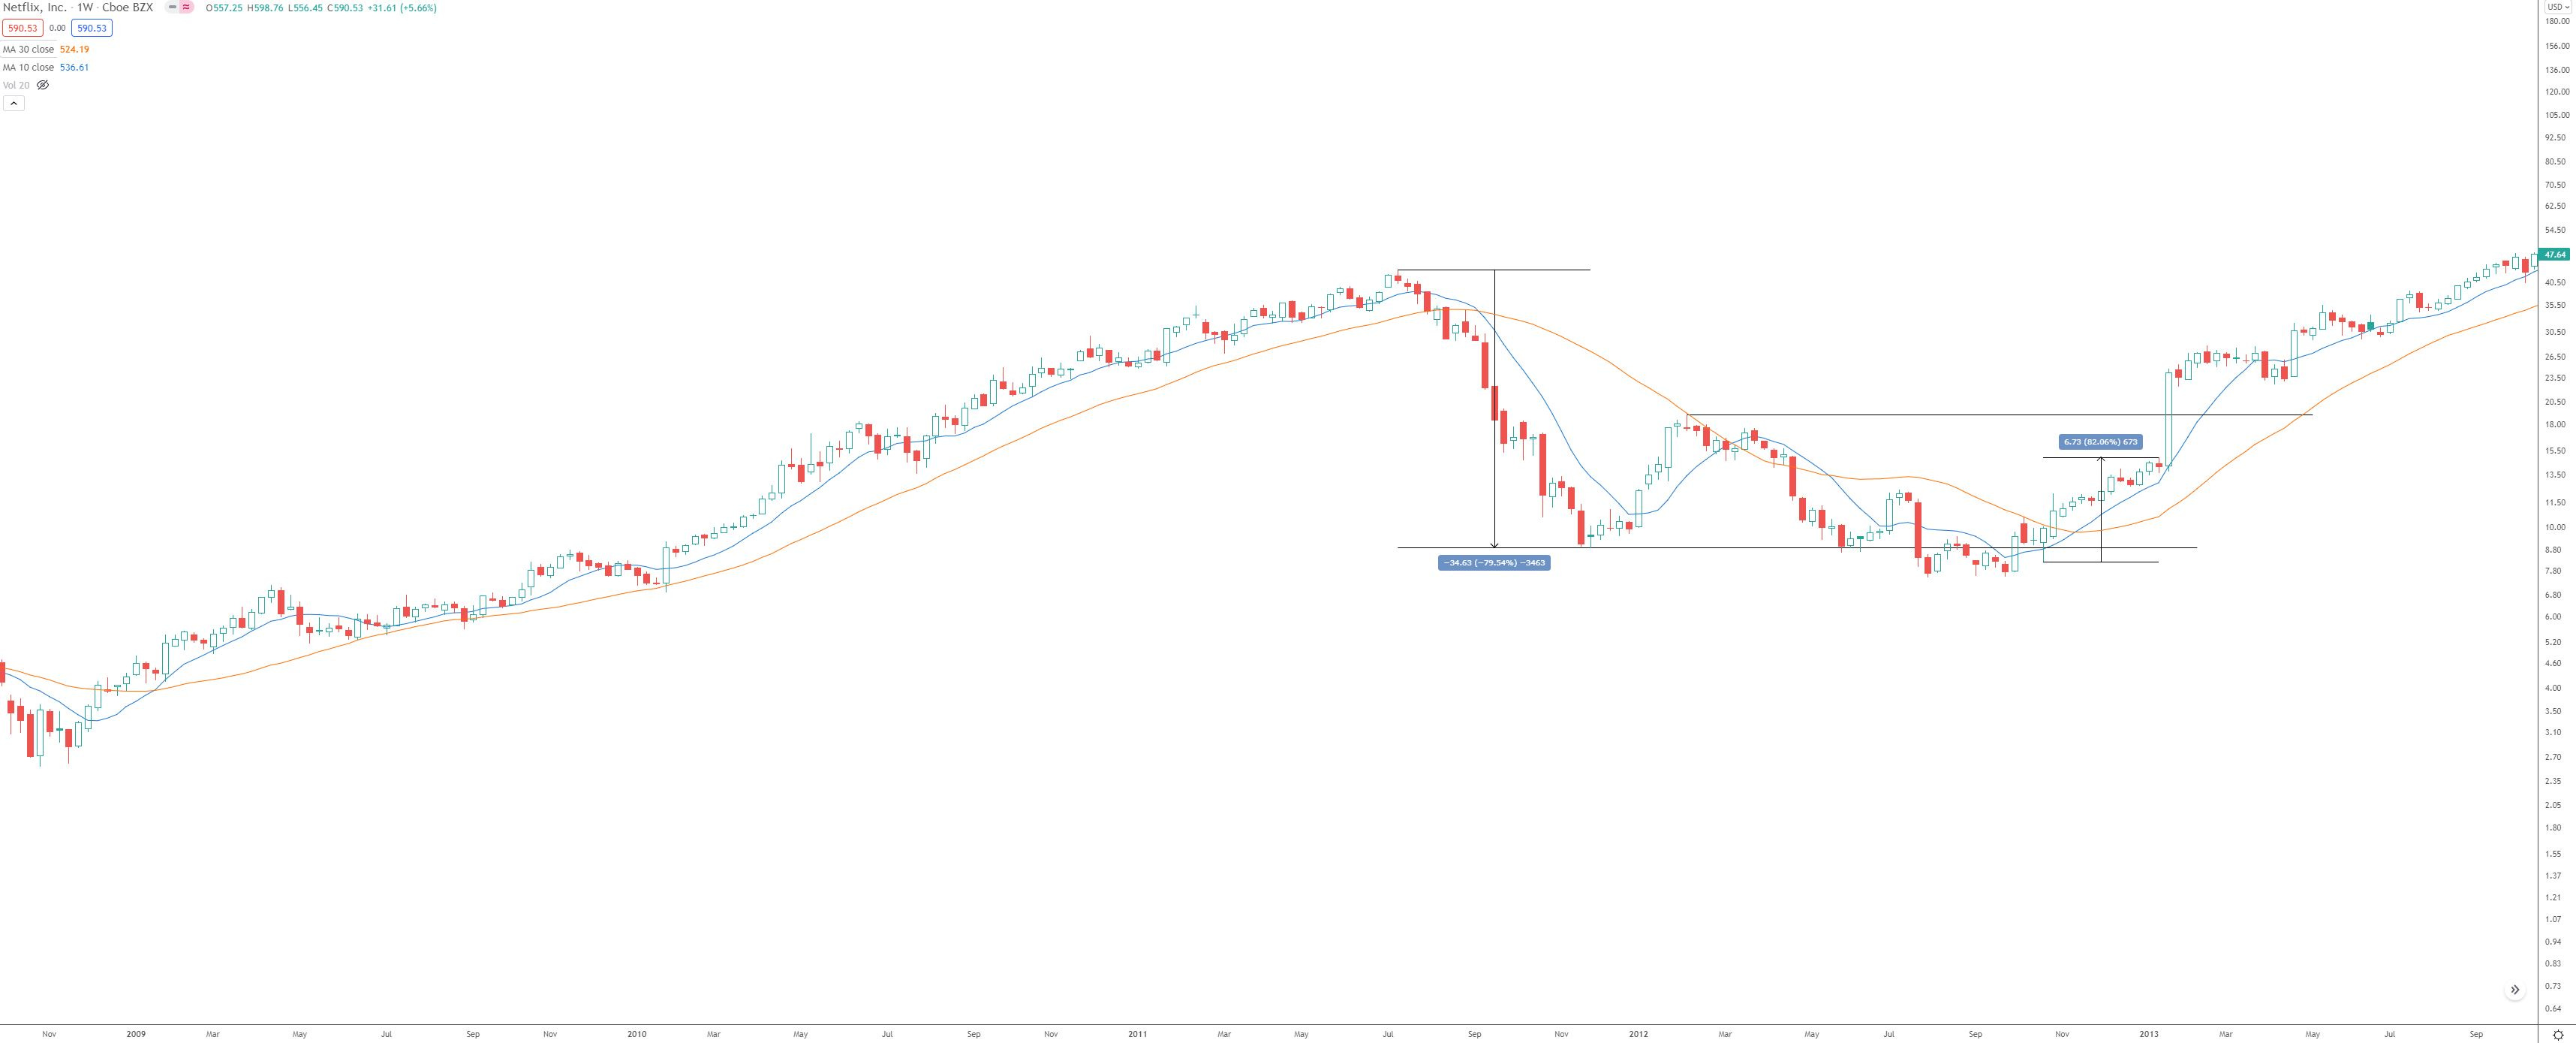
I still remember the NFLX earnings beat in Jan ‘13; I had just closed some calls before the earnings announcement. Fundamentally I believed in the Netflix story. I think I had a nice double or triple on the options as the stock had risen from ~$10 to $14 (split-adjusted it was at the time around $60-$90ish) heading into the earnings. But earlier that year, NFLX had recently gone through a massive dip (-80%), so I still had some fears and let the bearish fundamental analysis skew my thoughts.
The company was losing money as it was beginning to make original content. It all started with Lilyhammer in early 2012, followed by Orange Is the New Black, and then House of Cards slated later in 2013. Netflix was also planning to expand internationally, which some analysts such as Pachter believed would fail and bankrupt the company and the original content strategy. These all turned out to be massive successes.
My “Step 1” Lesson
And then NFLX released a blowout earnings report in January ‘13. The weekly candle ended up over 70%.
On the afternoon of the earnings release, I sat there and watched the after-hours ticks—every minute of it until I couldn’t take it anymore. I’ll never forget it, like 9/11. I felt crushed inside; even though I had just made some decent money on my options the week before, I sat there in my cubicle and calculated the potential gains I was missing out on. I couldn’t stomach it, and I had to leave the office early that day.
NFLX Weekly Candles, Jan ‘12 Earnings +70% candle.
My wife and I used to carpool back then, and I went to her office to pick her up thinking, “I could be telling her we made > $200k today,” but instead, I picked her up, drove home silent and depressed, hating myself for listening to a bearish analyst.
That was a critical inflection point in my trading/investing journey. It was a crucial “Step 1” to moving 100% towards technical analysis. I had already used technical analysis at the time, but I mixed in lots of fundamentals - which oftentimes gave me mixed signals and hesitation.
My “Step 2” Lesson: AAPL and P/E Ratio (A funnymental indicator)
The “Step 2” moment came around the same time, as I was very bullish on AAPL in 2012-13.
I kept “buying the dip” (yes, before it was a meme) because the fundamentals were amazing. It dropped 10%, and I bought the dip. It dropped another 10%, and I bought the dip (again).
The P/E ratio was 13; there was no way it could keep dropping. “AMZN has an astronomical P/E, and they don’t have the cash AAPL does. There’s no way AAPL deserves a P/E this low,” I remember telling myself and reading very similar headlines from bullish analysts I agreed with. I bought the dip. Then the P/E went to 12. Then 11. Then 10, 9, etc., as I continued to buy the dip. It continued all the way until I couldn’t get any more margin.
It was a very horrible, gut-wrenching time for me, which I’ll never forget. It hurt even more than missing out on the NFLX earnings that same year because I was actually losing money this time. To add insult to injury, I rotated all of the NFLX gains mentioned earlier into AAPL calls.
Three essential lessons I learned (the hard way):
Never go all-in, and never use margin for options!
Fundamental analysis might eventually be right, but it isn't good for market timing.
Technical analysis takes much less time, and a strict system with rules is a much less stressful way to navigate the markets, from my experience. “This is the way.”
The NFLX and AAPL experiences opened my eyes to technical analysis and market psychology. Yes, the fundamentals may eventually be proven right, but the market doesn’t always agree right away. I’m not upset at the fundamental analysts that cost me money; I don’t blame them. I can’t. I made the decisions, and I was responsible for the outcomes. But what I can do is thank them for helping me see the light sooner rather than later.
In the end, I was able to dig myself out of the massive hole I had dug in AAPL. Fortunately, I studied options for several years before 2013, and I kept rolling what little value I had left into further dated, higher strike options. Each time was a hard pill to swallow. On the last roll-up & out, I was down to less than 10% of the original amount I had put into the calls. But that also coincided with the bottom in June 2013. I had lost time value. I had lost intrinsic value. Rolling out to January 2015 was a Hail Mary play. Thankfully, it ended up working out (somewhat) as I was able to get back most of the money lost.
I spent the next few years discovering Wyckoff, point, and figure, reading countless books of market legends, understanding market psychology, joining chat rooms, all to understand why TA has advantages over FA. I spent countless nights and weekends looking at charts, searching for the best indicators and setups. It gave me a fresh perspective and helped me realize that I needed to develop a 100% technical system with rules.
Ultimately I found that less is more. Fewer lines, fewer indicators - but that is what works for me. Lots of lines and indicators might work for others; I just couldn’t figure how or why. But it didn’t matter; I learned what I needed.
So if you’re still struggling, don’t give up until you find your way. It will happen. You just have to stick with it. There are going to be ups and downs. There’s no magic indicator. Experience gives lessons that no book can. But still, make every effort to learn from the best. Find what works for you & your timeline. If you have a 9 to 5 job, you will likely need to make different investments/trades than a person who is a day trader.
Step 3: Bitcoin and my “aha” moment
The “Step 3” for me was ironically in Bitcoin. Back in 2015, off the advice a well-respected trader in a chat had given, I bought my first coins at an average price of $250. Before the purchase, I looked at the chart and saw the potential Wyckoff accumulation developing. (Yes, that’s right, those Wyckoff charts that people loved to share this April-May ‘21 were even around back then, six years ago - LOL). I decided the advice was good, so I went ahead and pulled the trigger to enter the trade.
About a year later, in 2016, as BTC was coming into some resistance, I decided to take my gains and sell for a double around $500. I figured it had gone up 100% in such a short time, and I would take the profits at an anticipated supply level, where the price was surely due to retrace from. I planned to buy back on the next dip. Boy, was I in for a rude awakening. That dip never came.
I experience what many people have: I was trapped on the sidelines, waiting for that dip, watching as the ensuing bull market rallied up to the infamous $20k top in 2017. To put it into perspective: Price had rallied 40x from my selling point just a year prior.
That reinforced two things for me:
Zoom out. Way out.
I must develop some way to gauge potential upside moves - which happens to be Point and Figure counting!
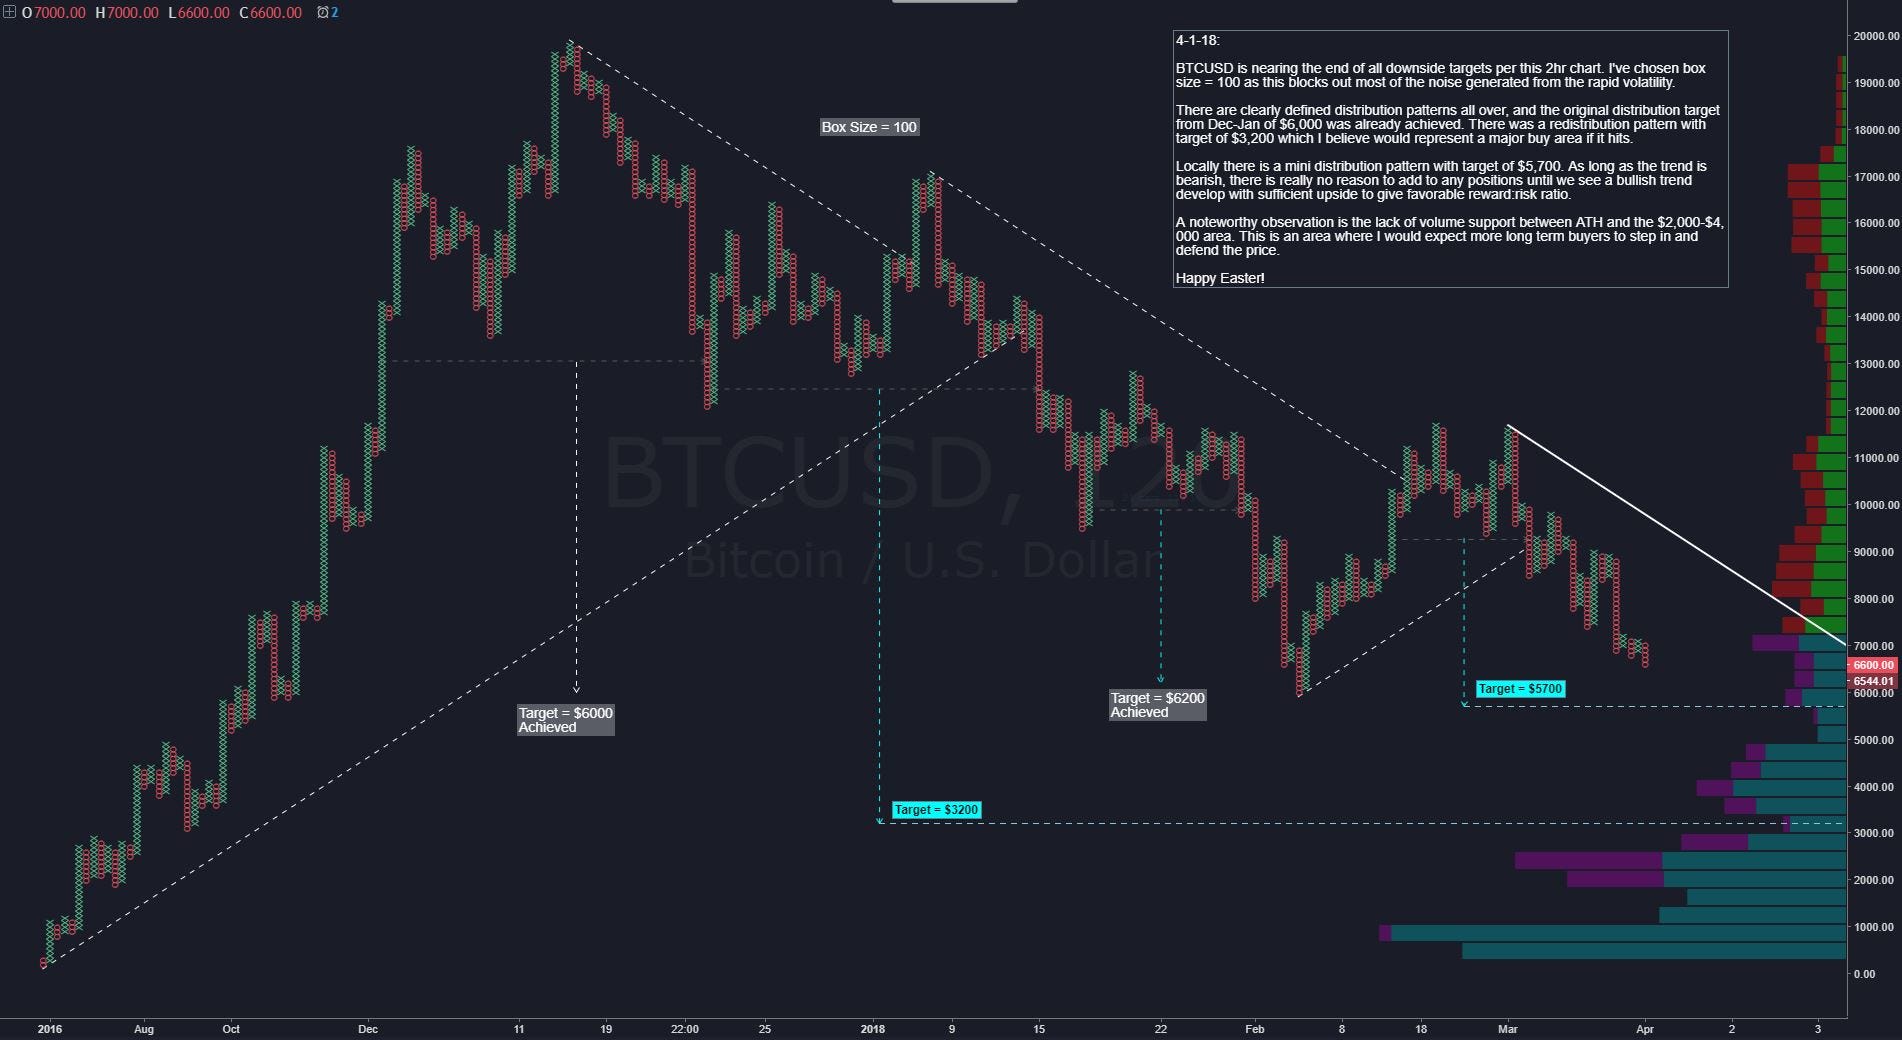
Bitcoin distribution chart shared to Stocktwits, April 2018
“There are clearly defined distribution patterns all over, and the original distribution target from Dec-Jan of $6,000 was already achieved. There was a redistribution pattern with a target of $3,200, which I believe would represent a major buy area if it hits.
Locally there is a mini distribution pattern with target of $5,700. As long as the trend is bearish, there is really no reason to add any positions until we see a bullish trend develop with sufficient upside to give a favorable reward:risk ratio.
A noteworthy observation is the lack of volume support between ATH and the $2,000-$4,000 area. This is an area where I would expect more long-term buyers to step in and defend the price.
Happy Easter!”
And then, BTC achieved that distribution target. After some sideways consolidation, which lasted about 5 months, I used that dip to load up in the $3k range once I was convinced Bitcoin was ready. And I wouldn’t have if it weren’t for my journey of many painful losses and missed opportunities. I wouldn’t have done it without technical analysis.
Technical analysis isn’t for everyone. Bitcoin might not be for everyone. But staying stubbornly wrong is not ok. I’ll never let anyone tell me technical analysis doesn’t work. It might not work for you, but that doesn’t mean it doesn’t work. I can’t accept that, and I have no time for people that refuse to learn it.
Bitcoin - Just like falling in love, or falling asleep - it’s going to happen “slowly then suddenly”. Right now this has an approximate $290 billion market cap. I don’t see how this doesn’t become a trillion+ dollar market cap in the next two years. The charts are certainly suggesting it. The brightest minds in the world are working on this network and constantly surprising me with new ways to serve people all over the world.
Just as a frog in warm water comes to a boil “slowly then suddenly”, I sometimes wonder if the frog from this will be the banks and other financial institutions choosing not to implement or embrace Bitcoin. It is inevitable - just like Thanos, but with a better ending.
If I had to choose one trade for the next 15 months, it would be…Bitcoin (even with that potential 30% pullback). I think of it as the Dr. Strange “one scenario” from Infinity Wars:
Thank you for reading. Have a great week, and best of luck finding your fastest horse!
Trace, thank you very much for sharing your story. It's very insightful, and I can relate in so many ways. Cheers to more gains to come! Enjoy the long weekend!


Trace, thank you very much for sharing your story. It's very insightful, and I can relate in so many ways. Cheers to more gains to come! Enjoy the long weekend!