

Final Market Outlook: A Reflective Farewell (For Now)
Final Market Outlook: A Reflective Farewell (For Now)
End of a Chapter: Celebrating the Triumphs and Embracing the Future

Dear Subscribers,
I'm writing to share that this will be my concluding market outlook in the current paid subscription format. It's been a remarkable journey, and I'm deeply thankful for your engagement and support throughout this venture. As we part ways in this format, I extend my heartfelt wishes for your prosperity and success in the financial markets.
Looking ahead, I am stepping back to cherish and dedicate time to my family during these precious growing years. The decision to step back is not made lightly, but with a deep sense of fulfillment for what we've accomplished here.
May you and your loved ones find continued success and fulfillment.
Today marks the end of the paid service on Substack. Pro-rated refunds are being processed through Stripe and should be completed within about 10 business days. For any concerns regarding refunds, please contact me at (chartsforfreedom@gmail.com).
While I will be pausing these regular updates for the foreseeable future, I invite you to continue following my journey and insights on social media. You can find me on X (@TraceBustaChart) and on StockTwits (@TraceBusta). Although my time may be limited, I plan to stay as active as possible on these platforms, sharing thoughts and observations when feasible.
Warm regards,
Trace
It's hard to believe, but the time has come to pen my final Market Outlook post. When I first announced this a few months ago, the finality seemed distant, yet here we are.
In this last edition, there's a lot I want to cover. We're going to dive deep and explore various facets of the market. Here's what's on the docket:
Studies & Thrusts: We'll revisit previous studies and delve into some intriguing quantitative statistics I've recently encountered.
Yearly SPX & Quarterly DJI Charts: A look at these key indices to gauge broader market trends.
Seasonality: Understanding how seasonal factors have been influencing the markets.
Sectors - 2023 Performance: Breaking down sectorial performance throughout the year.
Put Call Ratio: Analyzing this metric to decipher market sentiment.
Oil Pitchfork Chart: Examining the oil market's trajectory.
30-Year Mortgage Rates: Discussing the impact of mortgage rates on the broader economic landscape.
Inflation (Year-over-Year): A critical look at inflationary trends and their market implications.
Point and Figure Chart: My take on what these charts are signaling for the future.
And finally, some closing thoughts, where I'll share a comprehensive reflection on our journey and the road ahead.
Studies & Thrusts: A Review
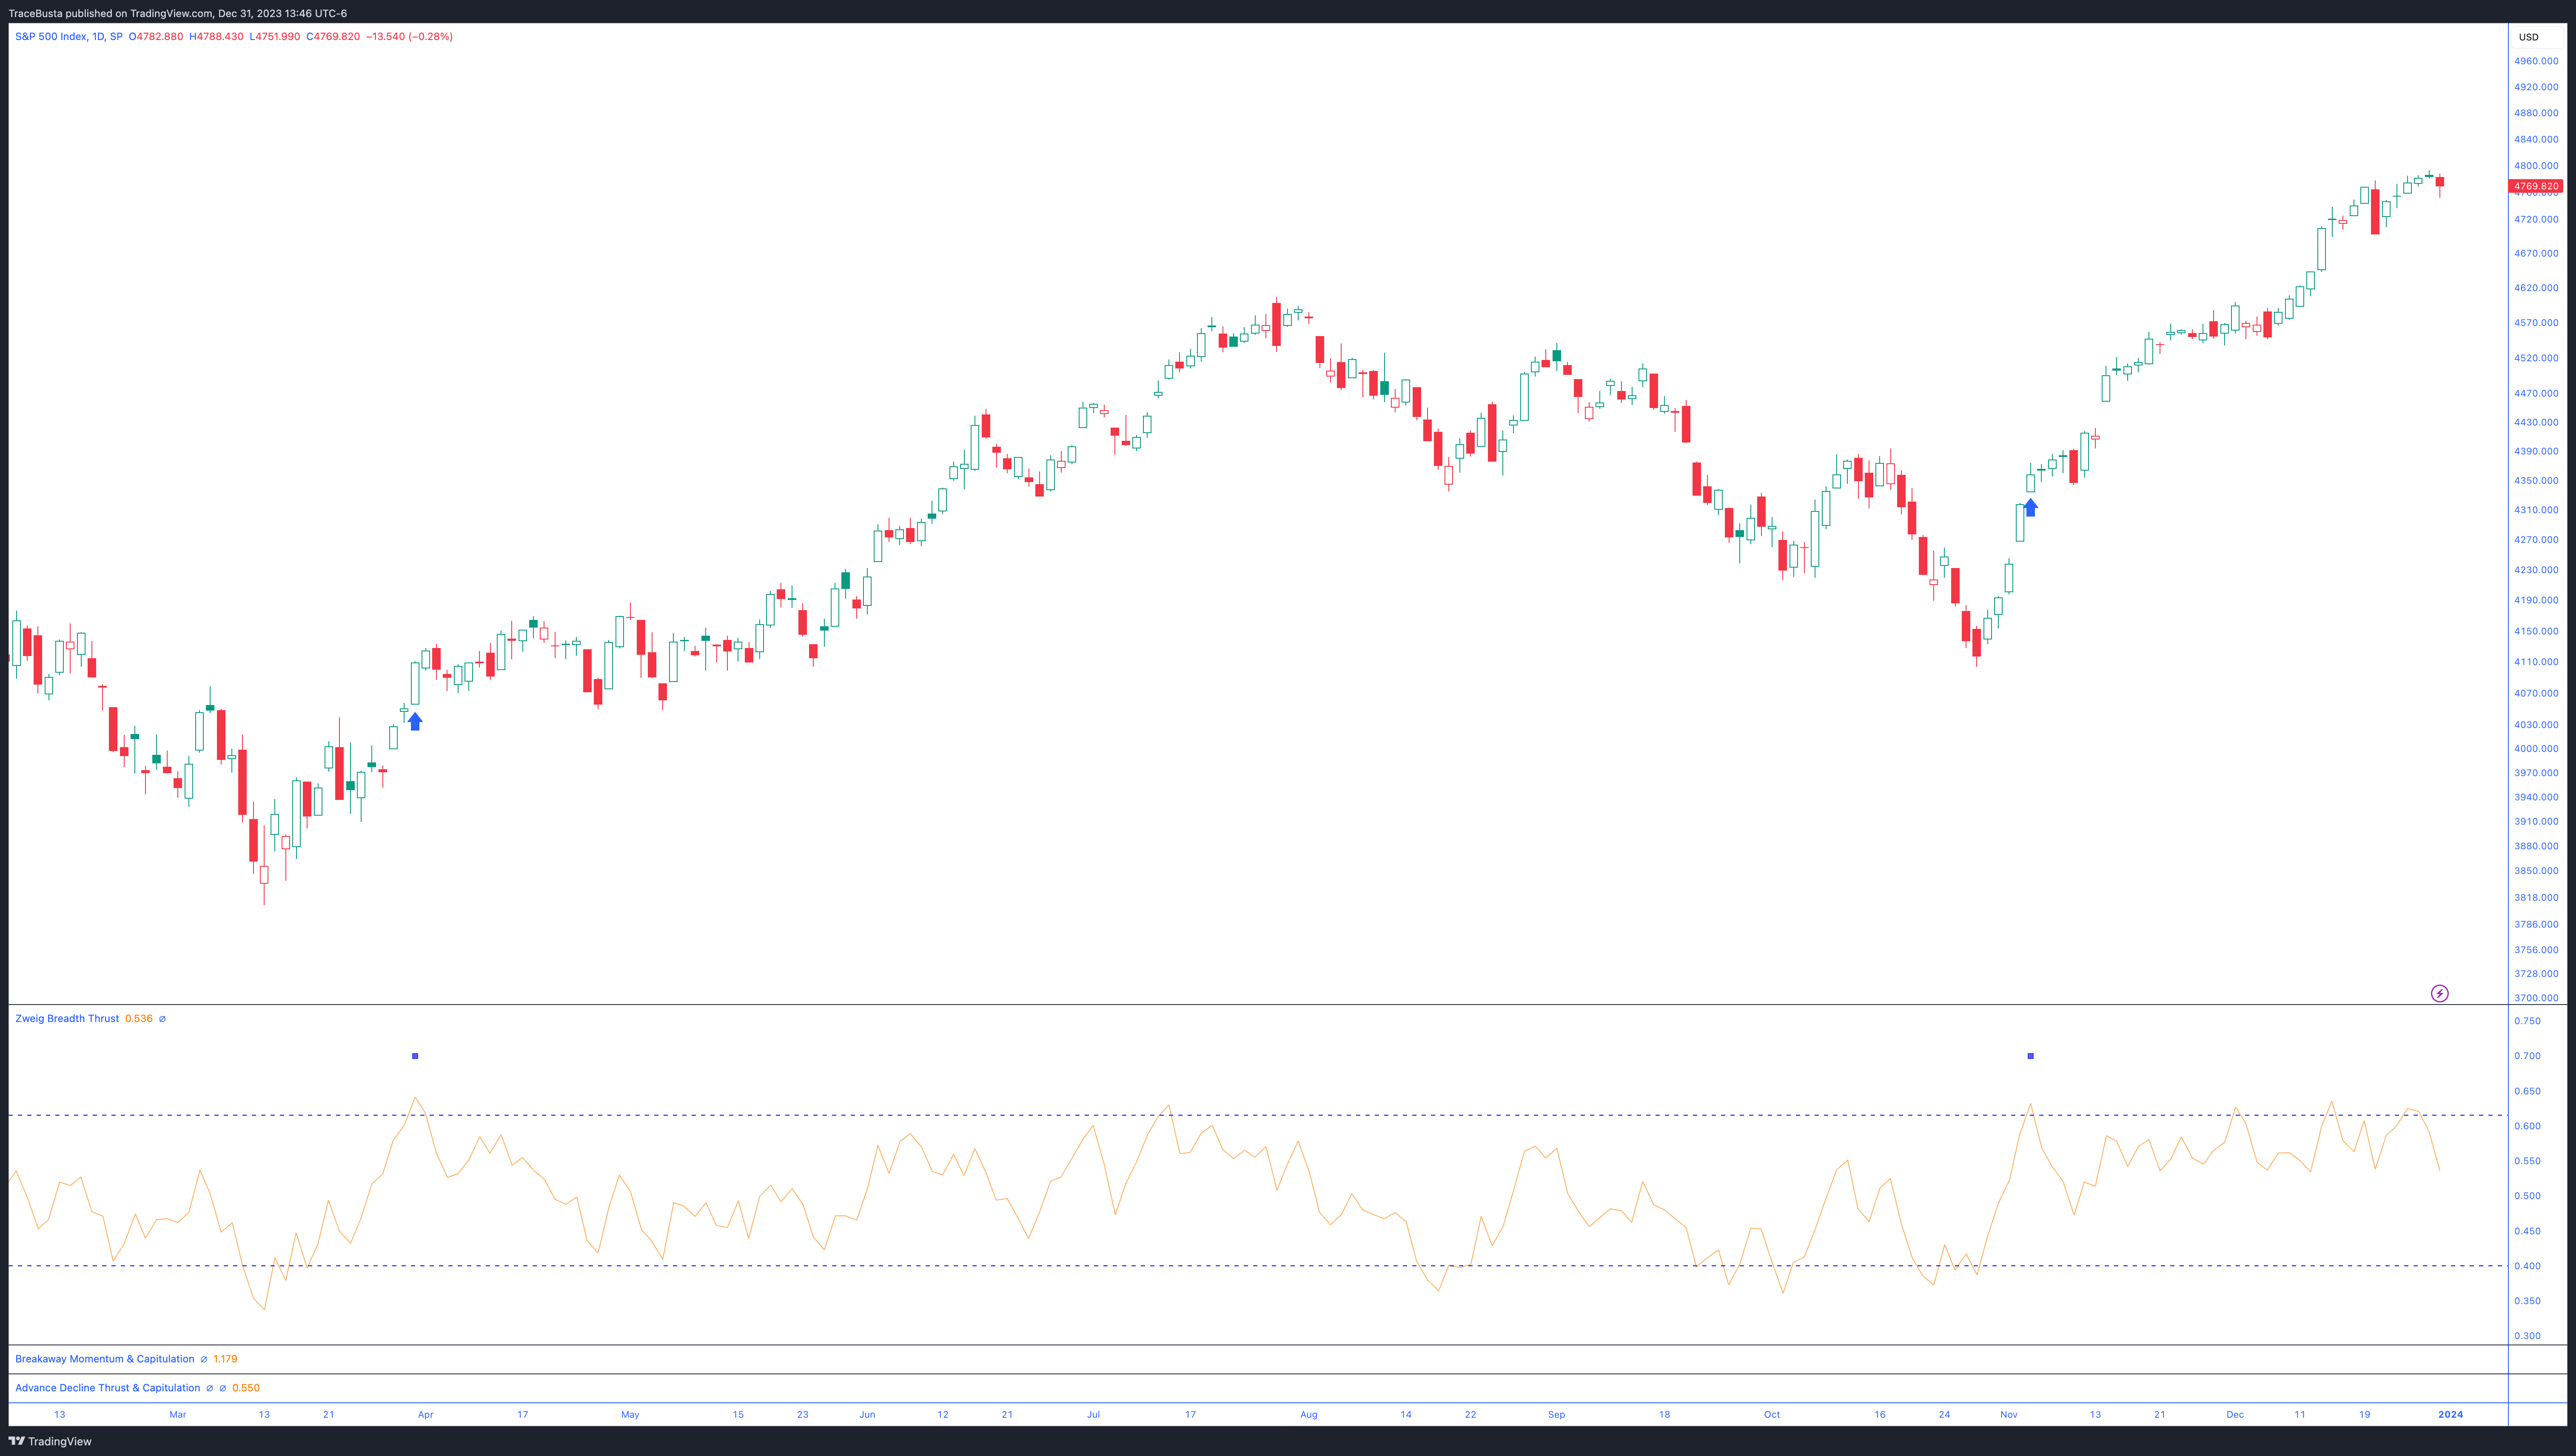
Zweig Breadth Thrusts
There were two of these very rare signals this year!
The first I highlighted after it was triggered at the March 31 close

And here was a Twitter thread that summarizes the rare event.
And now there is a second one, more recently triggered on the November 3rd close.
These are both shown in the chart below:
Breakaway Momentum & Capitulation (BAMC)
This indicator analyzes the NYSE advances and declines over a 10-day period. It identifies areas of “Breakaway Momentum” & “Capitulation” by taking ratios of the advances to declines and plotting key levels.
The ratio generates a Breakaway Momentum (BAM) signal when it rises above 1.97.
A Capitulation signal is generated when the ratio drops below 0.40.
Breakaway Momentum is a powerful signal in the stock market, much like how escape velocity is a crucial point in space travel. This indicator is designed to detect instances when the market shows tremendous breadth and strength, as indicated by a ratio of advances to declines greater than 1.97. These signals are rare, but when they do occur, they can suggest that a significant shift is taking place in the market and can be used as a buy or sell signal.
Note: The ratio of 1.97 is not arbitrary. It is approximately a 2:1 ratio, and when used, it signals a buy in 2014 that would not be present with a ratio of 2.0. Lowering to 1.97 also does not add any other signals. For this reason, I kept it.
There were two signals of this variety triggered in January:
Jan 12
Jan 17
Here is an updated chart from the time the two signals were triggered in January:
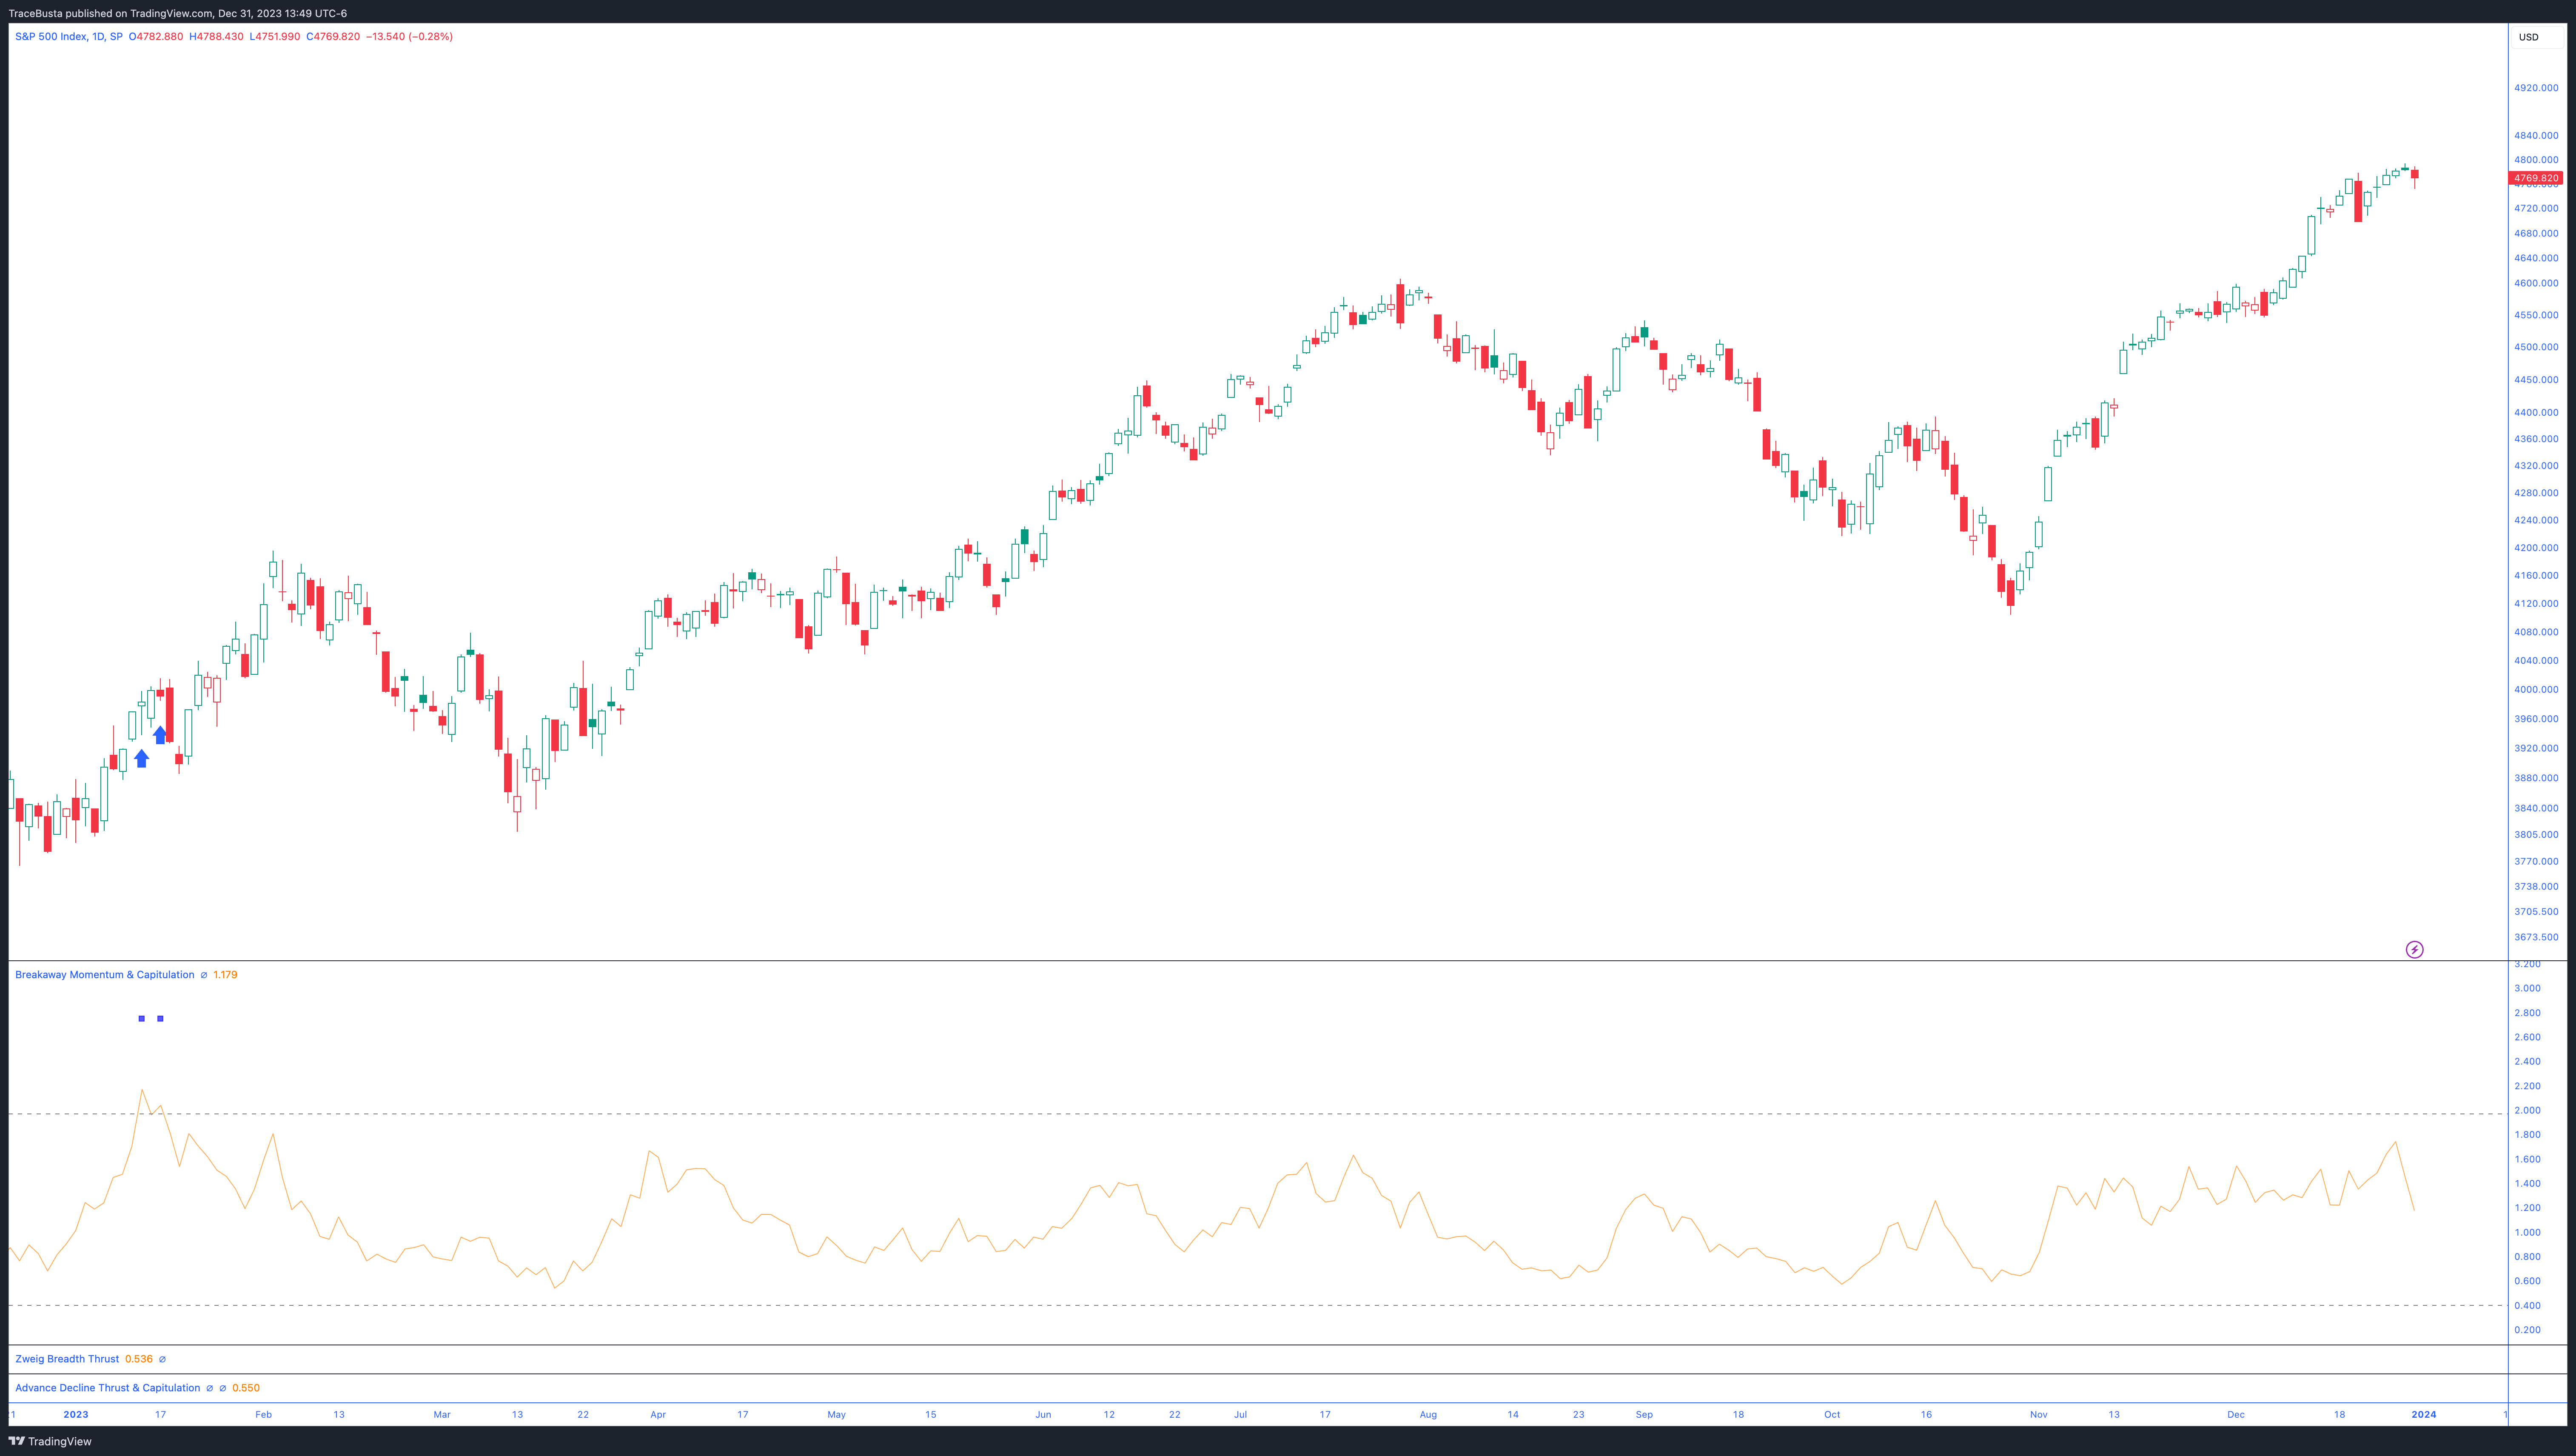
This duo of signals in January has resulted in 19.7% and 19.5% gains, respectively.
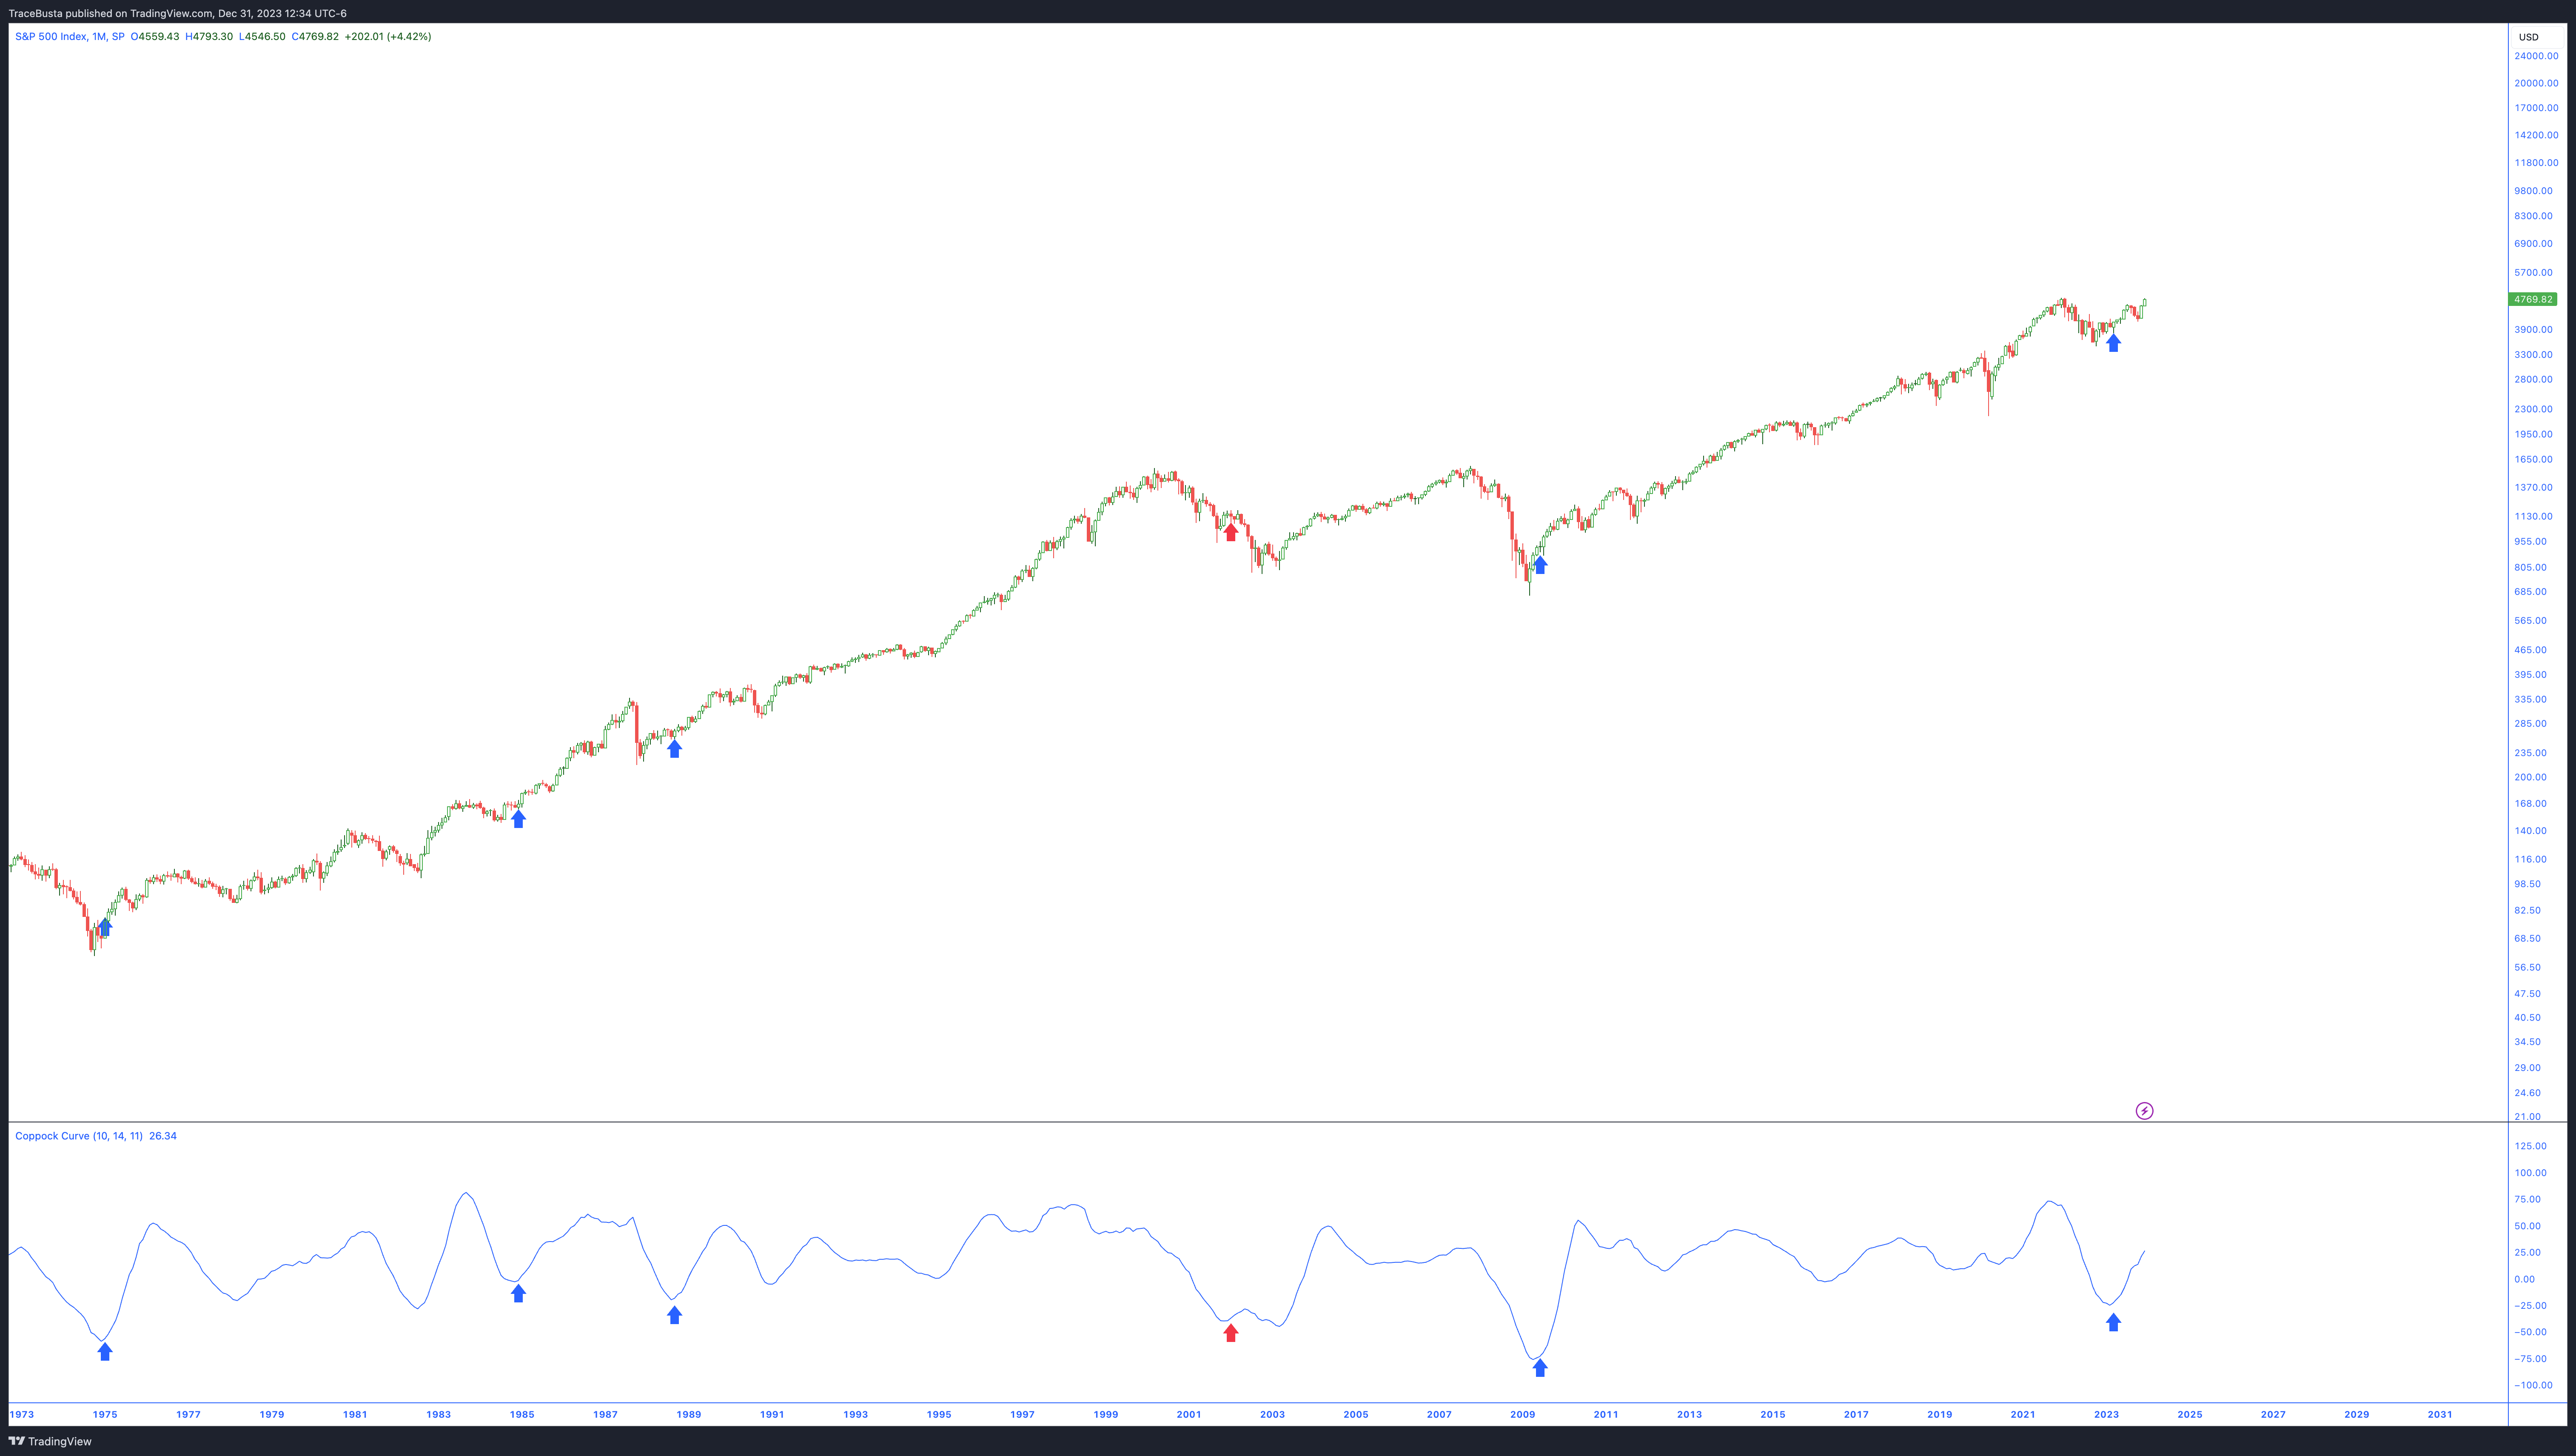
Coppock Curve
This indicator was discussed in the April 17th post in detail, linked below for reference:

I considered two criteria for buy signals, one for SPX and one for NDX:
S&P 500: A buy signal occurs when there's a 1-point uptick after a decline of 75 points or more. Positive territory crossing isn't required.
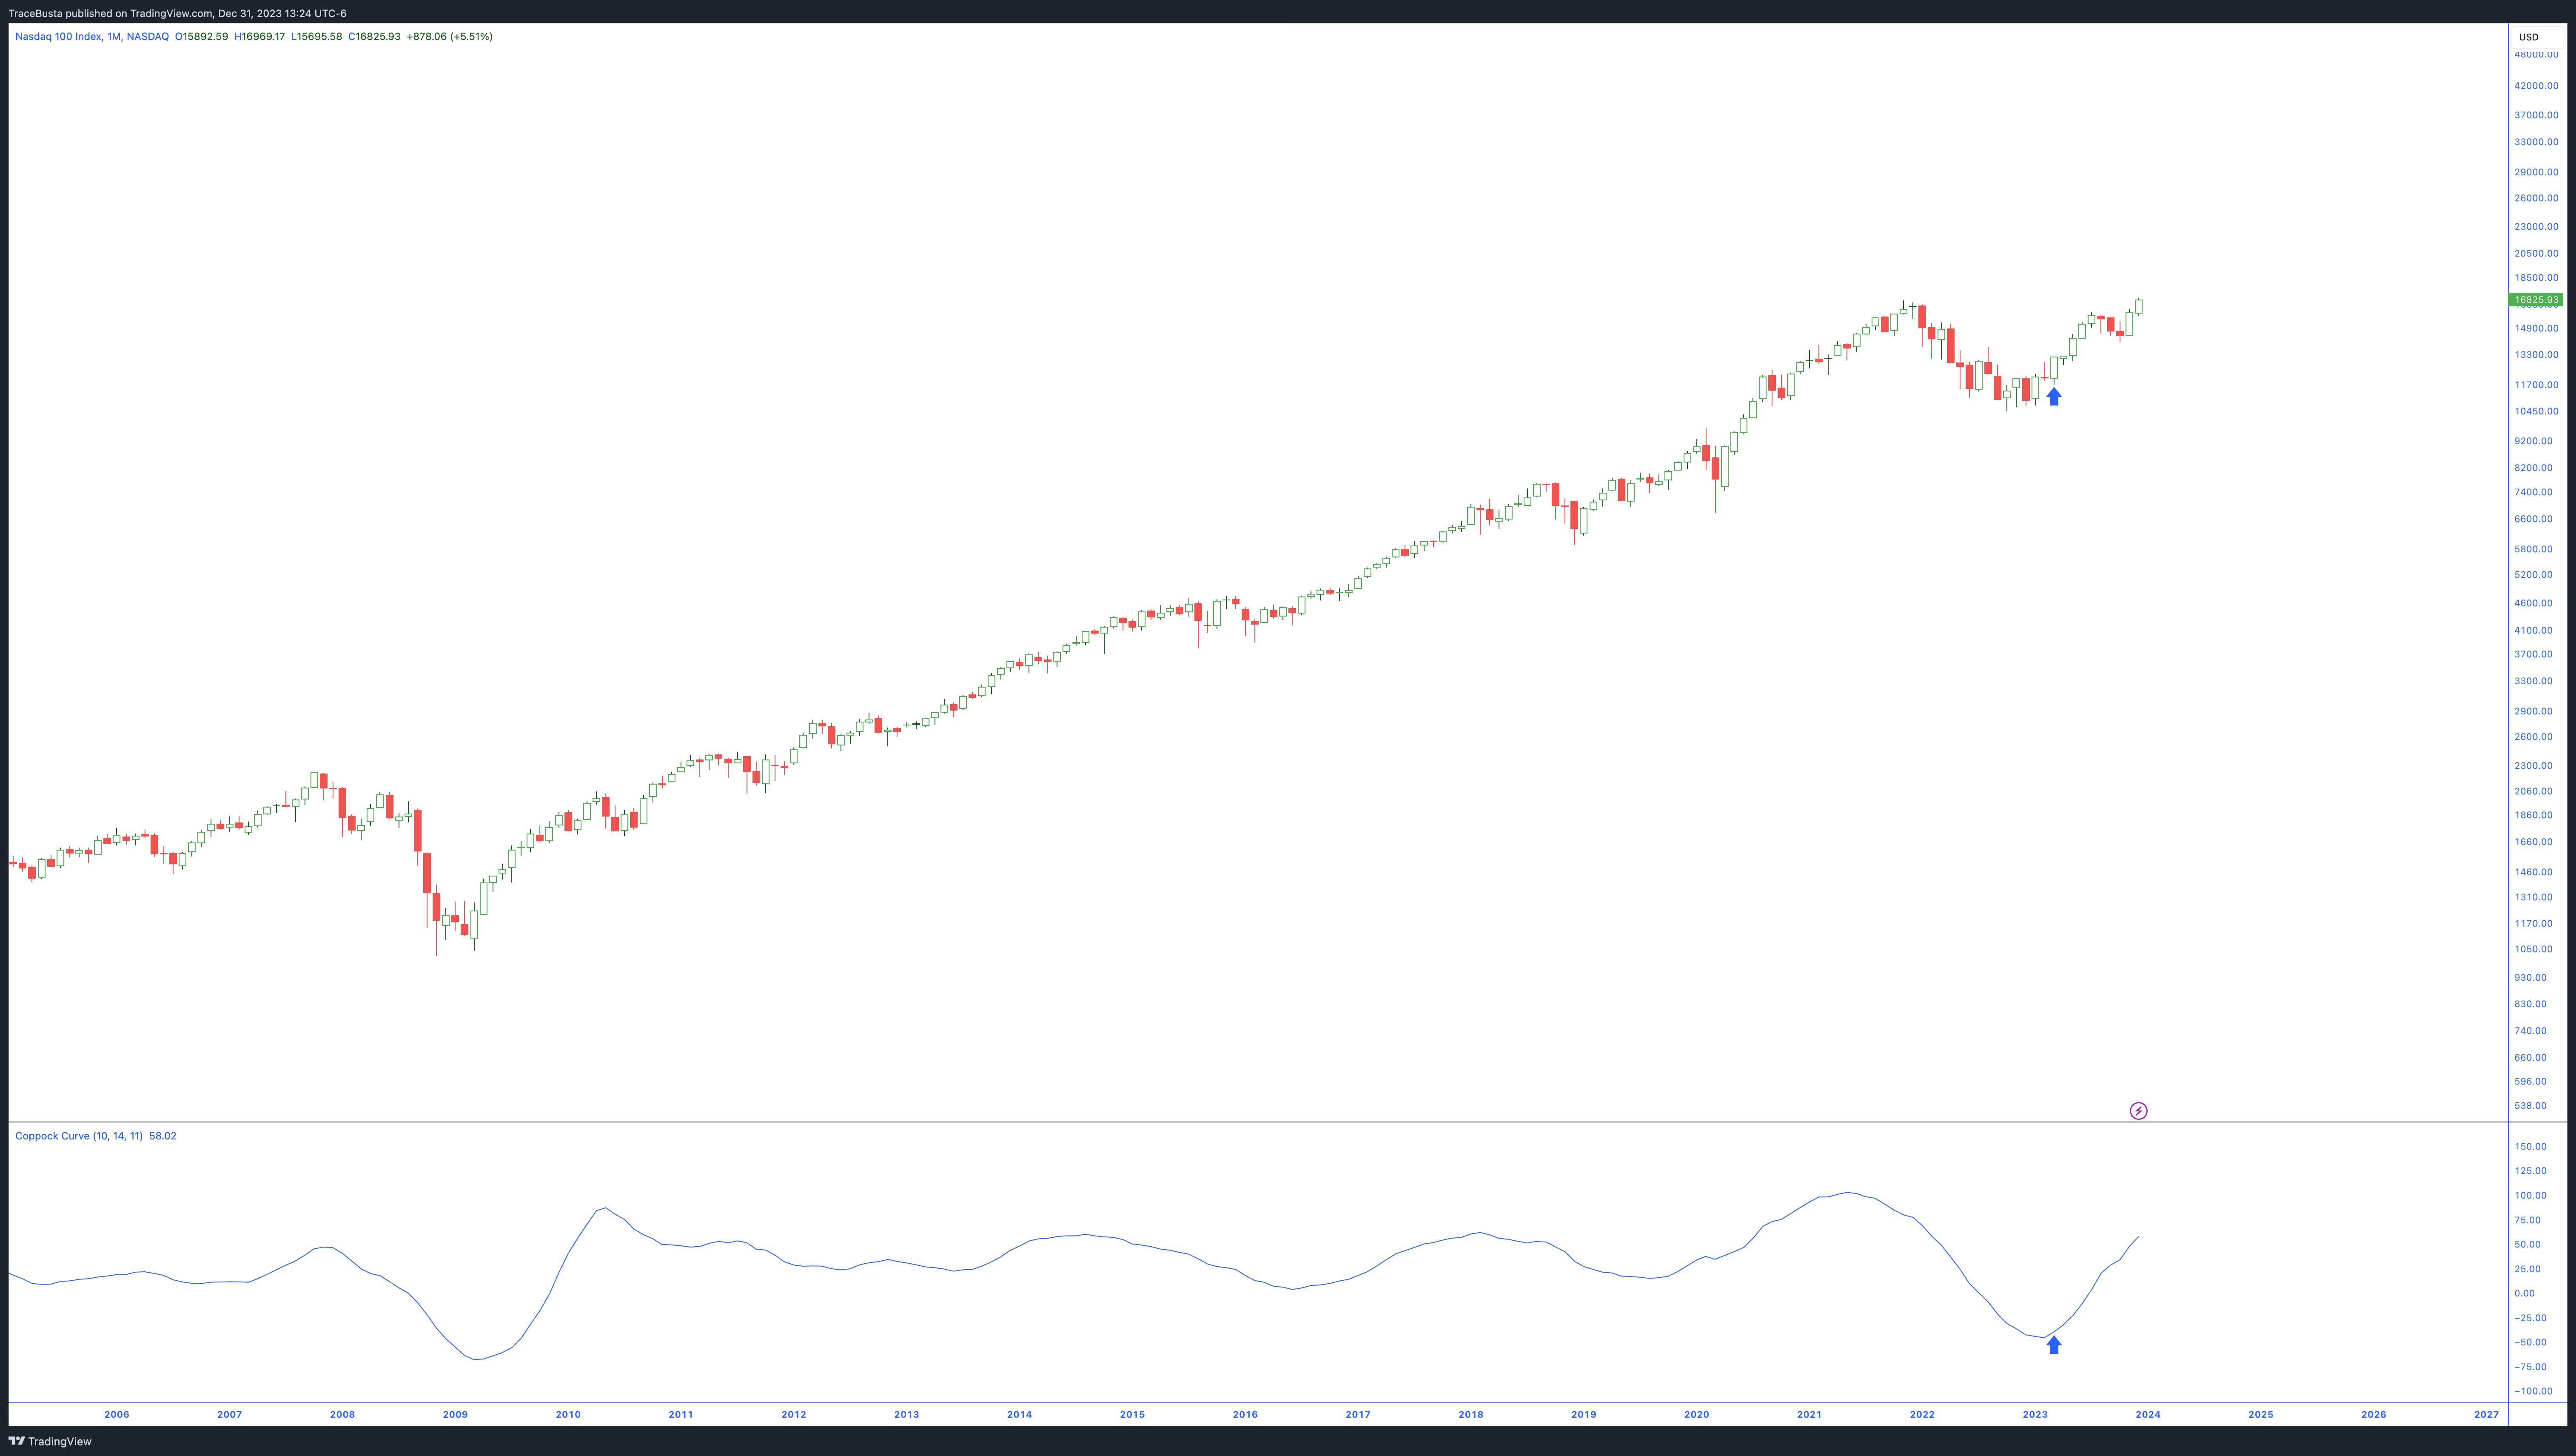
NASDAQ: A buy signal occurs when there's a 1-point uptick after a decline of 150 points or more. Positive territory crossing isn't required.
These criteria allow for earlier buying opportunities. In March, the SPX issued a modified buy signal at -93, while the NDX neared one at -147.
Here’s an updated chart of each index since the buy signal for SPX was issued in March, and the near signal was issued for NDX. SPX has since climbed 16%, and NDX has climbed 29%:
SPX:
NDX:
Here’s what I had to say at the time, after factoring in other signals:
Based on the historical accuracy of this signal, I am putting some serious weight on it, and with all of the other recent signals (ZBT, BAM, etc.) I am looking forward to the next leg of this rally continuing.
There could be something to this one when combined with others…
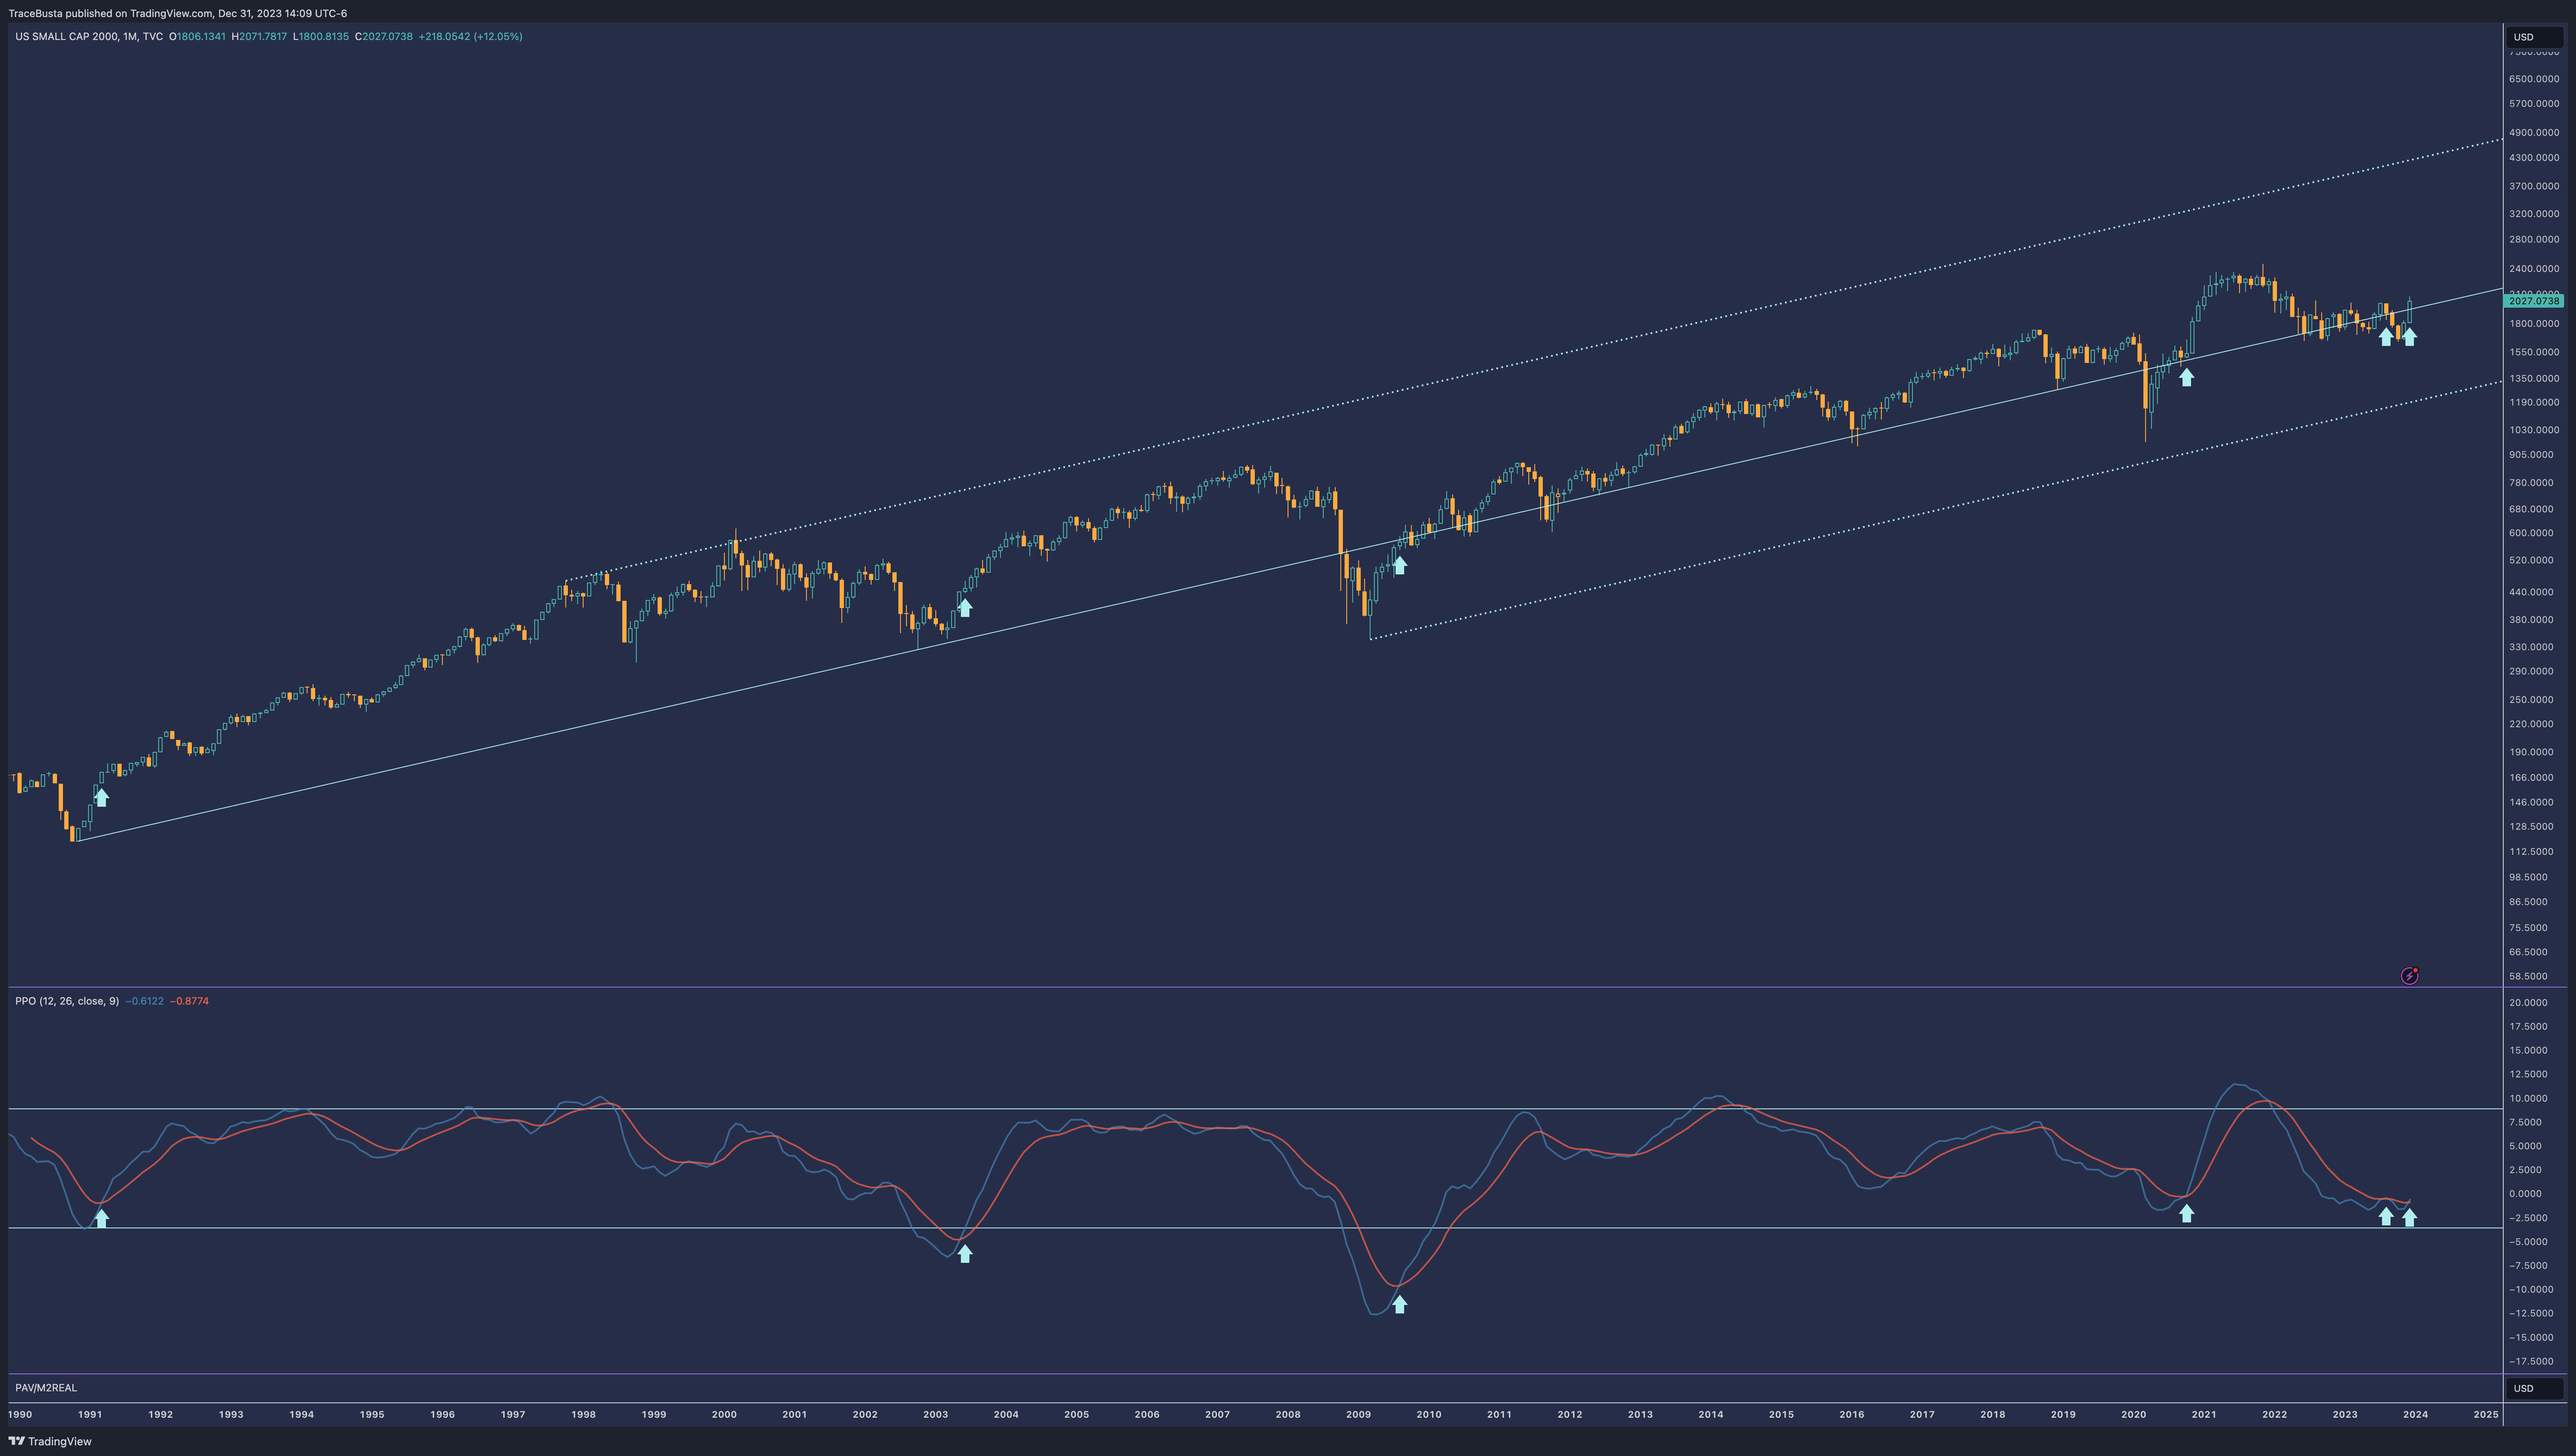
Russell 2000 Study:
Here's an update on the analysis presented in September. I specifically consider crossovers that occur below the -1.0 threshold in this study.
Please refer to the post below for a detailed review of the initial study introduction.
In my 17-Dec-2023 Market Outlook, I shared the below data:
Initially, the outcome over the first three months wasn't particularly favorable. However, we're now on the brink of another significant 'deep' crossover.
Since the crossover signaled by August's candle, the RUT has achieved a gain of +4.5%. This performance encompasses the four-month period up to and including December's candle.
Below is the updated table:
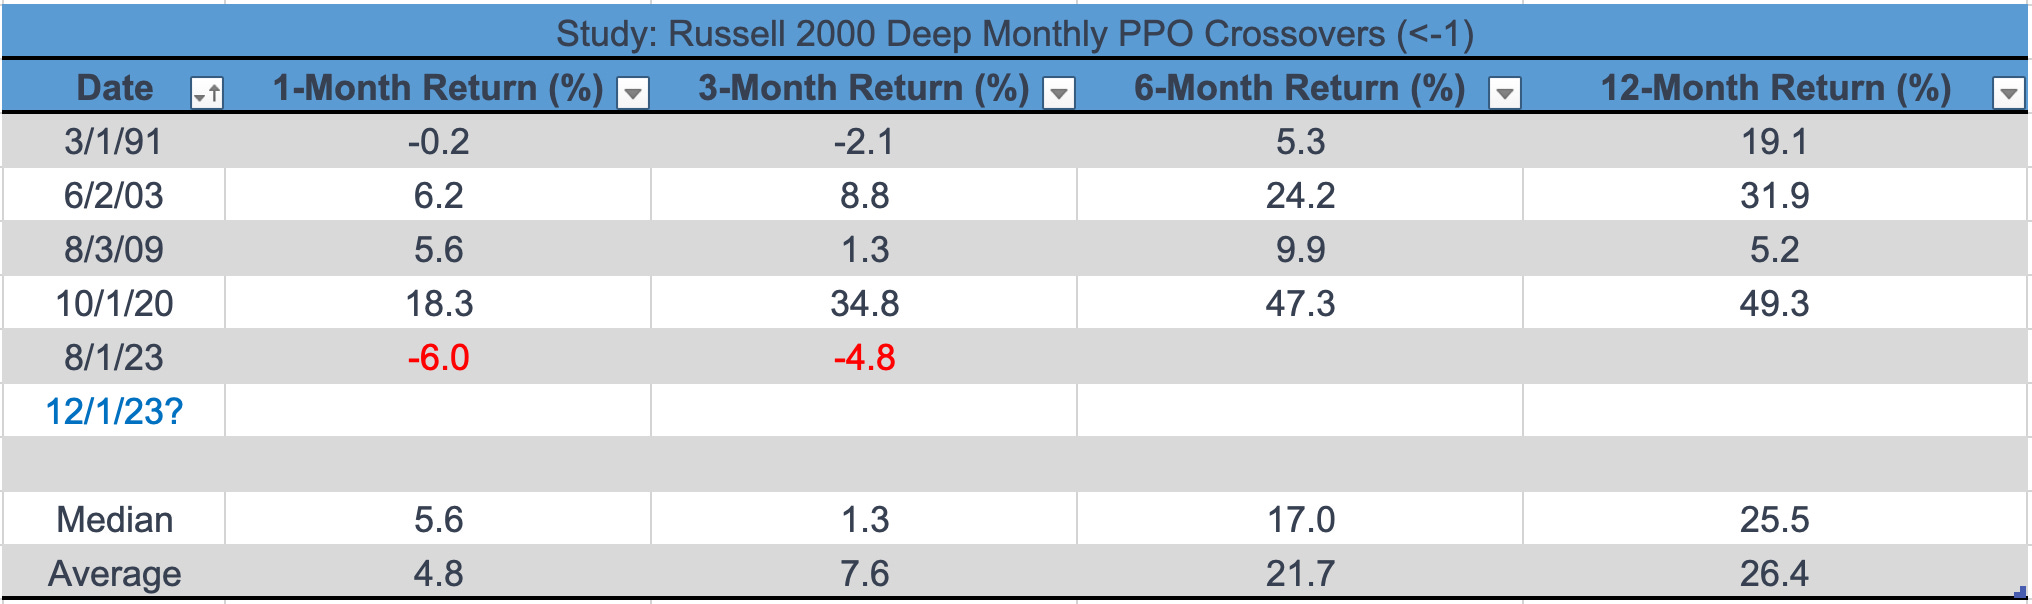
With the RUT on the cusp of another crossover and historical data indicating positive returns over 12-month periods, the coming year presents a promising 'Buy the Dip' opportunity in small caps, particularly if any market dips occur.
The second PPO crossover is now official with December’s close. The gains from the August signal are now nearly 7%, even when factoring in the bearish months of September and October.
With two recent signals, I like 2024 for IWM and small caps, especially if there are any first-half dips. Here’s the zoomed-out chart:
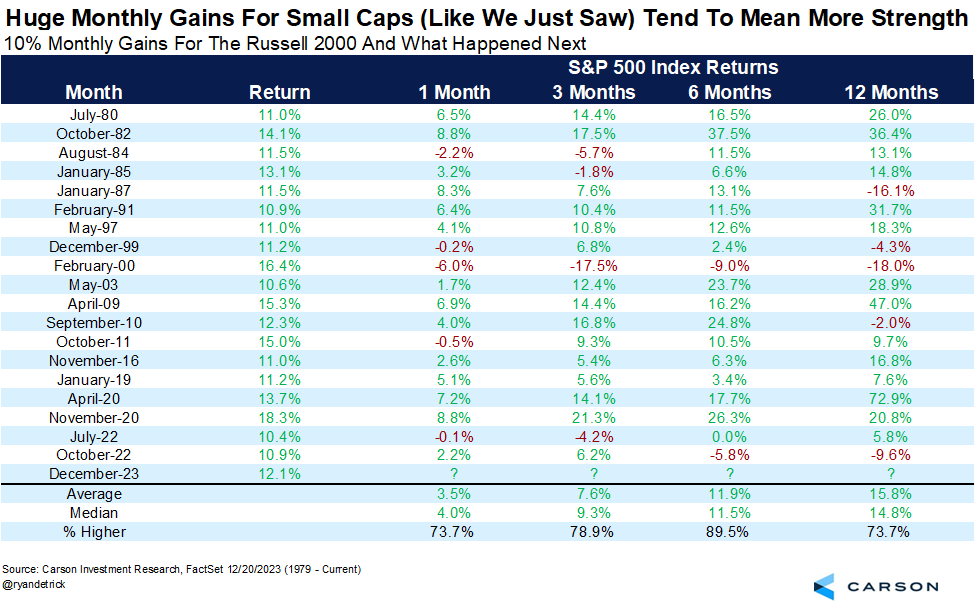
Quant Stats that I’ve come across recently:
From Ryan Detrick on X (formerly Twitter):
S&P 500:

RUT:

From Jonathan Harrier on X (formerly Twitter):
More than 90% of $SPX components were above their 50-ma twice in 10 trading days as of 12/26. Happened only 14 other times in the past 20 years.
The following month has historically been a bit weak but the following year is strong on average, w/ R:R significantly positive.

Here are the figures one month after the signals.
Minor pullbacks with drawdown exceeding average return are typical. But note the prior table with 1-year returns with average returns far exceeding average drawdown.

Looking Ahead: Potential Opportunities in 2024
Taking into account the quantitative statistics, chart developments, and upcoming discussions on Seasonality, I foresee potential opportunities in 2024. Discipline and patience will be key. While the gains might not mirror the magnitude of 2023, I'm optimistic about the prospects. It's about identifying these opportunities and approaching them with a well-thought-out strategy. Remember, the market is ever-evolving, and staying adaptable is crucial to capitalizing on what lies ahead.
Yearly & Quarterly Chart Analysis
It's important to remember that the following are chart studies – insightful, yes, but not definitive predictions. They're more about highlighting intriguing patterns and possibilities I've spotted in my analysis of longer-term charts.
SPX Yearly Candle Chart Insights

Could we be in an era where the SPX is repeating the 1950s? After a similar extension above the 10-year SMA, the SPX gained 103% over the next 10 years.
I note that after the Great Depression, there is a tendency for equities to ride the 10-year SMA, with a few rare exceptions below it. But in those cases where the yearly candle closed below the 10-year SMA, prices did not linger very long.
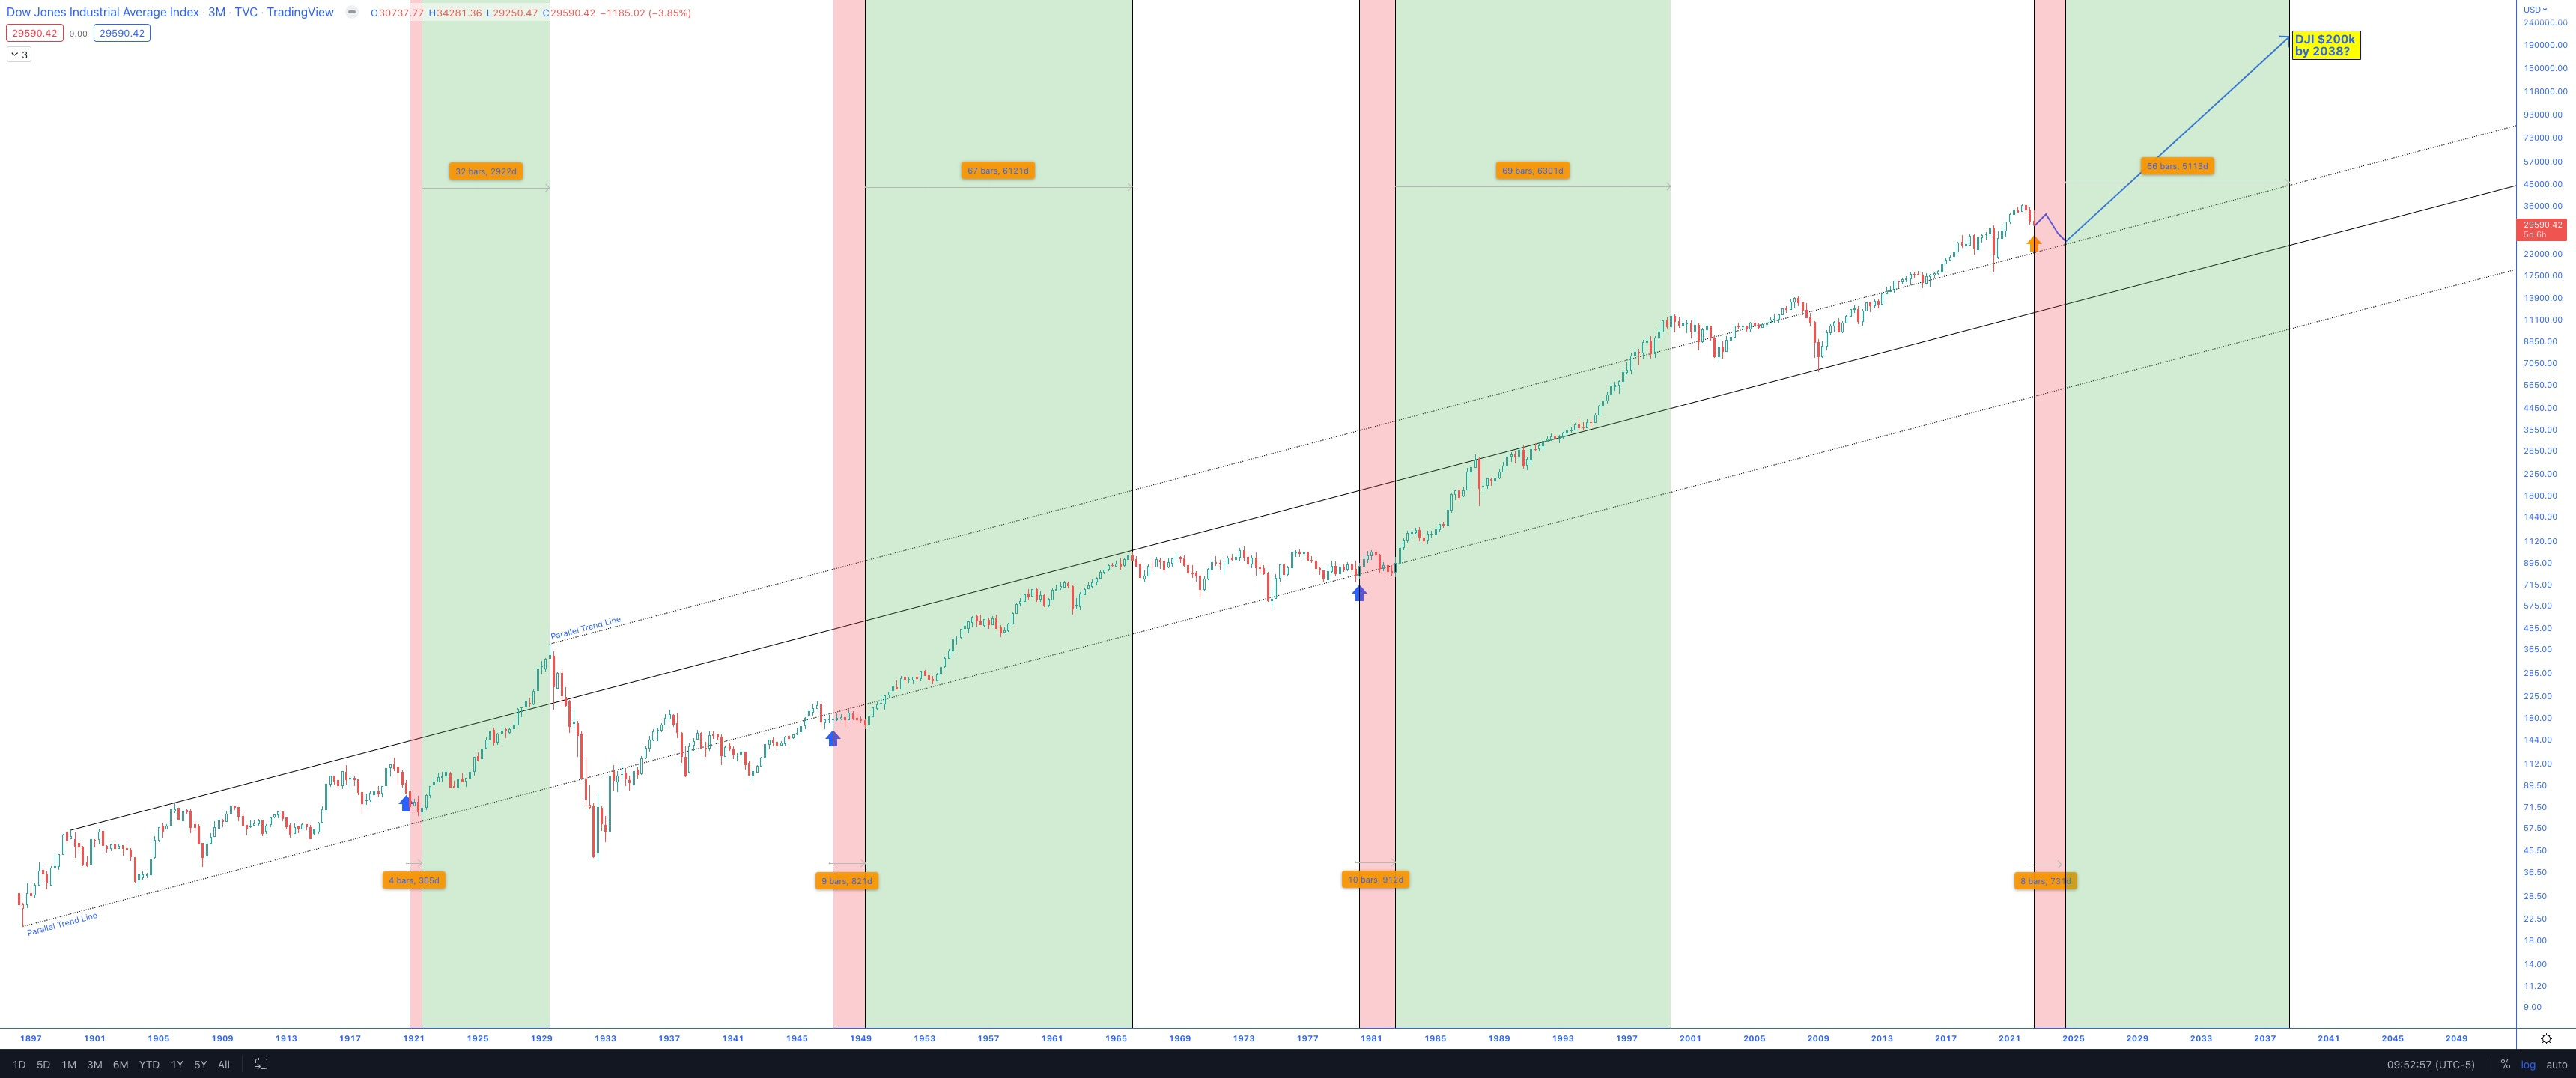
DJI Quarterly Chart & Inflation Study:
Last year, I delved into the Dow Jones Industrial Average in relation to inflation peaks. For those interested, you can find that study in the linked post.

Here is the original chart from September 2022:
I plotted those precise inflation data points on the 100+ Dow Jones Industrials chart. And that is where I started to see from a visual perspective what I had suspected for some time:
Once inflation peaks, there isn’t an instant market rebound; it takes 1-2 years to work through
Below is an update to that DJI quarterly chart, pinpointing the three previous inflation peaks with arrows. As a key note, the year-over-year inflation rate hit its peak in June 2022 at 9.1%. I'll be revisiting this chart later in the post to offer more insights.

In examining the Dow Jones Industrial Average over time, the red-shaded zones on the chart represent periods of market stagnation or flatlining. These phases, on average, spanned about eight quarters, equivalent to two years.
In contrast, the other shaded areas indicate the duration of secular bull markets, which have historically lasted an average of 56 quarters, or 14 years.
I’ve drawn a series of parallel trend lines that align well with the historical data. Based on this, there’s a projection suggesting a potential rise to around DJI $200,000 by approximately 2038. This target is derived from the average gains observed in the three previous secular bull markets, factored over their average durations.
Seasonality and the Upcoming Election Year
As we head into an election year, there are certain patterns and trends in the charts that I'll be keeping an eye on:
SPX
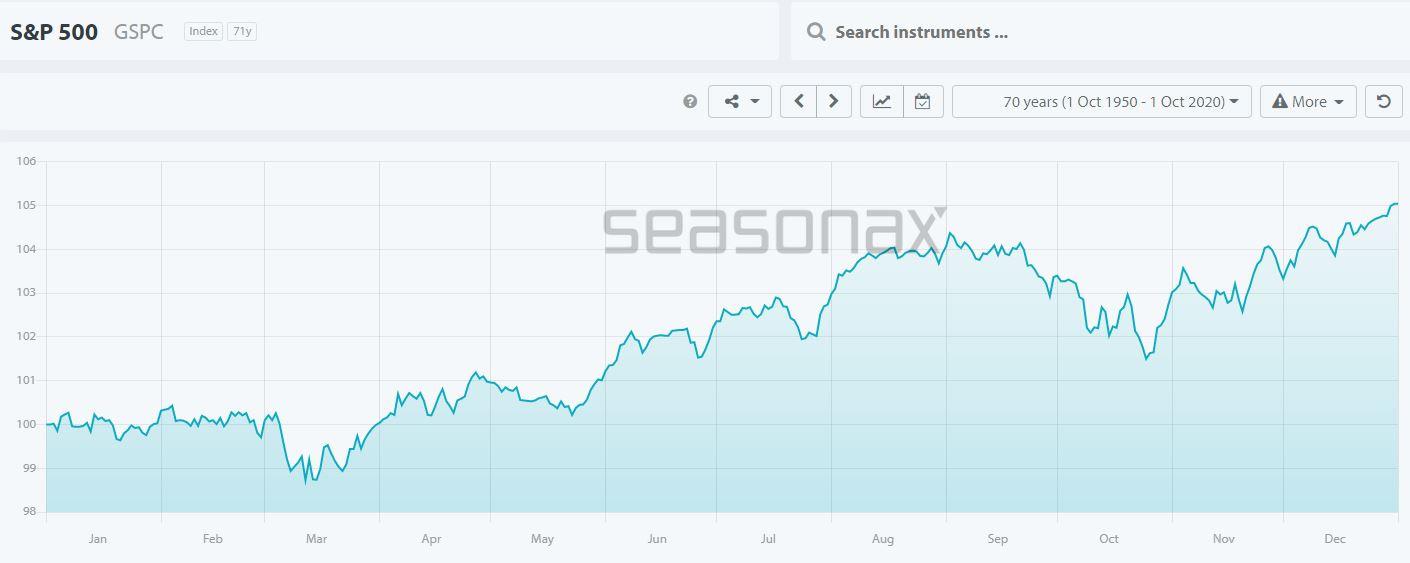
The SPX typically shows a somewhat flat start to the year, followed by a noticeable dip around mid-March. This pattern suggests potential shifts in market dynamics as the year progresses.
NDX
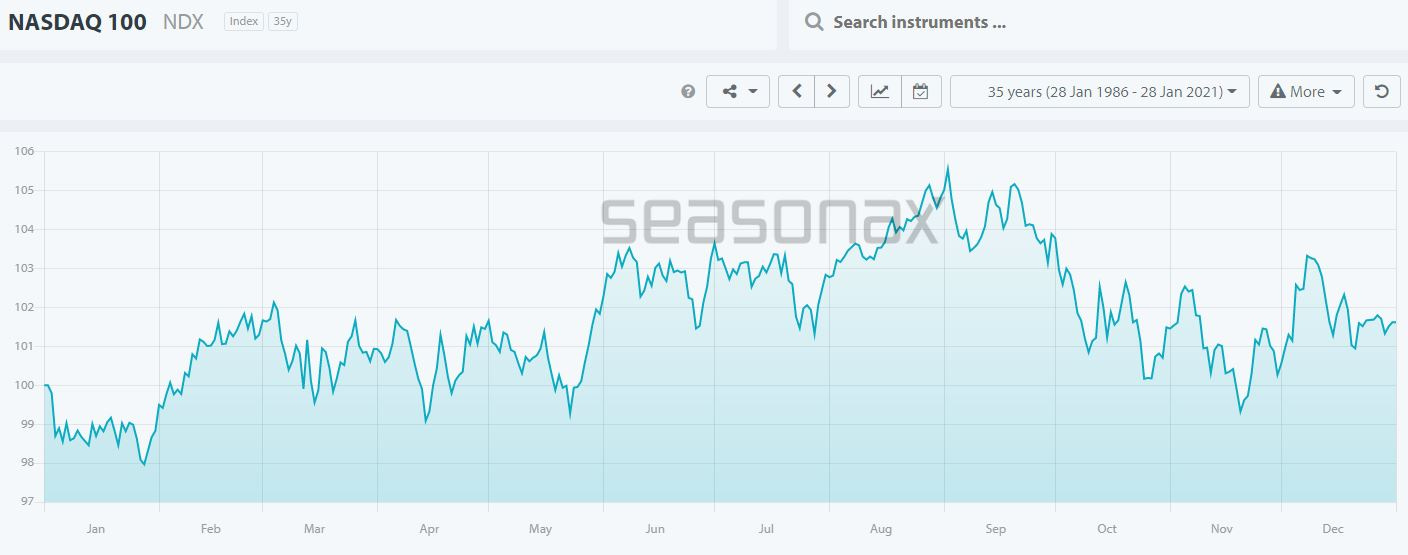
For the NDX, early-year movements indicate a possible dip, presenting what might be an opportunity early in the year. This warrants close attention for those watching tech-heavy indices.
DJI
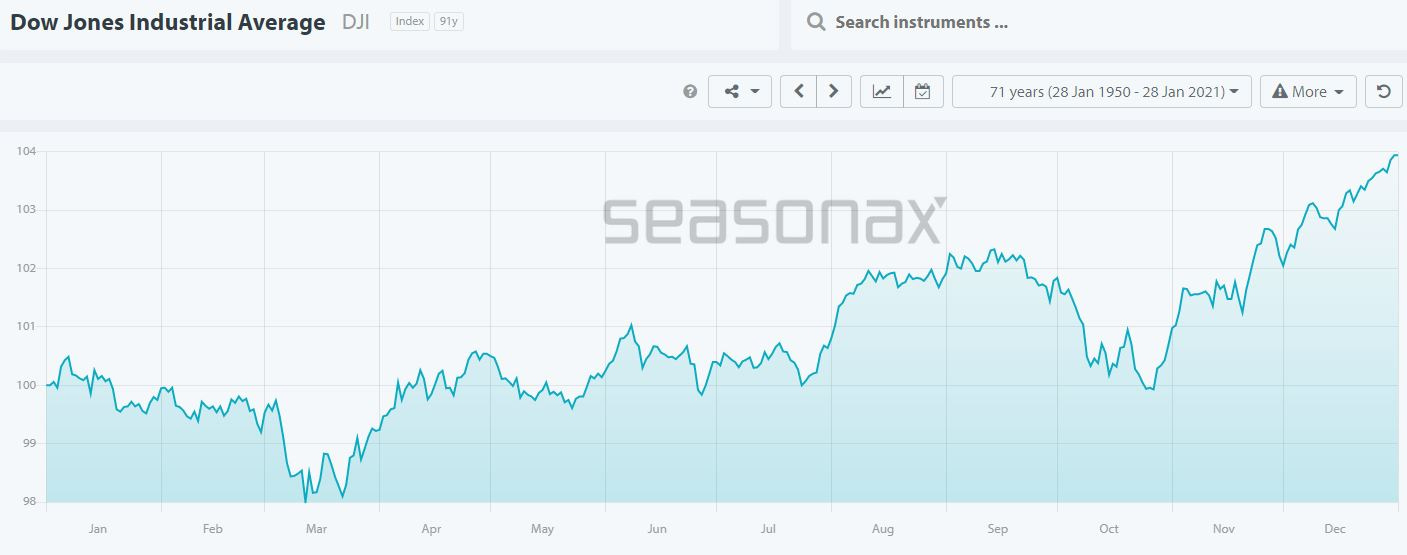
The DJI appears to follow a similar trajectory to the SPX but with a slightly more downward slope before reaching a point of capitulation in March.
In all three indices – SPX, NDX, and DJI – the traditional "sell in May" approach might actually transform into a "buy the dip in mid-to-late May" scenario in the coming year.
Sectors
Including Bitcoin in the sector analysis reveals its dominant performance, which tends to overshadow other sectors:

For a more focused look at how the rest of the sectors are performing, here's the analysis with Bitcoin excluded:

After removing Bitcoin from the equation, the second chart clearly shows that Technology (XLK) stands out as the top performer.
Put Call Ratio
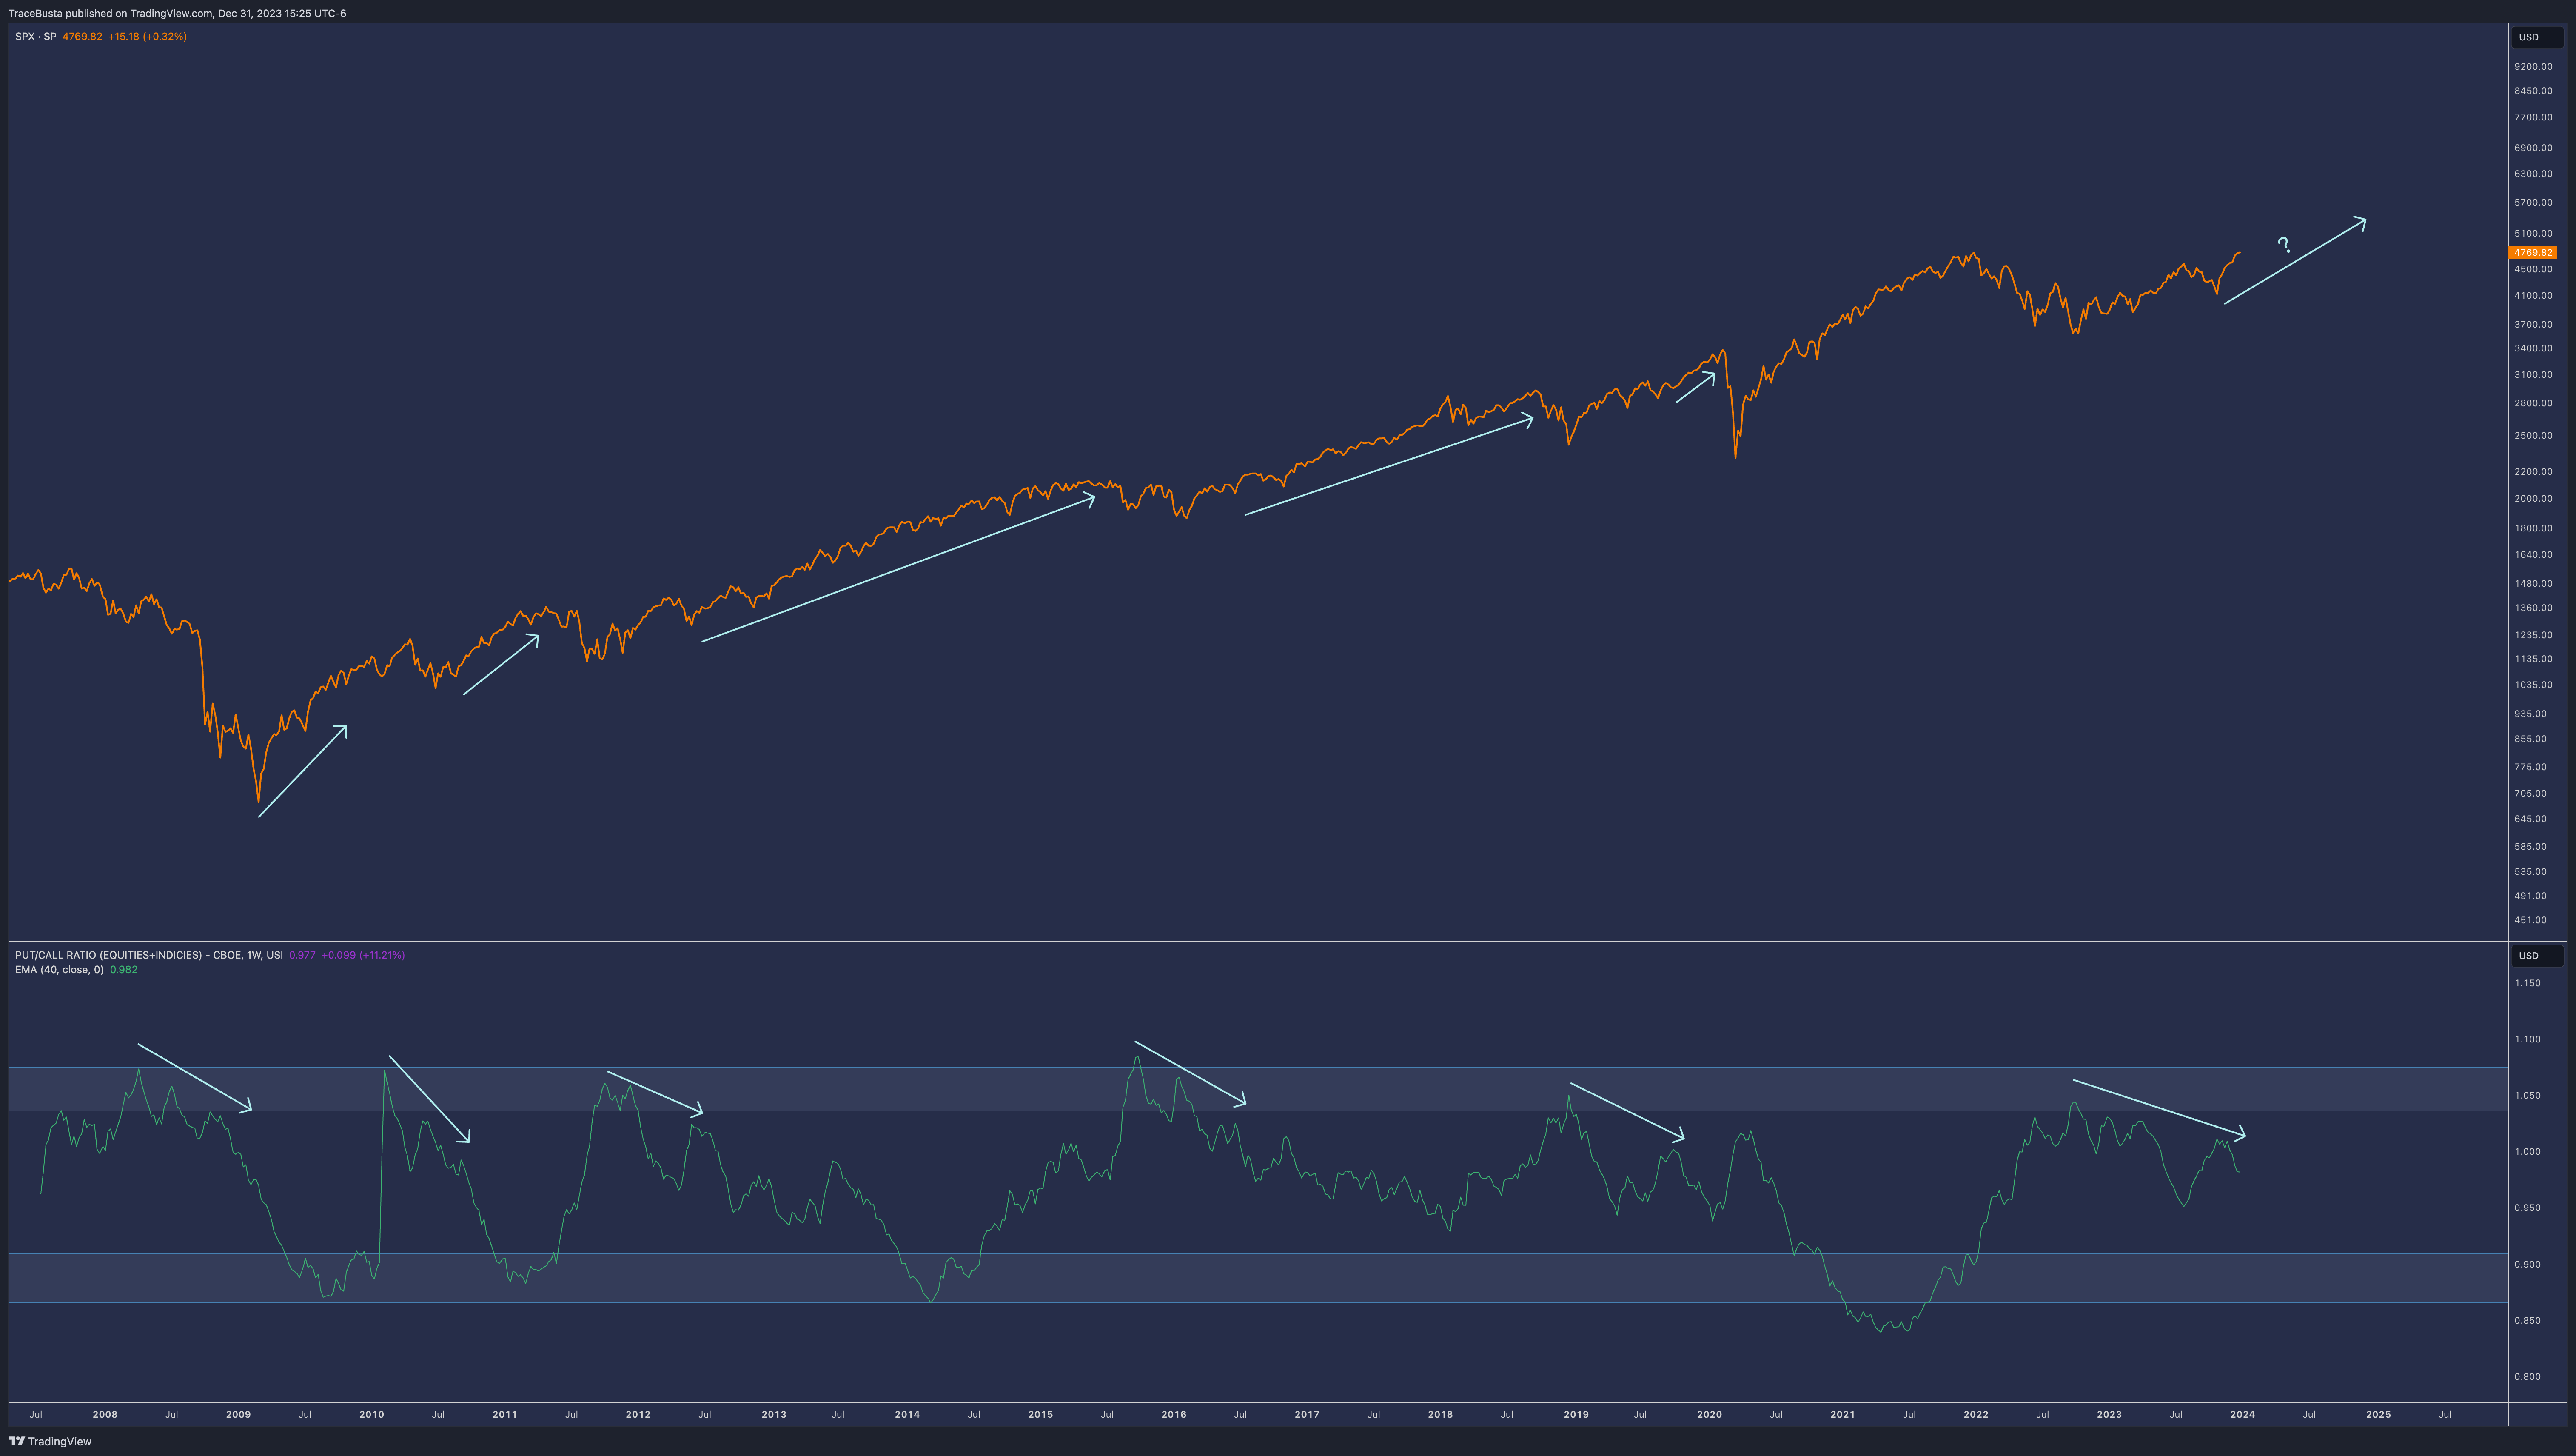
In my examination, I’ve charted the S&P 500 at the top and the 40-week Exponential Moving Average (EMA) of the Put/Call Ratio (Equities+Indices) at the bottom. This approach reveals a recurring pattern. Notably, the initial spike in the 40-week EMA, indicating heightened fear (reflected by high put/call ratio spikes), often doesn't mark the final low during periods of market stress and pullbacks. Instead, there usually are several subsequent fear spikes before the market truly bottoms out.
However, there's an important exception to keep in mind, like the 2020 Covid selloff. The market can always throw a curveball, making these kinds of analyses more of an art than a science. It's crucial to view this information as part of a broader analysis rather than a standalone indicator.
Oil Pitchfork Chart
I've previously shared the oil pitchfork chart, which has been a key part of my energy market analysis:
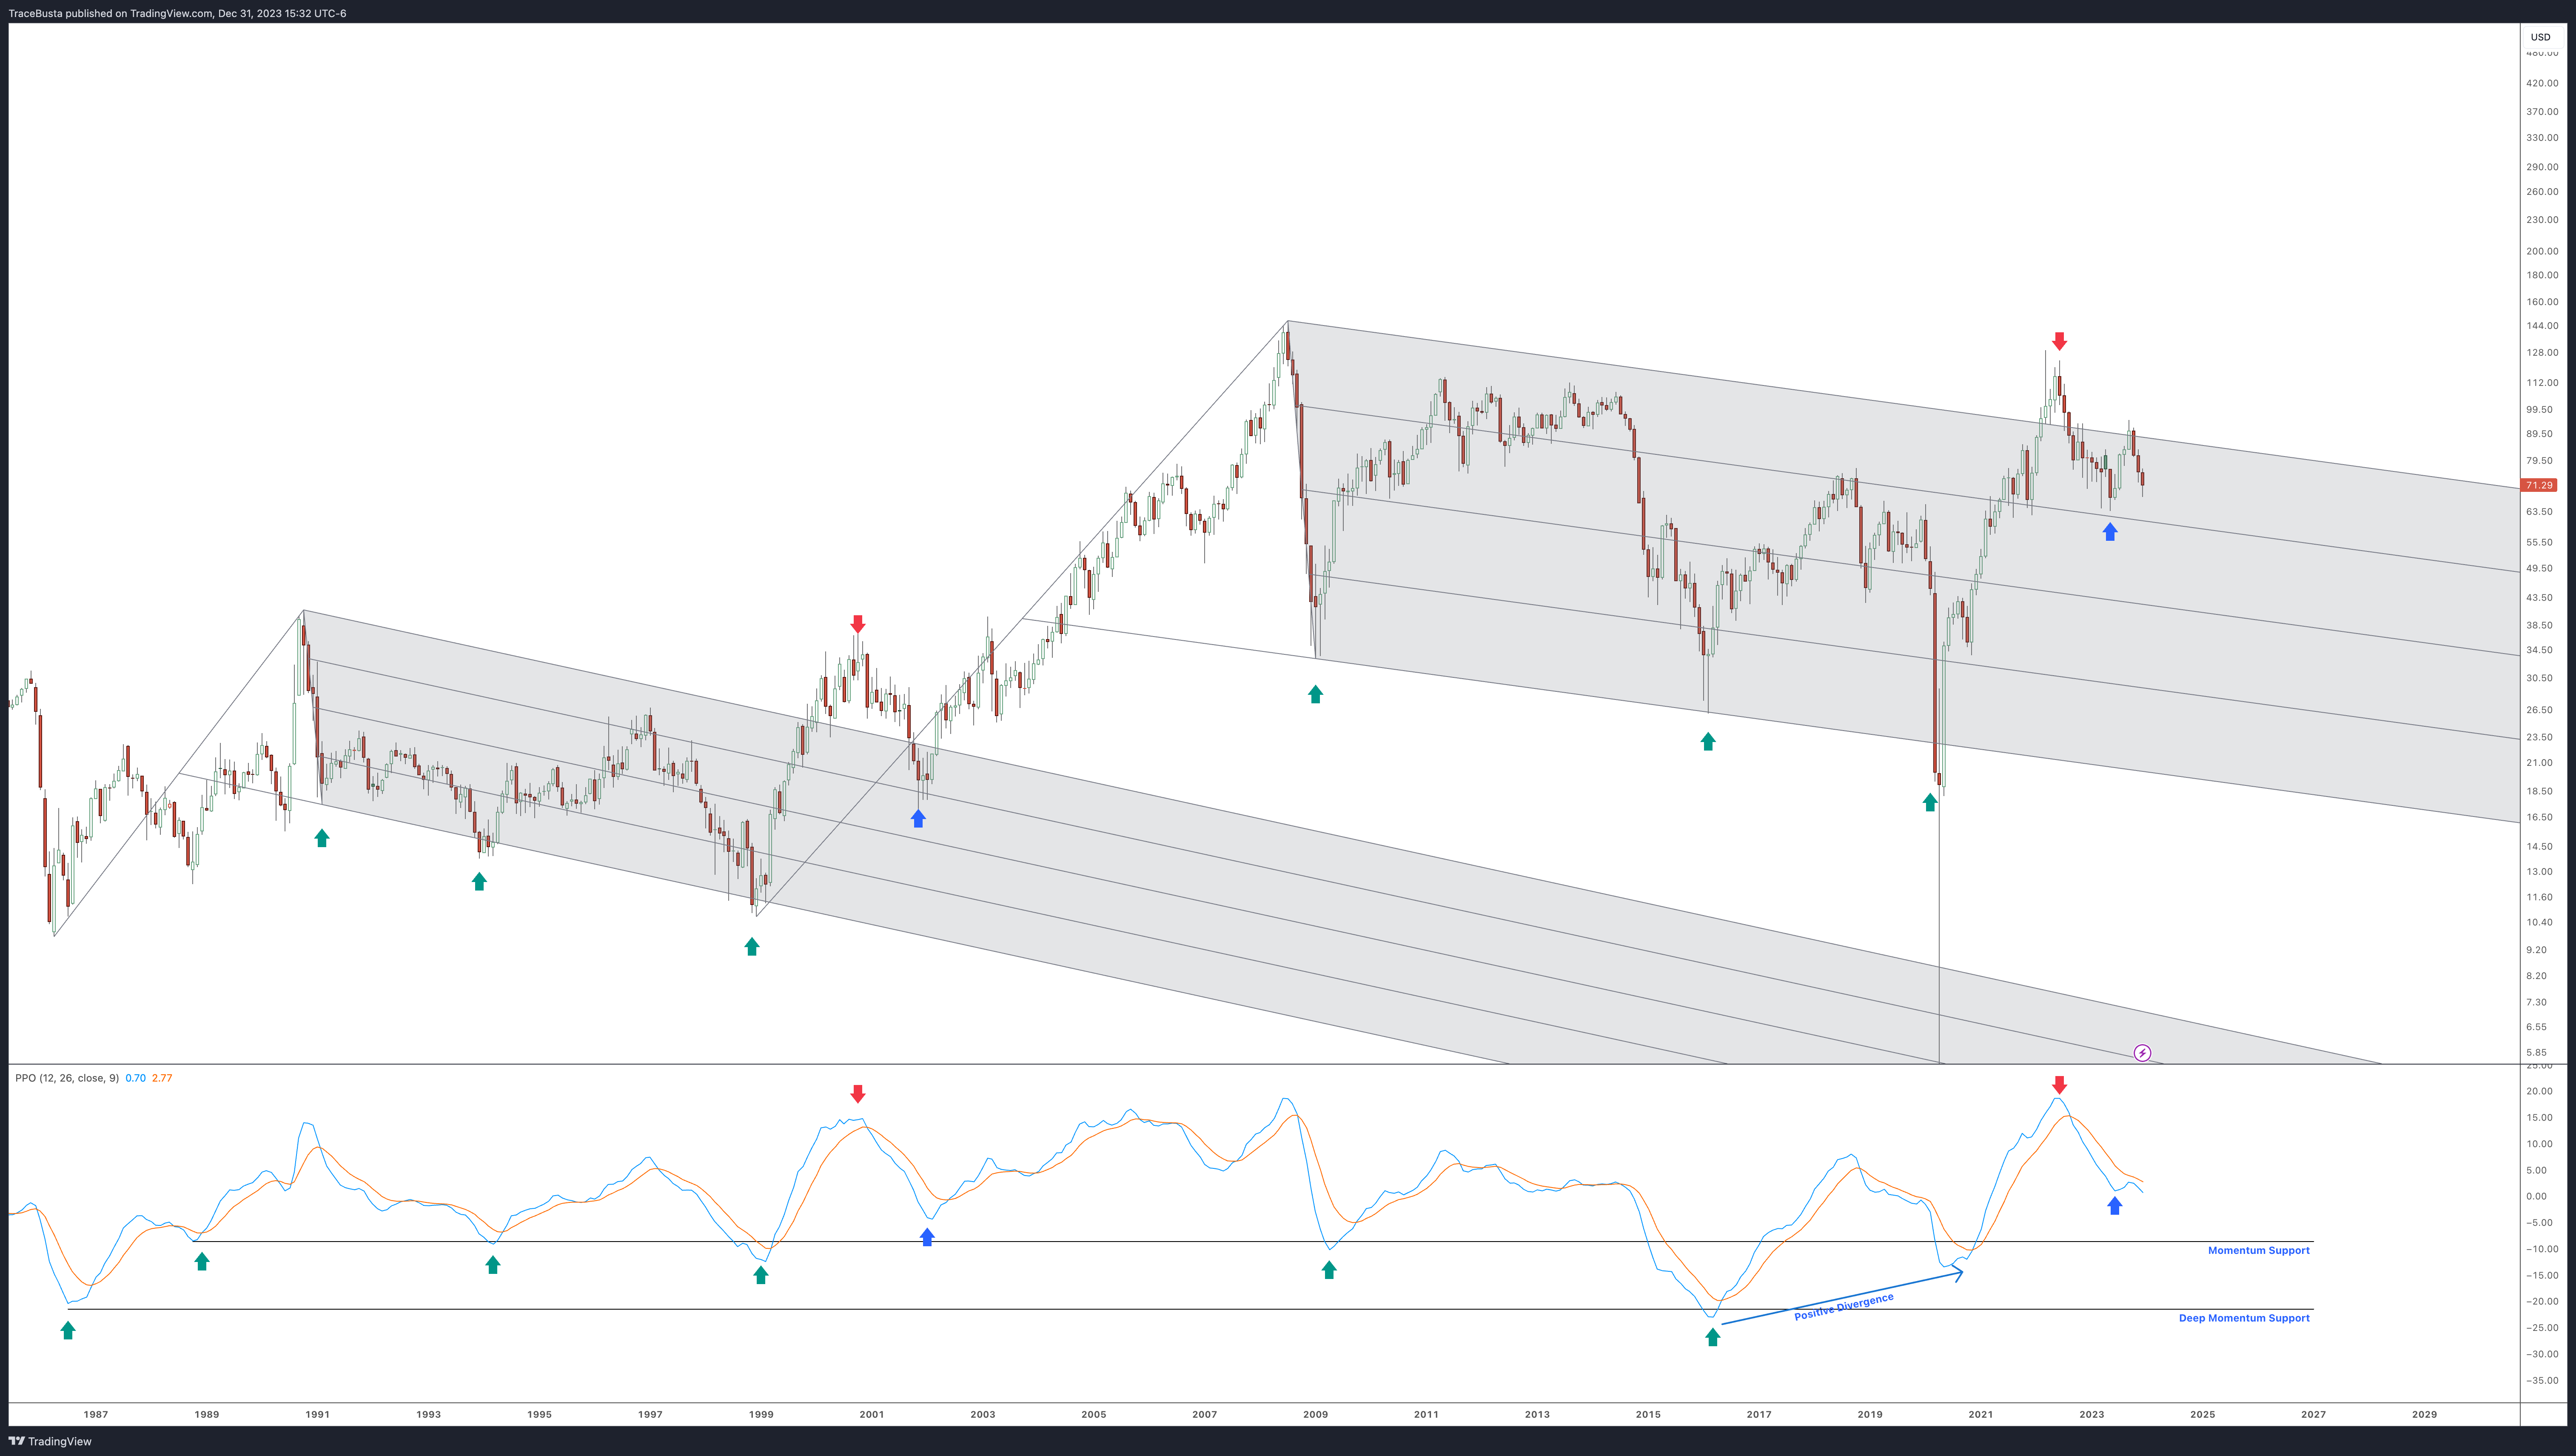
The oil market's recent three-month pullback fits the expected seasonality pattern, as illustrated in the chart below:
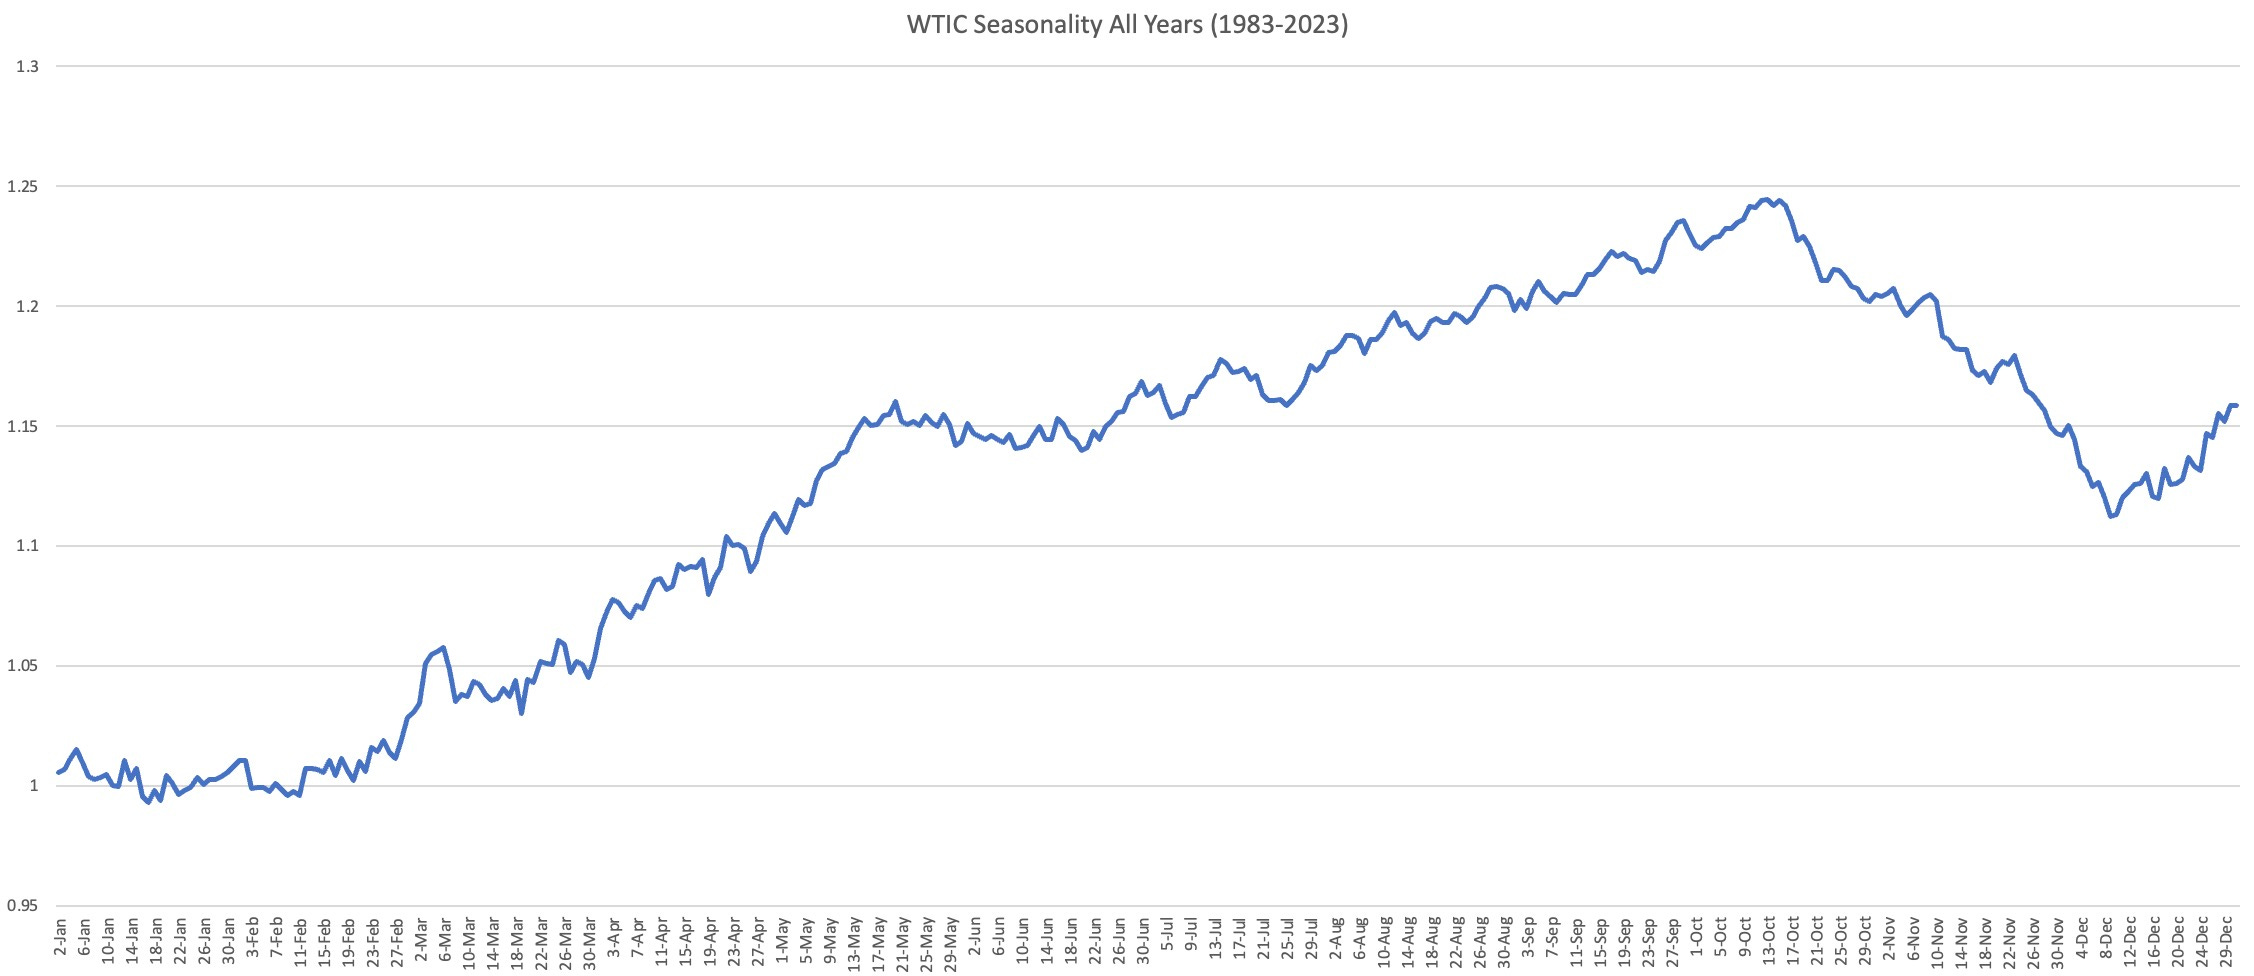
If the current trends continue to mirror the patterns of the 1990s-2000s, we might soon see Oil making its next significant move. However, considering that Oil typically starts the year flat, this anticipated movement may not materialize for another 1-3 months.
My keen interest in tracking Oil prices stems from my focus on energy sector investments and the impact Oil has on numerous small-cap stocks. When the energy sector moves, it often does so with considerable momentum.
Here is the Seasonality of XLE:
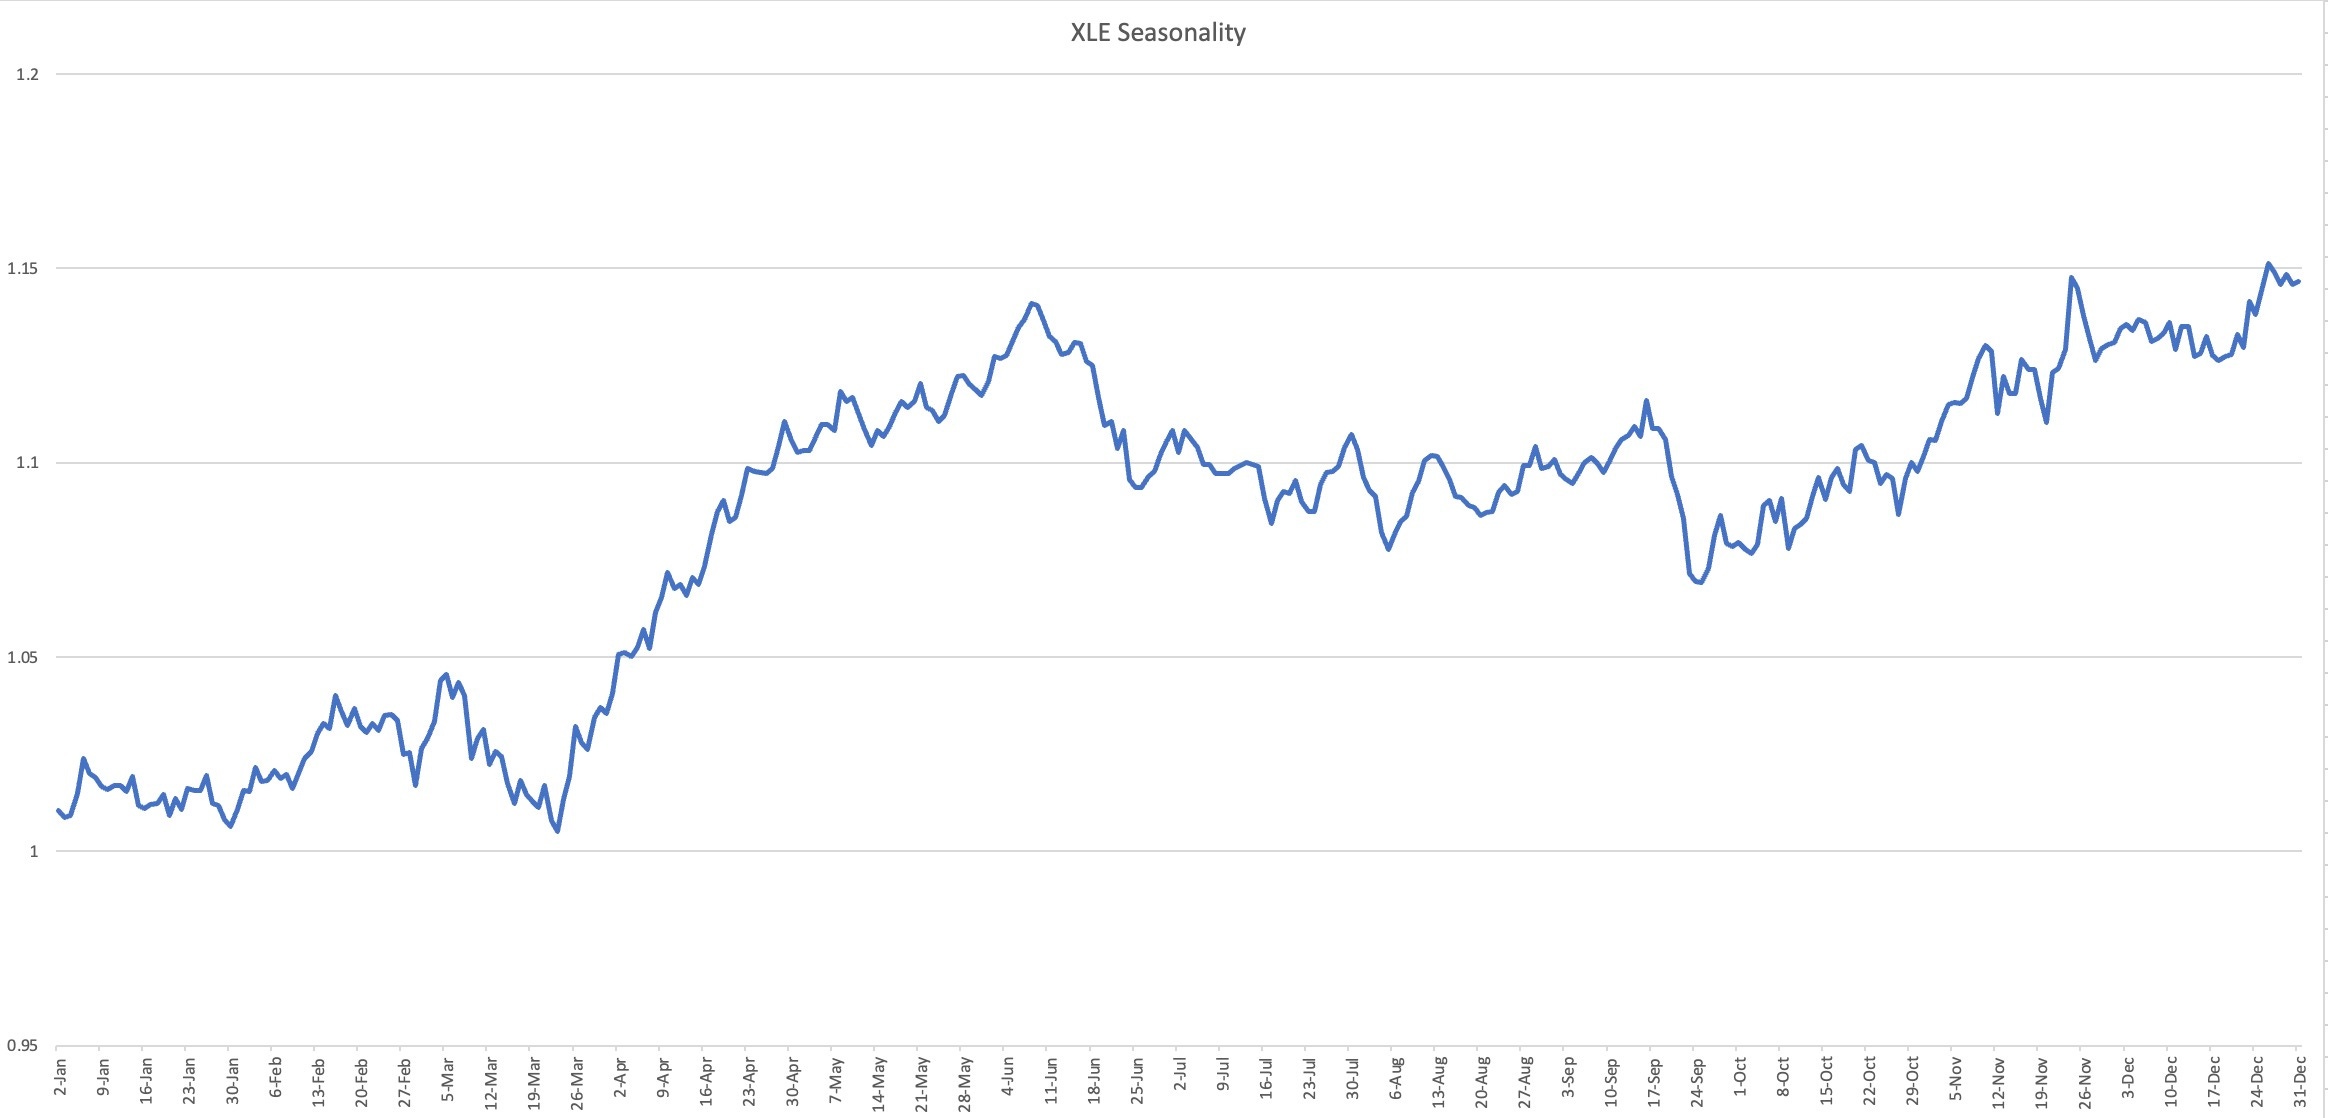
Considering the mid-March dip in XLE, I'm considering adding energy exposure around that time. This strategy could align well with Oil's movements, particularly if Oil starts its advance earlier in the year, say January or February.
30-Year Mortgage Rates Analysis

The recent plunge in year-over-year 30-Year mortgage rates has mirrored the rapid descent seen back in 1981. However, this time around, there’s an even steeper negative divergence in momentum compared to what was observed back then.
My current perspective is that these rates are likely to retest the 5% mark. Once they reach that point, there’s a possibility for them to trend lower again, especially considering the extent to which the momentum has stretched.
Inflation Trends: A Historical Perspective
The inflation chart, stretching back to 1915, offers a long-term view of inflationary trends over the decades:

While there are no certainties in market trends, the current pattern suggests that the year-over-year inflation rate might decline to test the lower ranges, possibly hitting the 2% mark or even single digits in the upcoming year.
Point and Figure Chart
No post of mine would feel complete without at least one point and figure chart. While examining the four major indices, I was particularly drawn to the IWM chart, which stood out to me:
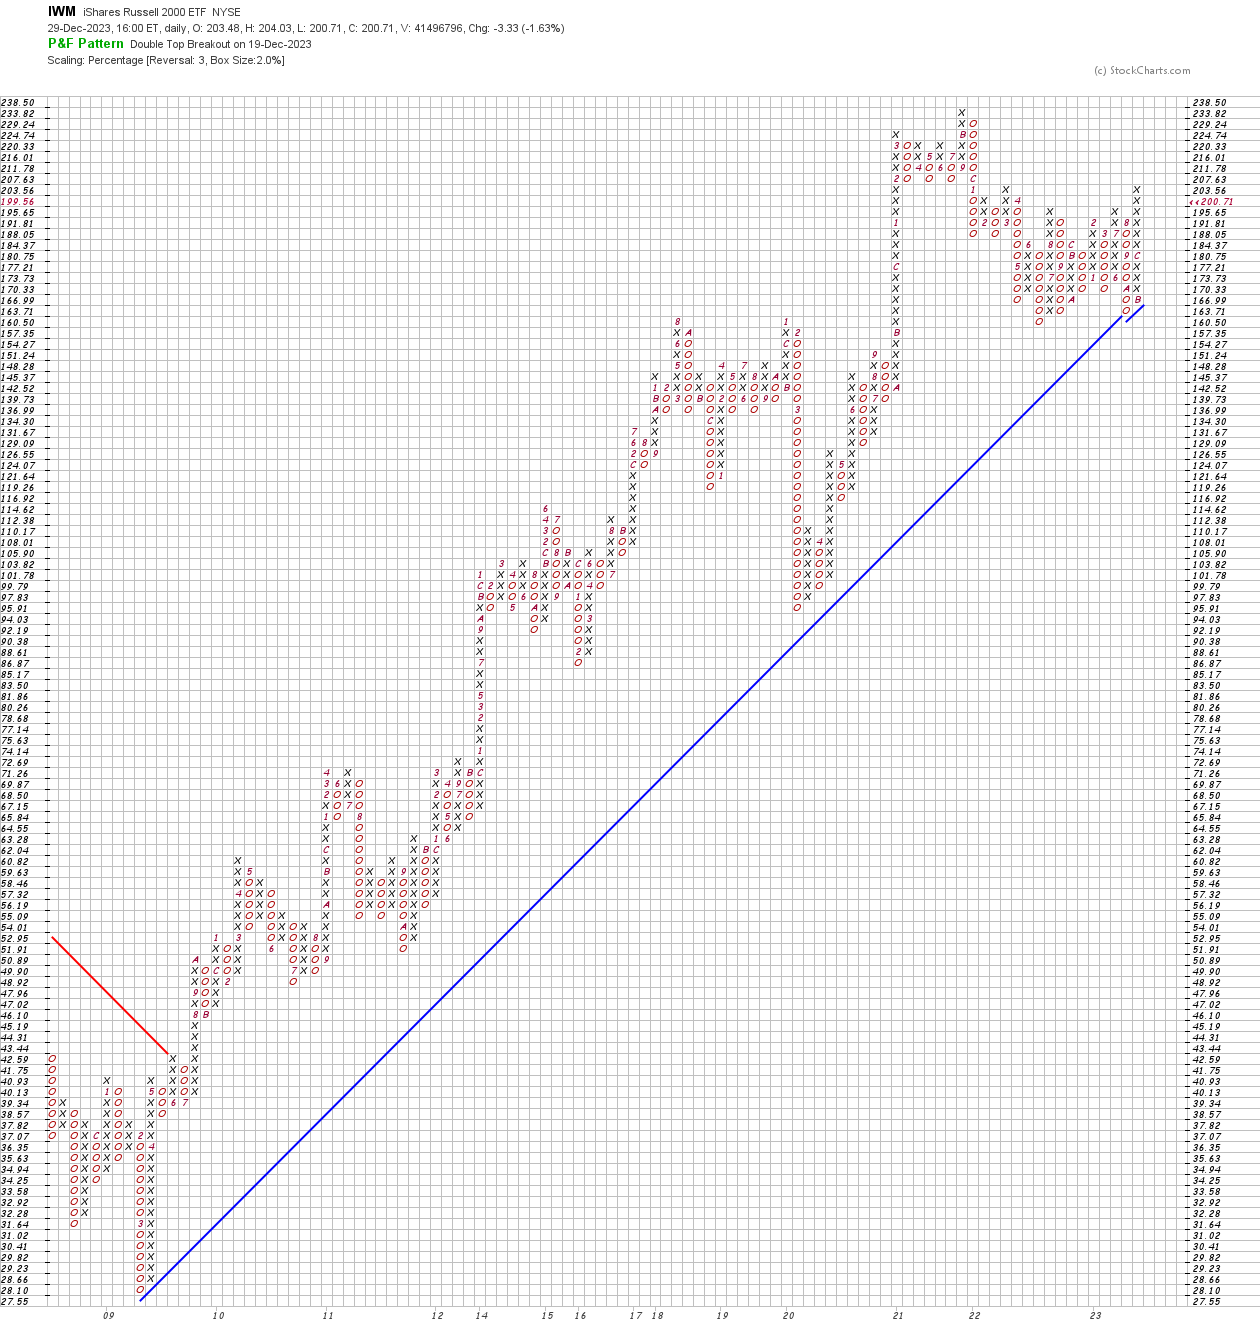
Created using daily closes with a 2% box size, this chart showcases a distinct 45° trend line dating back to the 2009 Great Recession lows. There’s a compelling series of columns here that could be used to calculate an objective. Right now, what I'm looking out for is an opportunity to “buy the dip” or a breakout on a daily close above $207.63.
Closing Thoughts
Today, as I sifted through various charts, I was reminded of a crucial lesson from my earlier trading days. I used to spend countless hours forcing a narrative onto a chart, overlaying numerous lines and indicators to validate a gut feeling or justify a position. Sometimes it worked, often it didn't. Now, I've realized the value of simplicity. If a trend channel or buy signal isn’t immediately apparent on a chart, it’s probably not there. In my experience, if you can't spot the trend within a minute, it likely doesn’t exist.
For those who found success in 2023, congratulations! Remember to stay humble and focused, keep up the hard work, and resist overconfidence. The market has a way of bringing overconfidence back to earth.
Resilience is key, especially if you found 2023 challenging. A positive mindset is crucial in navigating the unpredictable nature of trading. Reflecting on mistakes, documenting them, and making adjustments is essential. When I've faced difficulties, I've learned to slow down, trade less, and reduce the noise on my charts, focusing on patience.
Mistakes are part of the journey. It's not just about correcting them, but evolving from them. Remember, progress in trading is about consistency and gradual improvement. Find out what doesn’t work and stop doing that. It's about taking measured steps forward, one at a time.
In the words of Arthur Ashe, "Start where you are. Use what you have. Do what you can." This mindset is invaluable in the world of trading and investing.
As this chapter concludes, I'm truly grateful for your support over the past 3.5 years. It's been an incredible journey of challenges, learning, and growth. Thank you for being a significant part of it and for all the engagement along the way. Wishing you continued success and smart trading decisions ahead.
Best of luck in 2024 and beyond!

Thank you Trace. Really appreciated your insights and wishing you all the best! Here’s to many successes in 2024 :)