

Weekend Update
Weekend Update
9/26/20 - SPY, QQQ, IWM, TSLA and Poker


Corrections happen through time and/or price. Often times I see sideways chop as a form of “correction” as it burns off excessive bullish sentiment and allows key moving averages and trend lines to catch up. This may be the case with the Sept-Oct seasonality. Starting in early September as regular readers of my posts were often reminded throughout July & August, the market headwinds were coming into play and the market responded by turning down. Compared to prior pullbacks, this so far seems to be of the less bearish variety. The weekly charts are showing a halt in the decline and a chopping period rather than a more severe drop in price. Only time will tell, but for now it looks as if the bulls are finding support in key areas across the charts I’m looking at. From what I see on the tape, this appears to be a correction more through time rather than a significant price reaction.
Here is SPY:
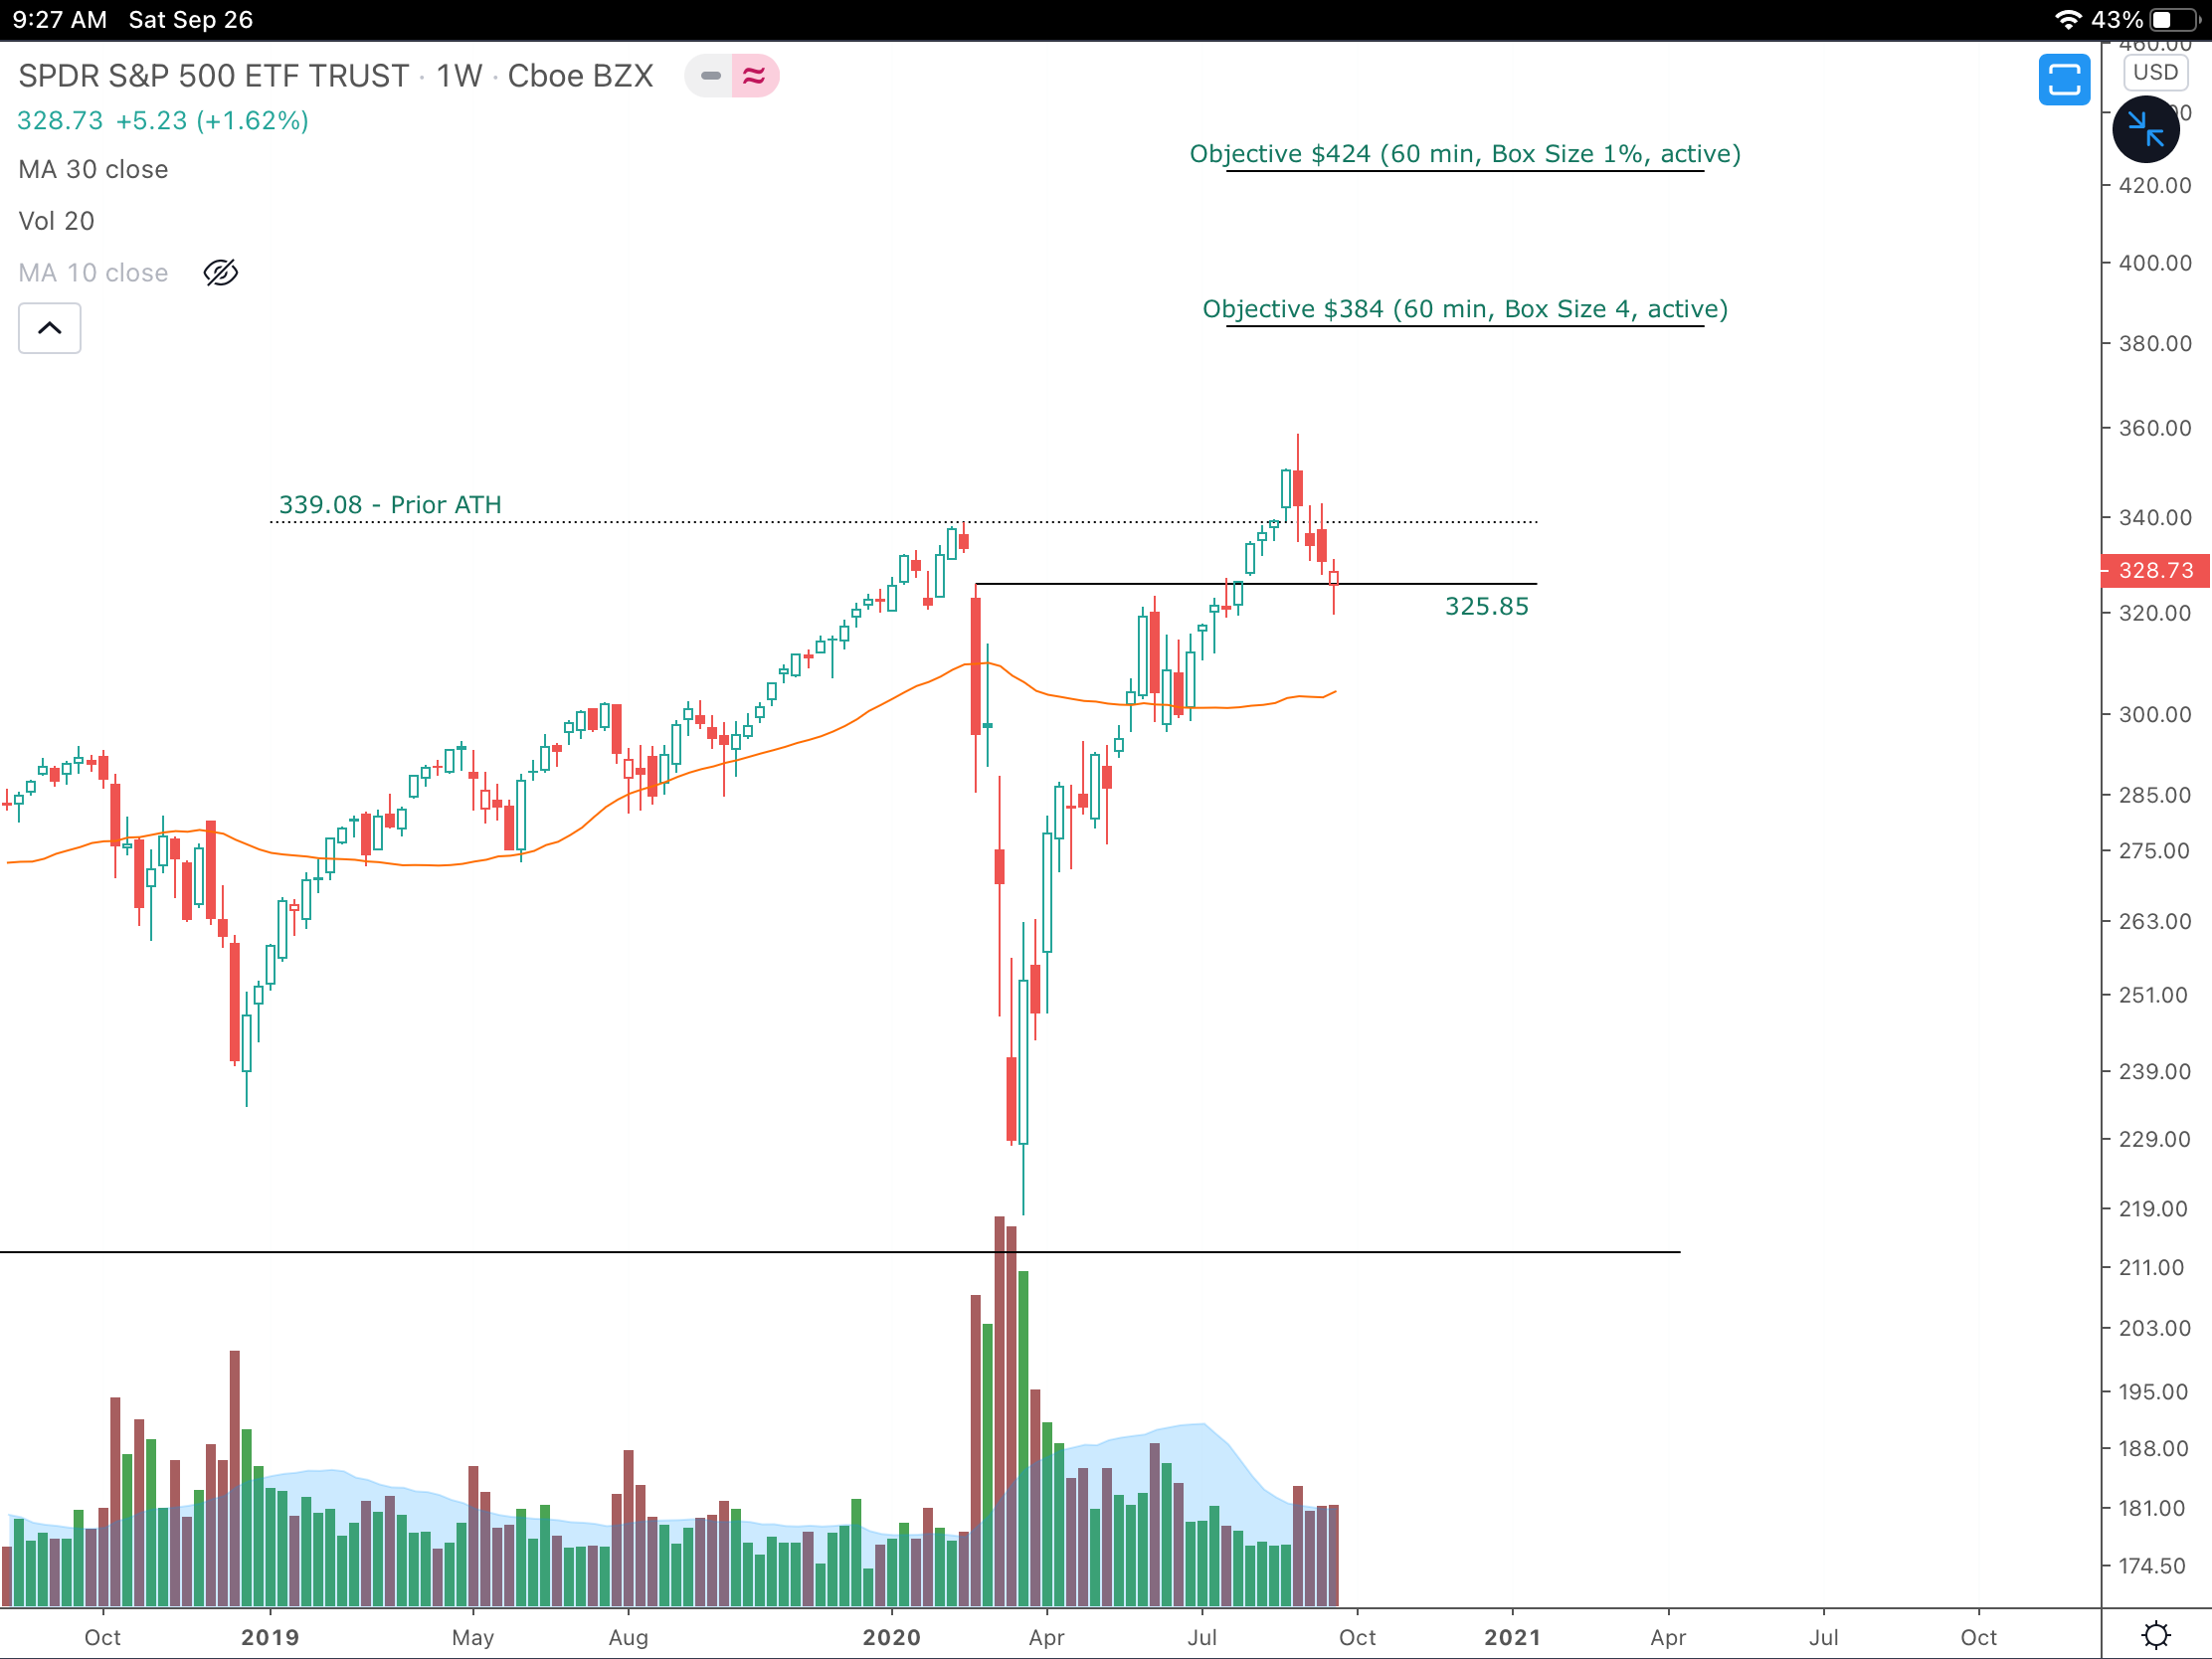
The gap down candle from late Feb ‘20 had a high wick at $325.85. This is now looking like an area where the bulls are stepping in. Four weeks of relatively high red volume and that is all the bears were able to do. There was a Wyckoff book I read a while back written by David Weis “Trades About to Happen” where Weis described a concept I thought was interesting: “Ease of effort”. How easy is it for the bulls/bears to move price in their desired direction? Just something I keep in the back of my mind when I check price & volume. I also like to look at it from a perspective of “absorption”. If on each pullback to a support level, the volume is diminishing and the ranges decrease, it usually implies bulls absorbing supply (and vice versa for the bears on upthrusts to resistance). After looking through thousands of charts, this just becomes automatic in my mind.
My ideal scenario on this SPY chart would be a move higher into that area labeled as “339.08 Prior ATH” and perhaps testing the high wicks from the two prior weekly candles followed by a shallow pullback / chopping action into mid/late October. This would get through the seasonal headwinds and allow that 30-week moving average to catch up. If that all happened on diminishing volume I would probably go for some dated calls targeting $400+ on SPY (somewhere between the two active targets shown on the chart). It rarely happens out exactly the way I’d like, but I like to have plans in case something similar presents itself. Patience will be key.
QQQ:

Volume spikes usually coincide with bottoms (even if they are only short term bottoms). This chart is showing a recent volume spike followed by three weeks of decreasing volume and spread. Price was very stretched above the 30-week moving average, so this pullback has certainly brought it closer to price. I’ve added $254.27 as a potential support area if the bear raid continues and depending on when it happens, the 30-wk MA could catch up to price and set up a favorable reward/risk scenario for bullish calls. Targets are still active at $328 and $391 in this mega trend channel.
IWM:
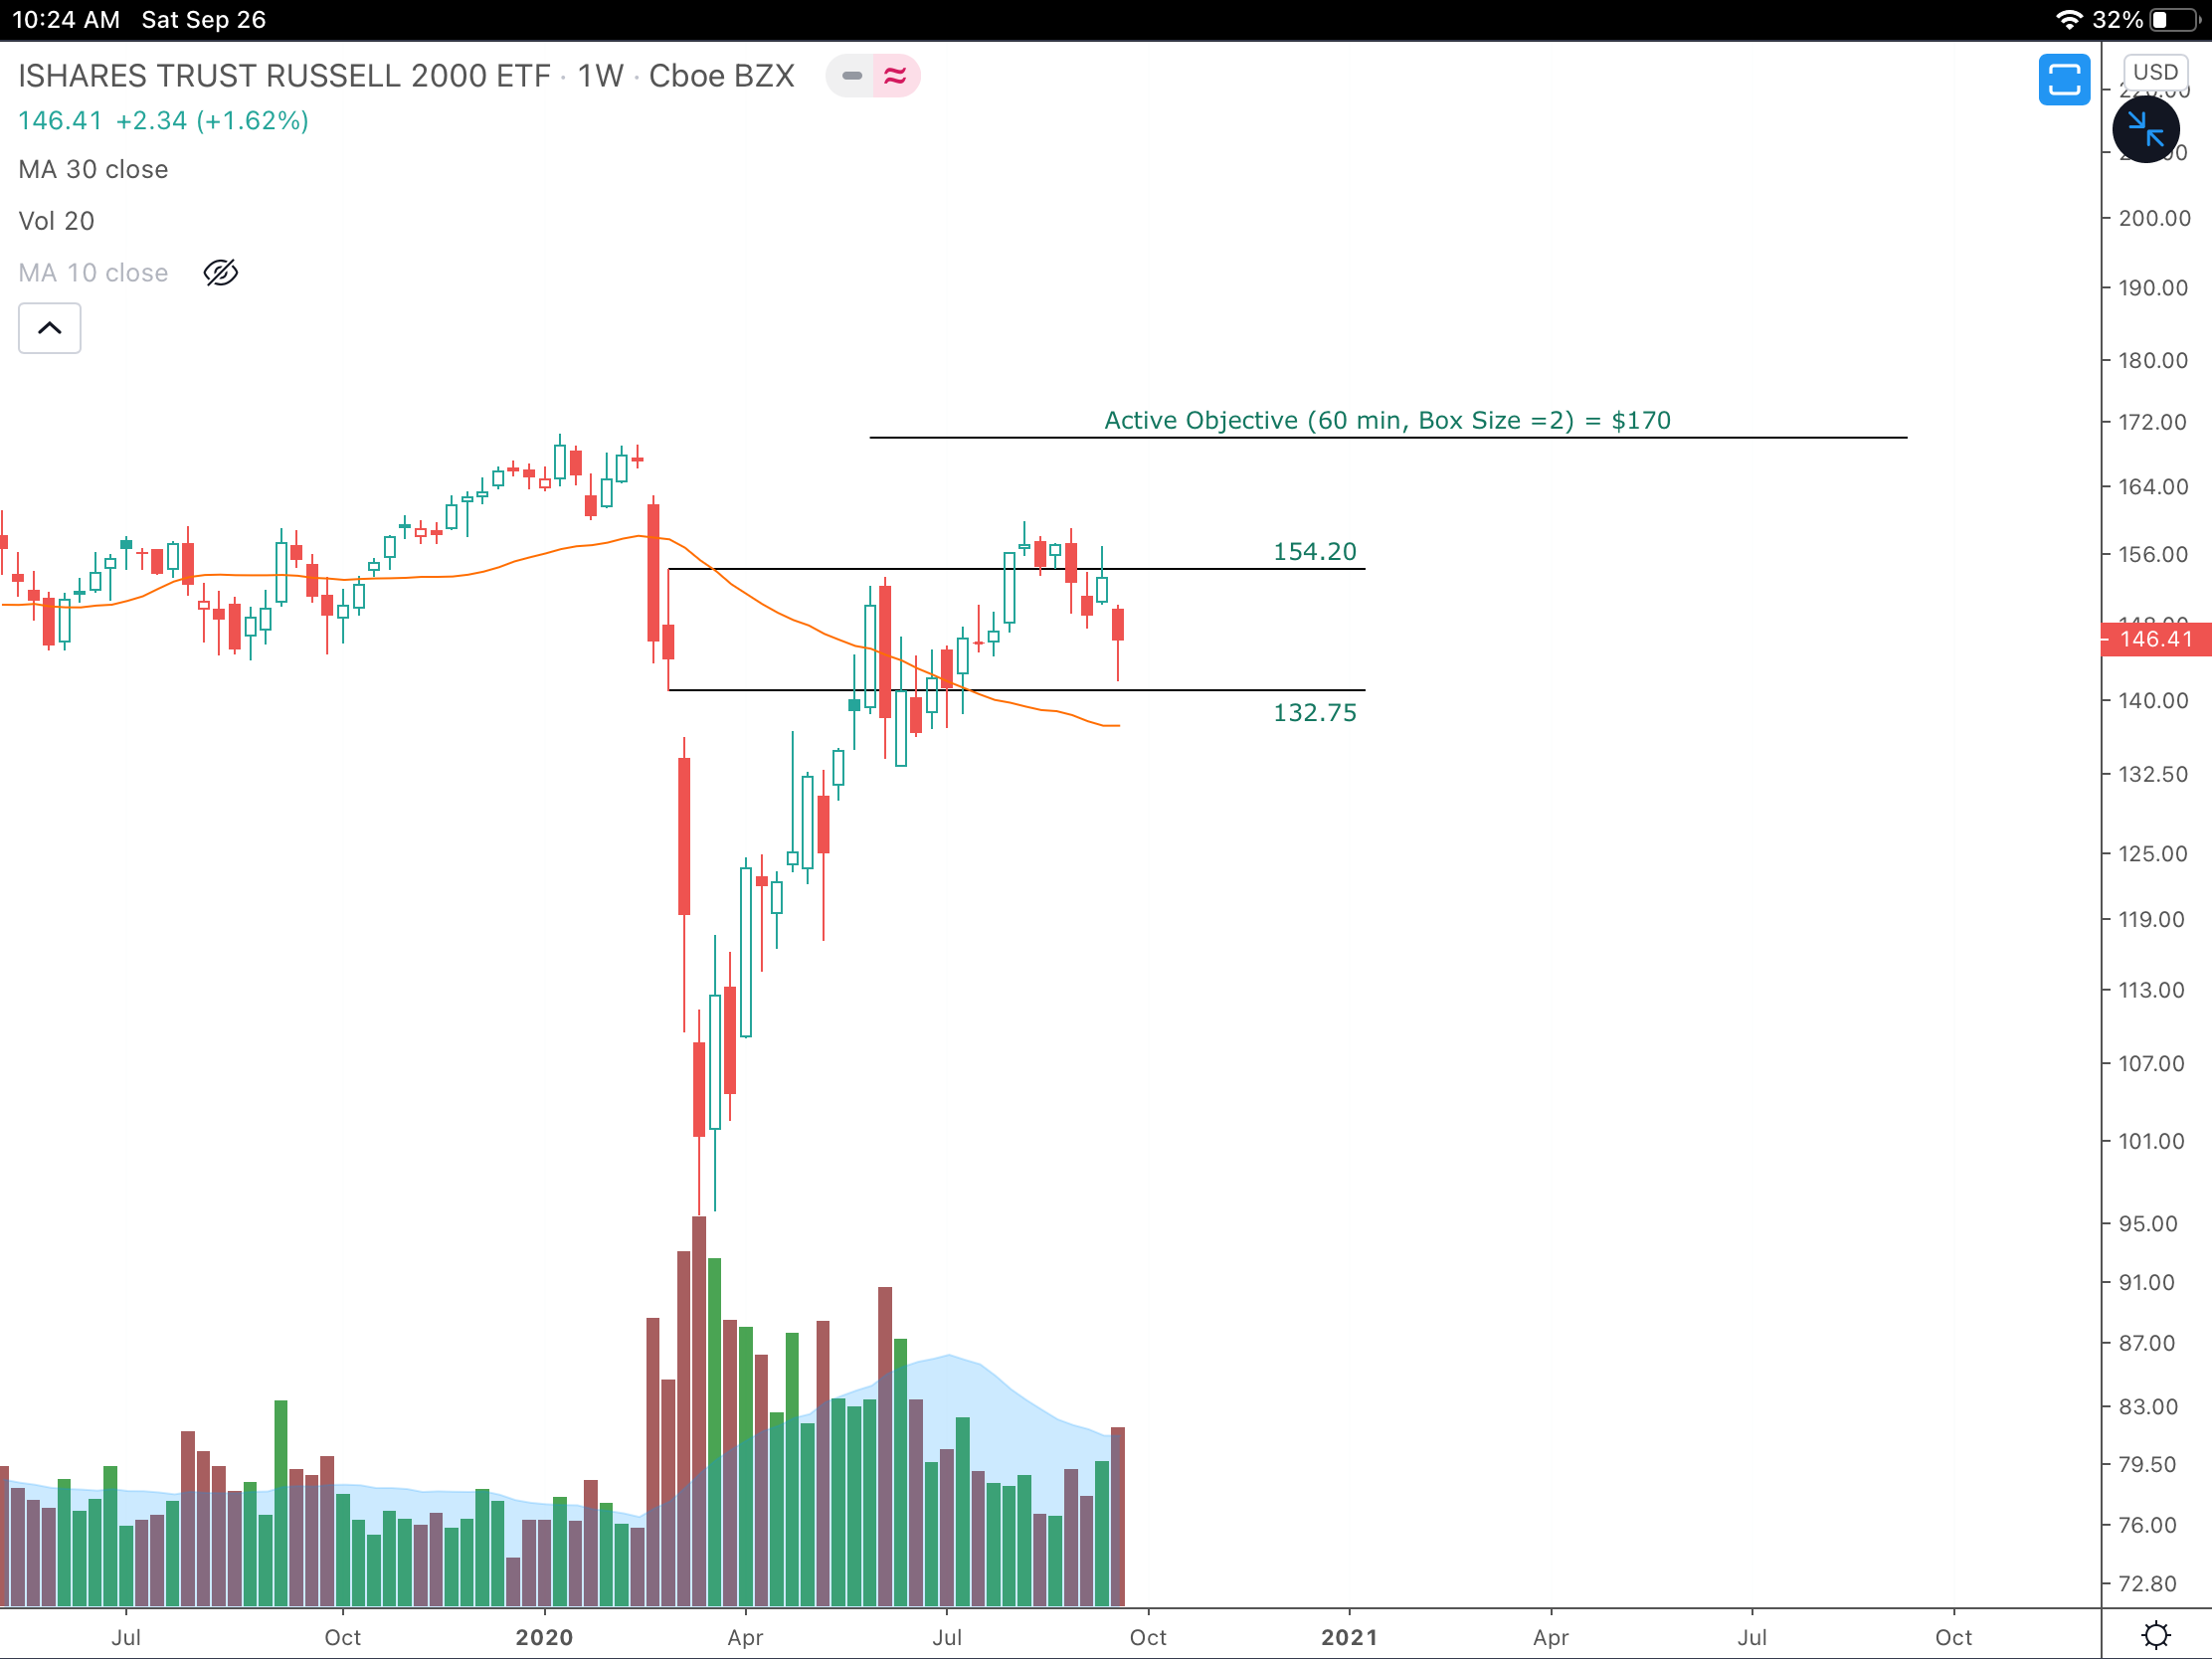
The decline on the 30-week moving average appears to be coming to an end and is now flattening. It appears to be about 1-2 weeks away from a pivot point where the moving average will be pulled higher (March lows were put in about 30 weeks ago). More importantly, PRICE has held above the 132.75 level, on high volume, with a long wick under the candle. The target of $170 which is right around the ATH level is about 16% higher. A few more weeks of chop around this range and I will have IWM calls near the top of my list of things to buy for Christmas.
TSLA
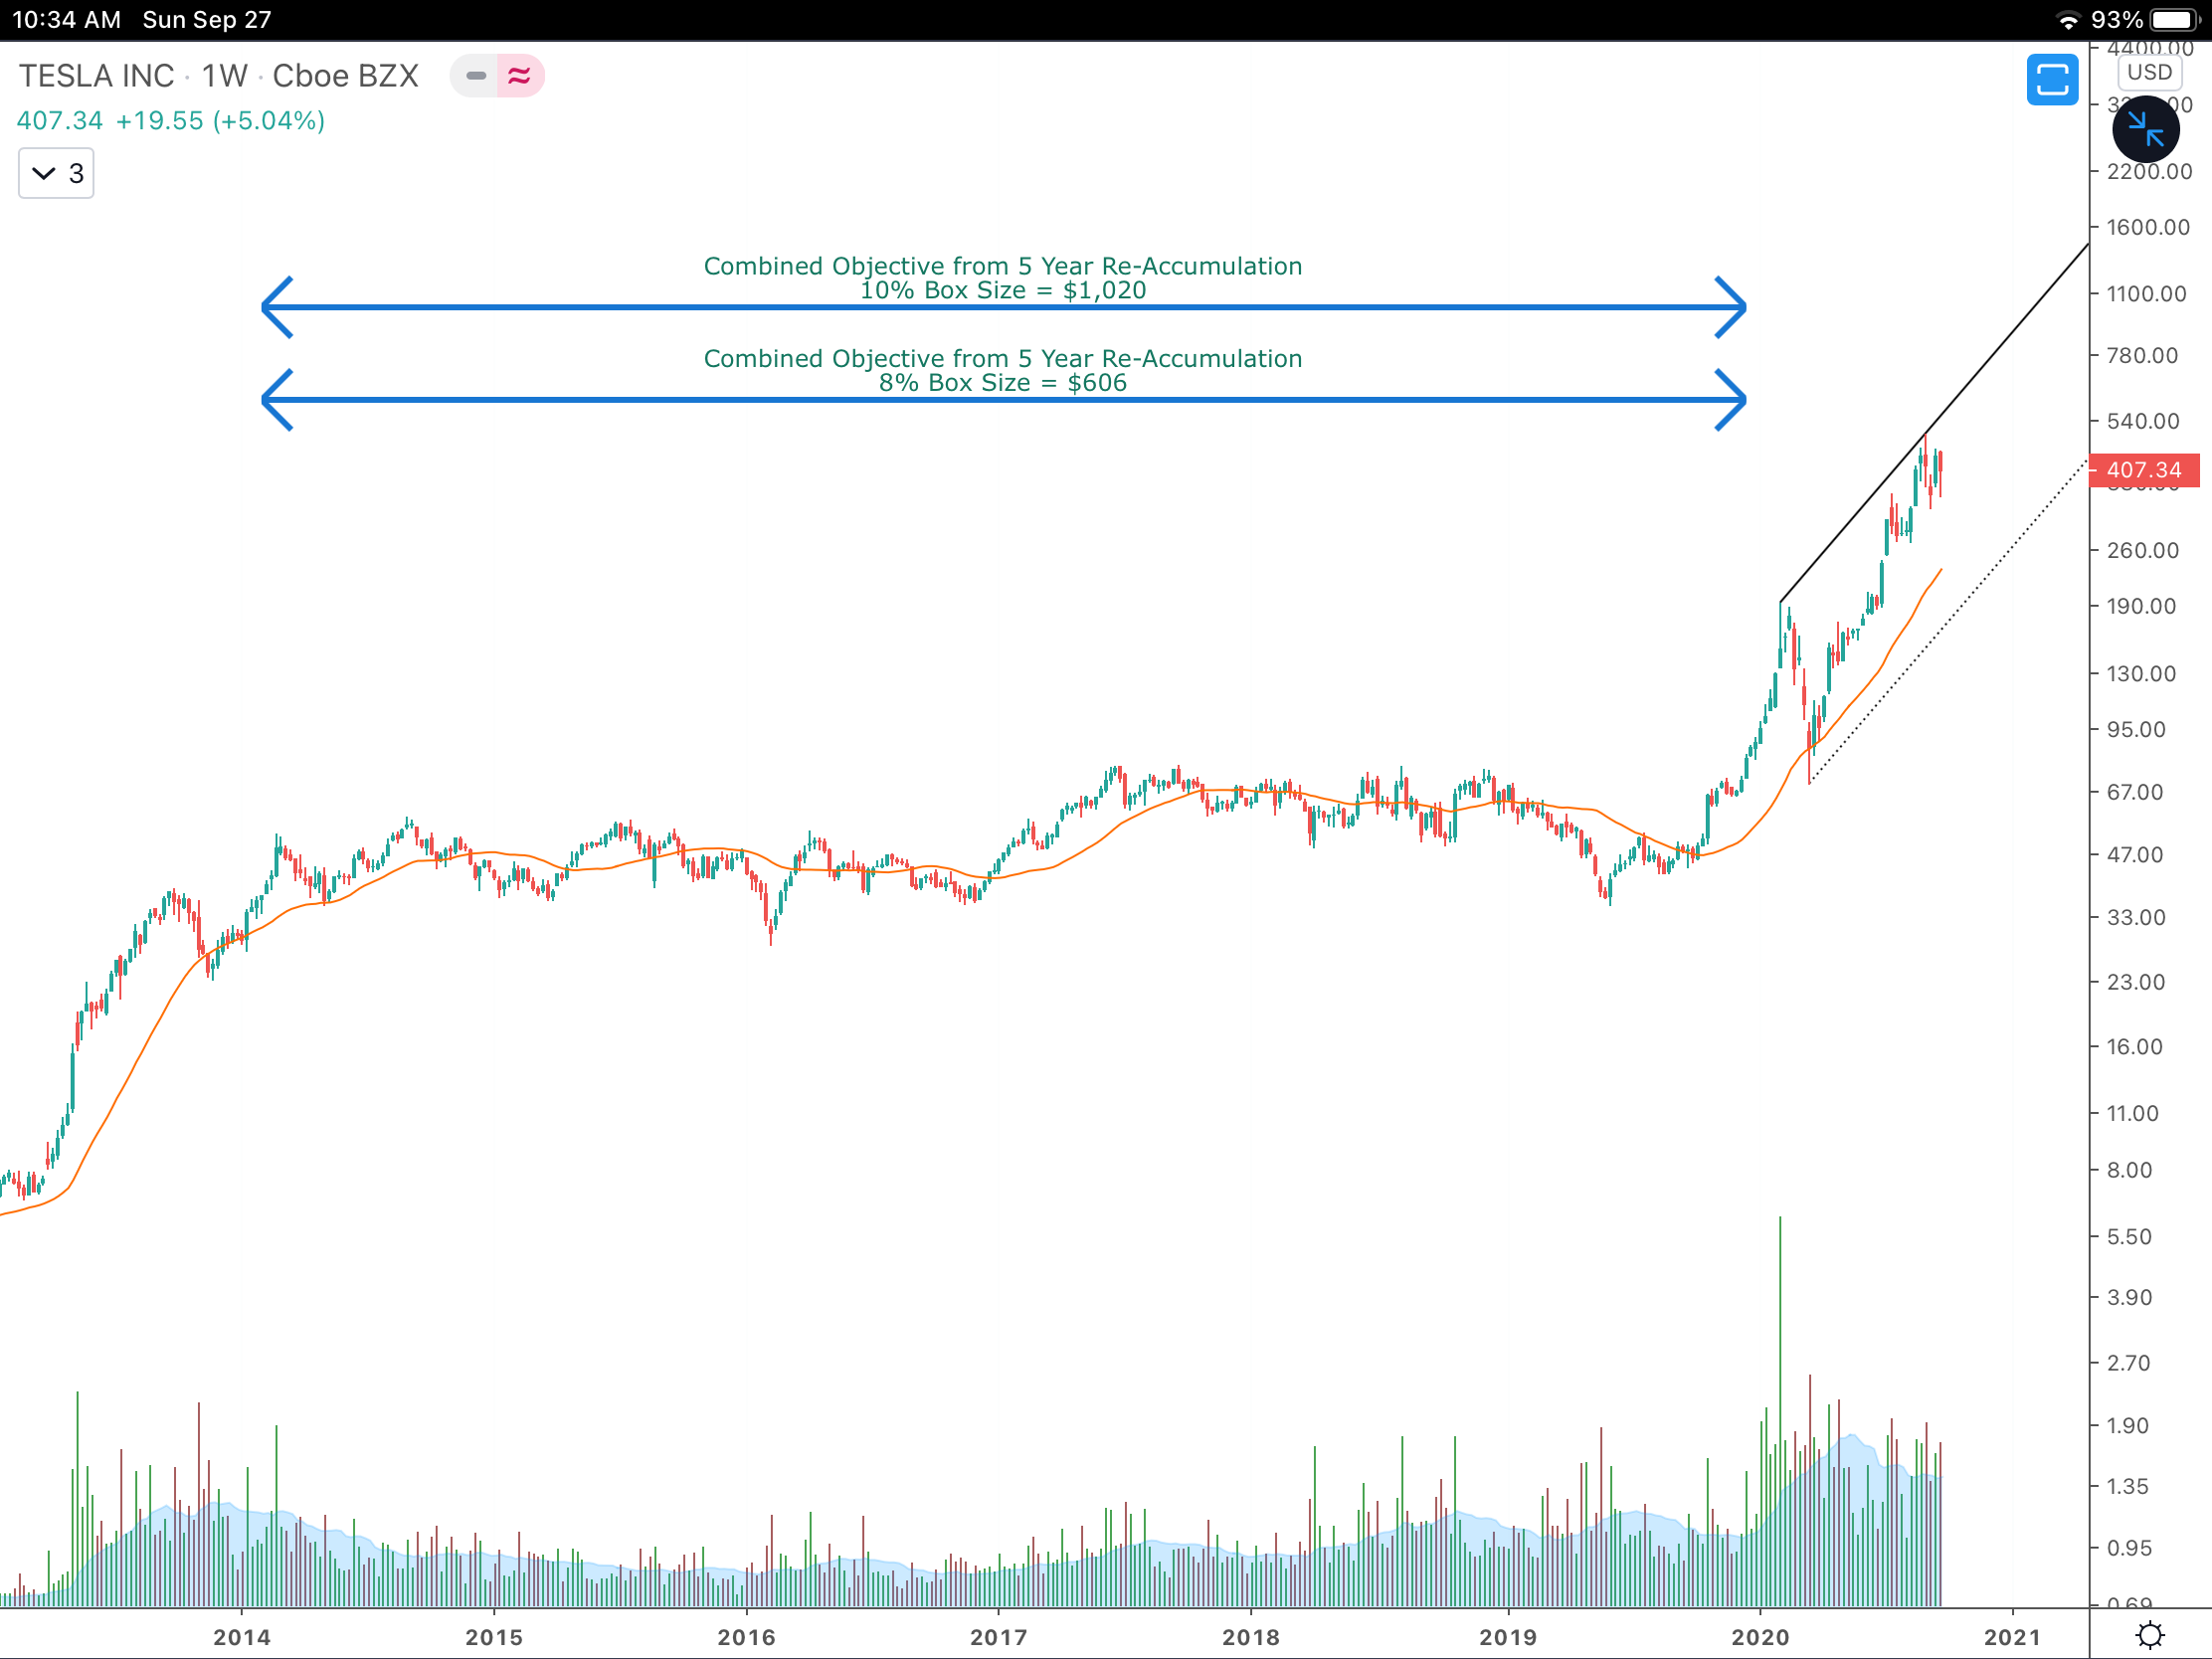
I’ve updated my weekly chart of TSLA to show the PnF objectives post-split. There are two major long term active targets at $606 and $1020, which represent 48% and 150% gains from Friday’s close, respectfully. I’ve shown a preliminary trend channel using the inverse trend line method as the demand line. After five years of consolidation (cause) price has responded by marking up very drastically (effect). The stride of this move is very strong and I will be looking to enter on any shake outs, perhaps on testing of the rising 30-wk moving average or pullbacks to recent support or even the demand line of the channel.
Price became very stretched from the demand line of this channel (drawn as a parallel line to the supply line), and if price were to move sideways in a chopping consolidation the demand line wouldn’t catch up until April. So while the stride of this move has been very strong on a weekly chart, there is possibility for a pause/pullback.
I love trading options on TSLA, it was a significant source of gains for me over the last 12 months by riding the high probability setups (pre-split prices from $160s to $900s and again from the $800s to the $1300s). These were multi-bagger option gains which allowed me to rotate into other strong names (AMZN, AAPL, SQ, NFLX) which all produced additional multi-bagger gains. These were all entered at the high probability setups. If you’ve ever been in a delta 25 option and held it until delta 90, you know what kind of gains are possible. If you haven’t experienced that, I hope you do!
So for any new options position I take in TSLA, at this point I would much rather wait for a higher probability setup. Perhaps this will be via a pullback to a key moving average, such as the 30-week, or the rising demand line of this channel. Patience is so important in the market, especially when playing with options. I am always reminded of the poker analogy Gary Biefeldt gave in Jack Schwager’s “Market Wizards”.
In the book, Biefeldt says about poker:
..you don’t just play every hand and stay through every card, because if you do, you will have a much higher probability of losing. You should play the good hands, and drop out of the poor hands, forfeiting the ante…When you feel the percentages are skewed in your favor - you raise and play that hand to the hilt.
If you apply the same principles of poker strategy to trading, it increases your odds of winning significantly. I have always tried to keep the concept of patience in my mind by waiting for the right trade, just like you wait for the percentage hand in poker. If a trade doesn’t look right, you get out and take a small loss; it’s precisely equivalent to forfeiting the ante by dropping out of a poor hand in poker. On the other hand, when the percentages seem to be strongly in your favor, you should be aggressive and really try to leverage the trade similar to the way you raise on the good hands in poker.
Have the patience to wait for the right trade to come along!
Have a great week,
Trace