

Oil & Energy

This is a long overdue post, and one that I’ve been wanting to get out for a few weeks now. There are some noteworthy things in the monthly oil and energy charts that I’d like to share. First I will start with oil (US Crude) and then show the energy charts.
We all know what a crazy year 2020 was, one that saw WTI futures go negative in April. If on April 20th, 2020 you had told someone oil would be trading at $50 within a year they probably would have scoffed or laughed at you. I recall that day (or the next), one Twitter blue checkmark profile, who tweets about finance with a huge audience (almost half a million followers), said we would need to prepare for -$100 oil. I believe that tweet marked the bottom in oil futures. With all of the global shutdowns combined with the Saudi oil price cuts (March) the sentiment for oil was historically low at that time. But that was then, and here we are now in 2021. The reason I mention all of this is because sometimes major bottoms coincide with extreme pessimism - which is what we saw.
Oil futures went above $50 today and the long term charts are looking like they are setting up for higher. Here’s a monthly candle chart I’ve shared previously. This chart uses pitchforks in an analog to the late 80’s through late 90’s era:
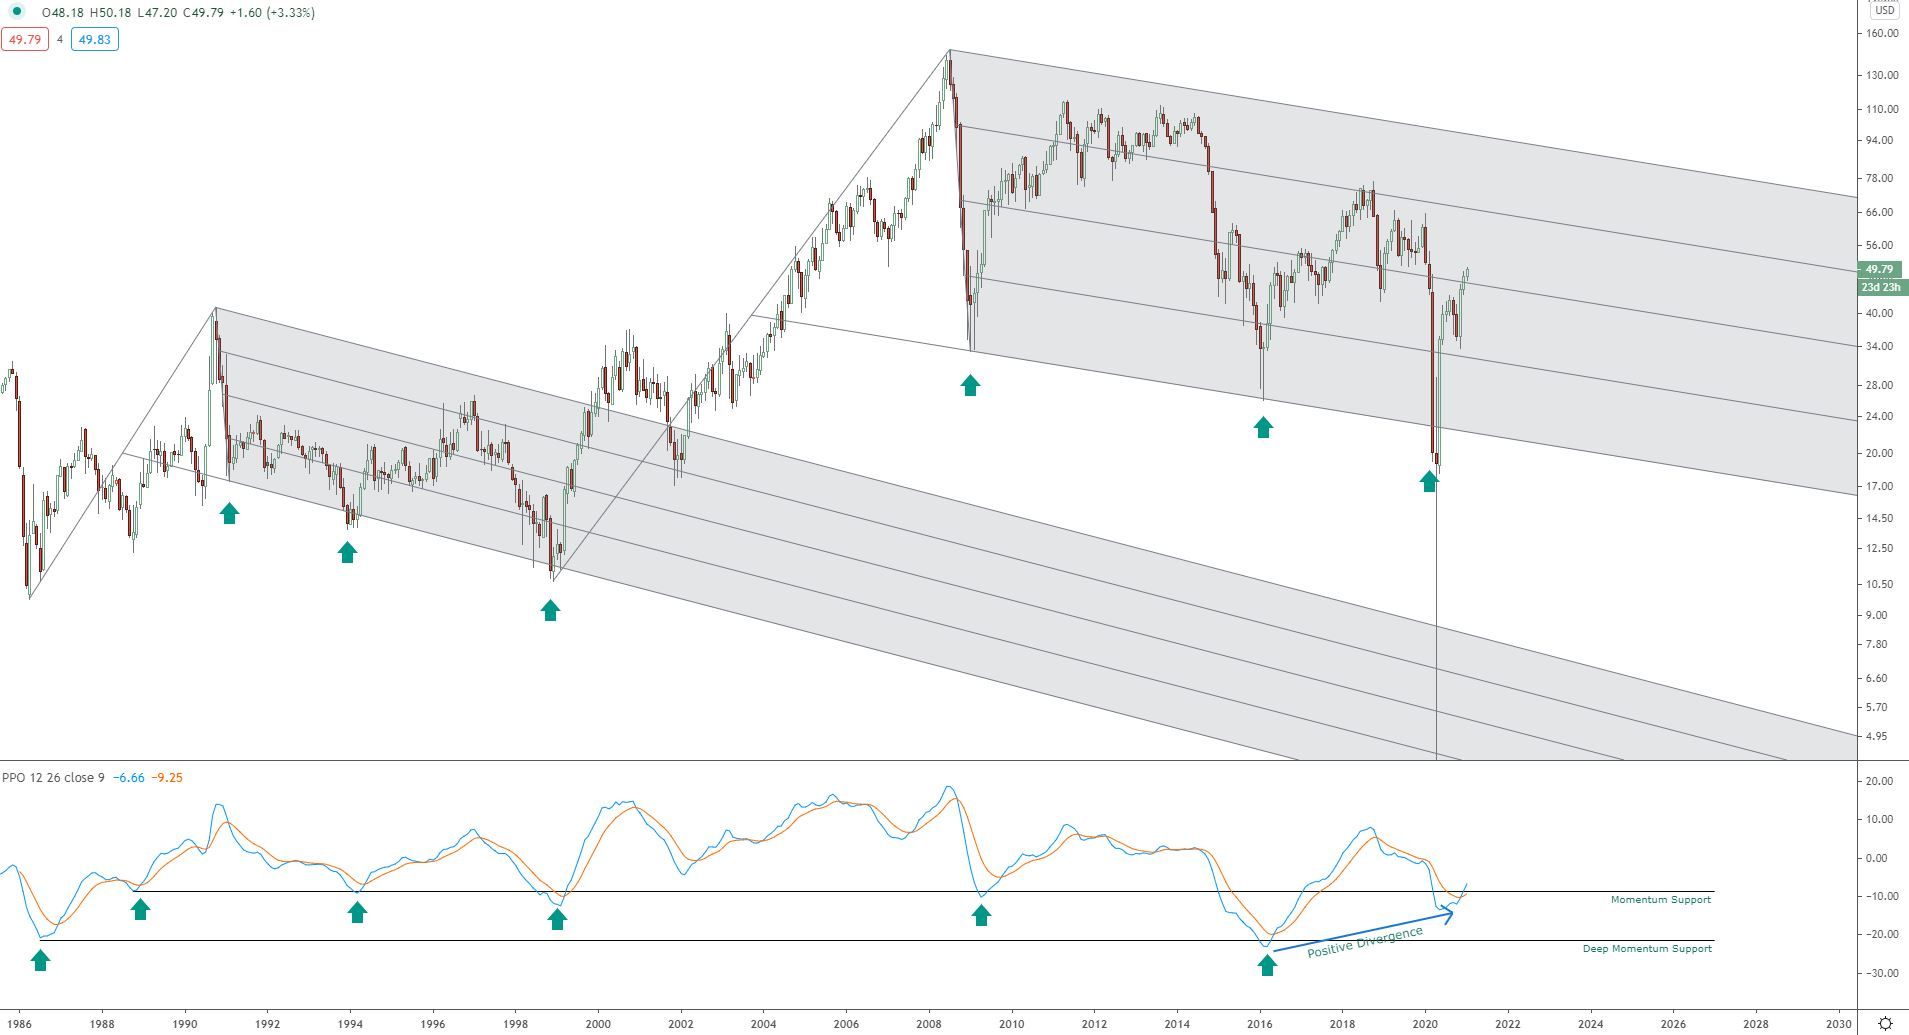
There’s a few things I want to point out here:
The pivot points in price throughout the 90’s all occurred at lower lows until the 3rd tag of the pitchfork support line. Then it exploded higher in a very impressive rally lasting almost a decade, which would reward major oil company XOM with the S&P’s largest market cap. Compare that to the current pitchfork, which had a similar pattern until it saw the bottom fall out on the 3rd tag of the PF support (April 2020). But what I’m focused on now is the rapid recovery in price and how the pattern analog is mostly intact.
Price has risen from those 2020 lows (let’s call it $0) to $50 in just over 6 months. This type of price move has never happened before, not even during the 2007-2008 exhaustion rally that led to the 2008 buying climax with oil.
The momentum indicator (bottom of chart) is curling up and has put in a bullish crossover from historical support levels. This momentum crossover also occurred with a very solid positive divergence. The “energy” appears to be very coiled now.
As they say: “A rising tide lifts all boats”. I believe a rising oil price will naturally lift many energy companies. There has been so much destruction to the oil & energy industries over the last 12 years or so, I believe the companies that have managed to survive will come out very strong and their share prices should see solid returns. Nothing is guaranteed, and I’m not saying that XOM will return to the largest market cap again - BUT - the potential is there for a major leg up in oil and energy equity prices. If prices in a sector are setting up for a multi-year, even decade long outperformance, I definitely want to be in that party. As with any chart setup, the price advance could fail to materialize and proper risk management is imperative.
Here is a long term look at the weekly chart of the Energy sector, going back to the late 90’s:
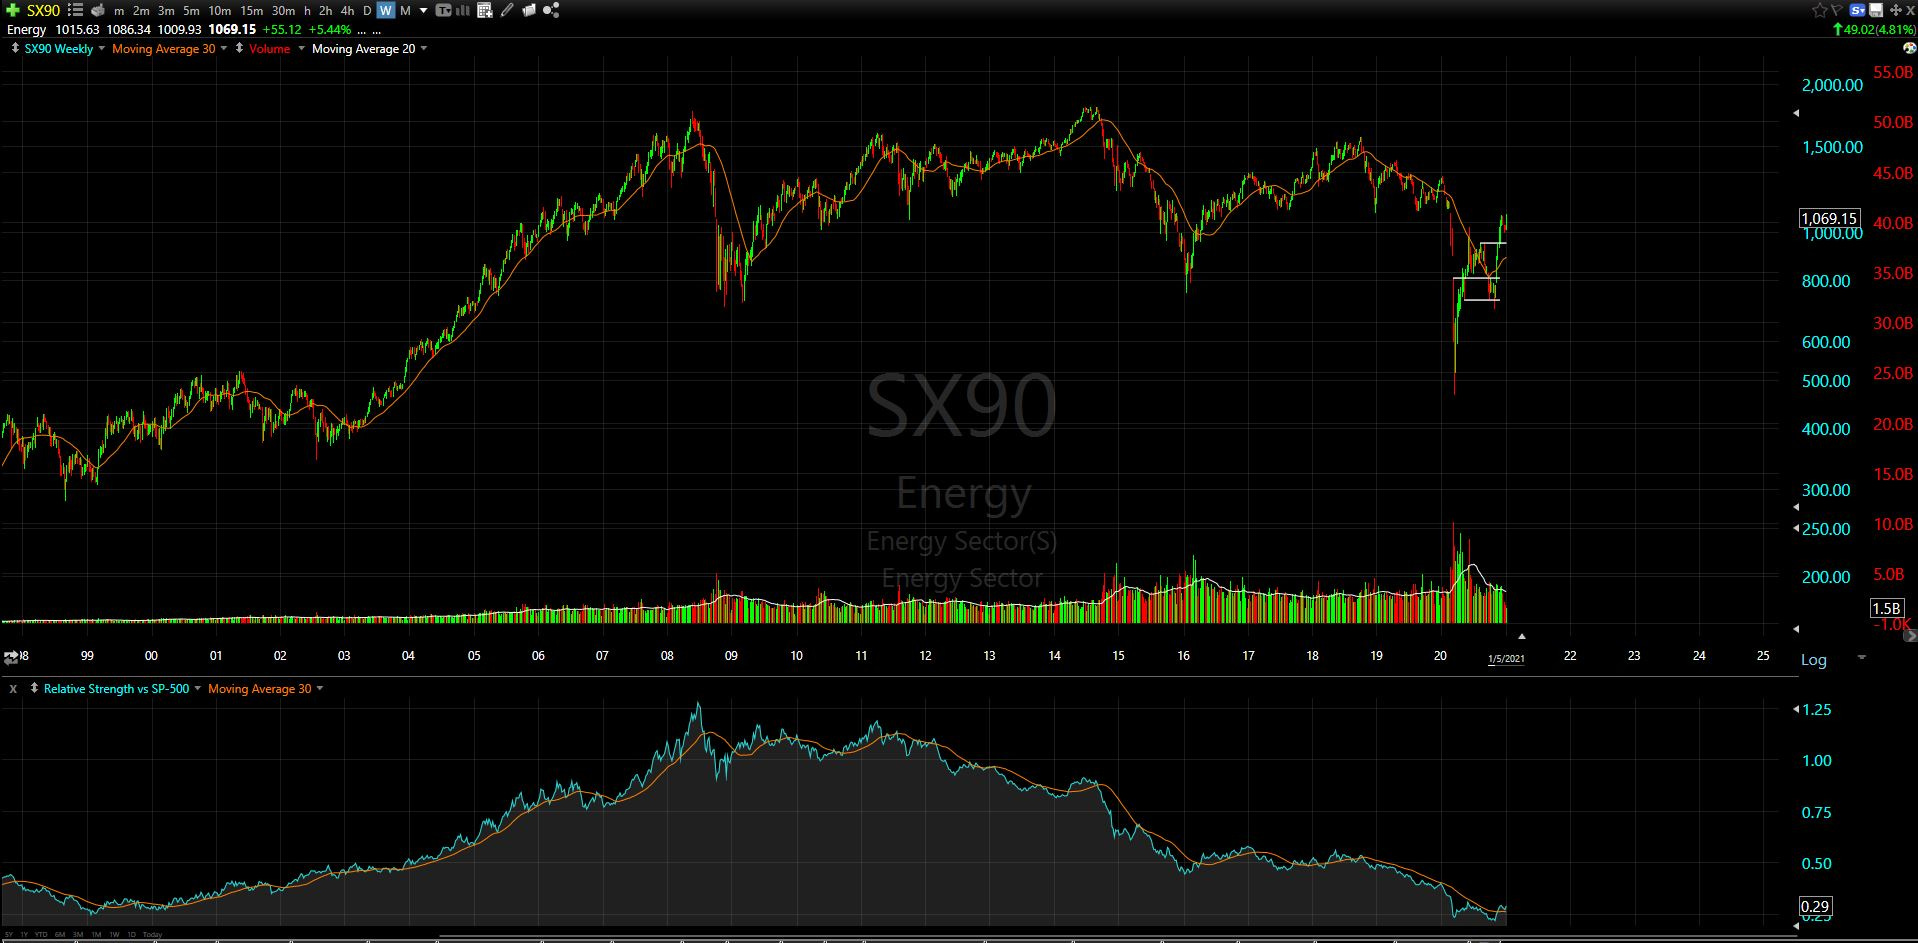
I’ve shown the relative strength at the bottom, and what I want to point out is where it has started to curl up from. If you look to the far left in ‘99 you can see the relative strength begin to curl up around the 0.25 level. This was a year before the euphoria of the dotcom era highs in 2000.
Look how the relative strength outperformed SPX for nearly 10 years from 1999 to mid-2008
Below is the monthly XLE chart showing some major long term levels:
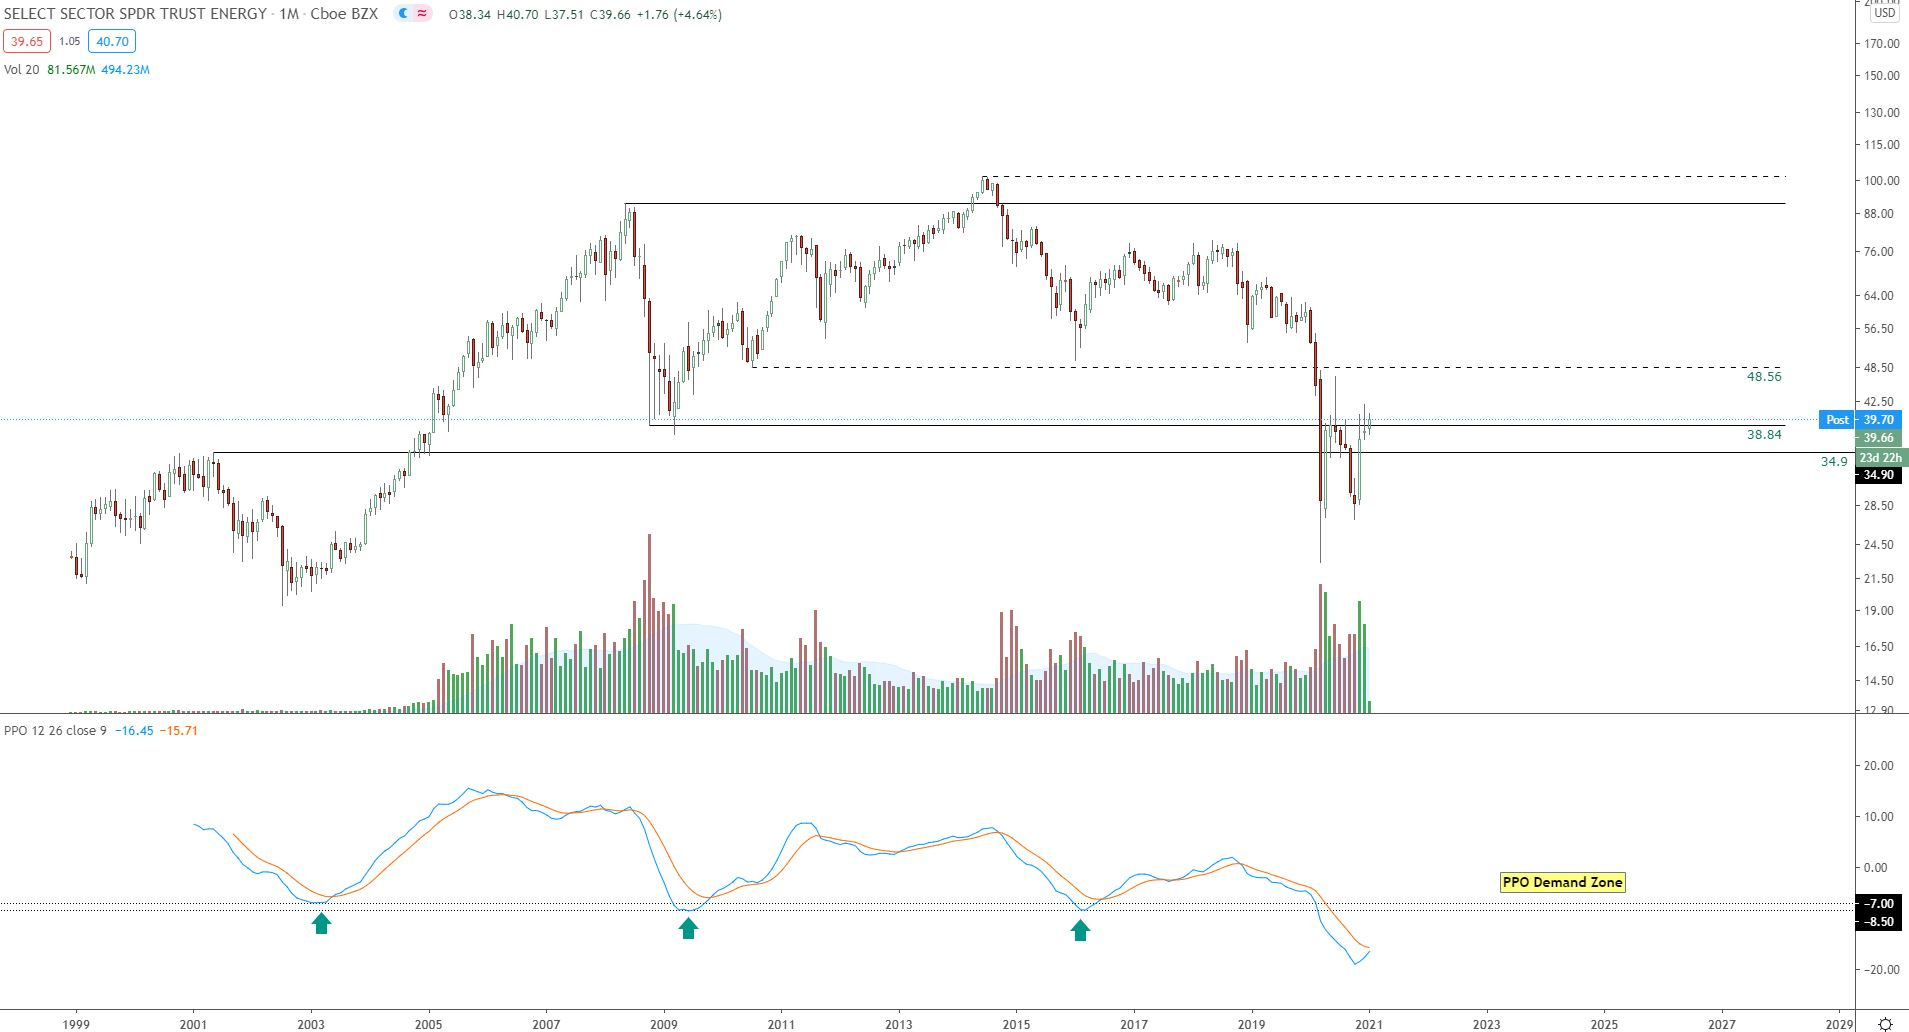
This monthly chart (going back to the 90’s) of the energy ETF shows how deep the momentum has fallen.
As price grinds its way back up above the 2008 selling climax ($38.84), the momentum (bottom of chart) is setting up for its deepest momentum crossover ever.
I want to be long XLE (and the energy leaders) with price above the $38.84 level.
Here is the weekly chart:
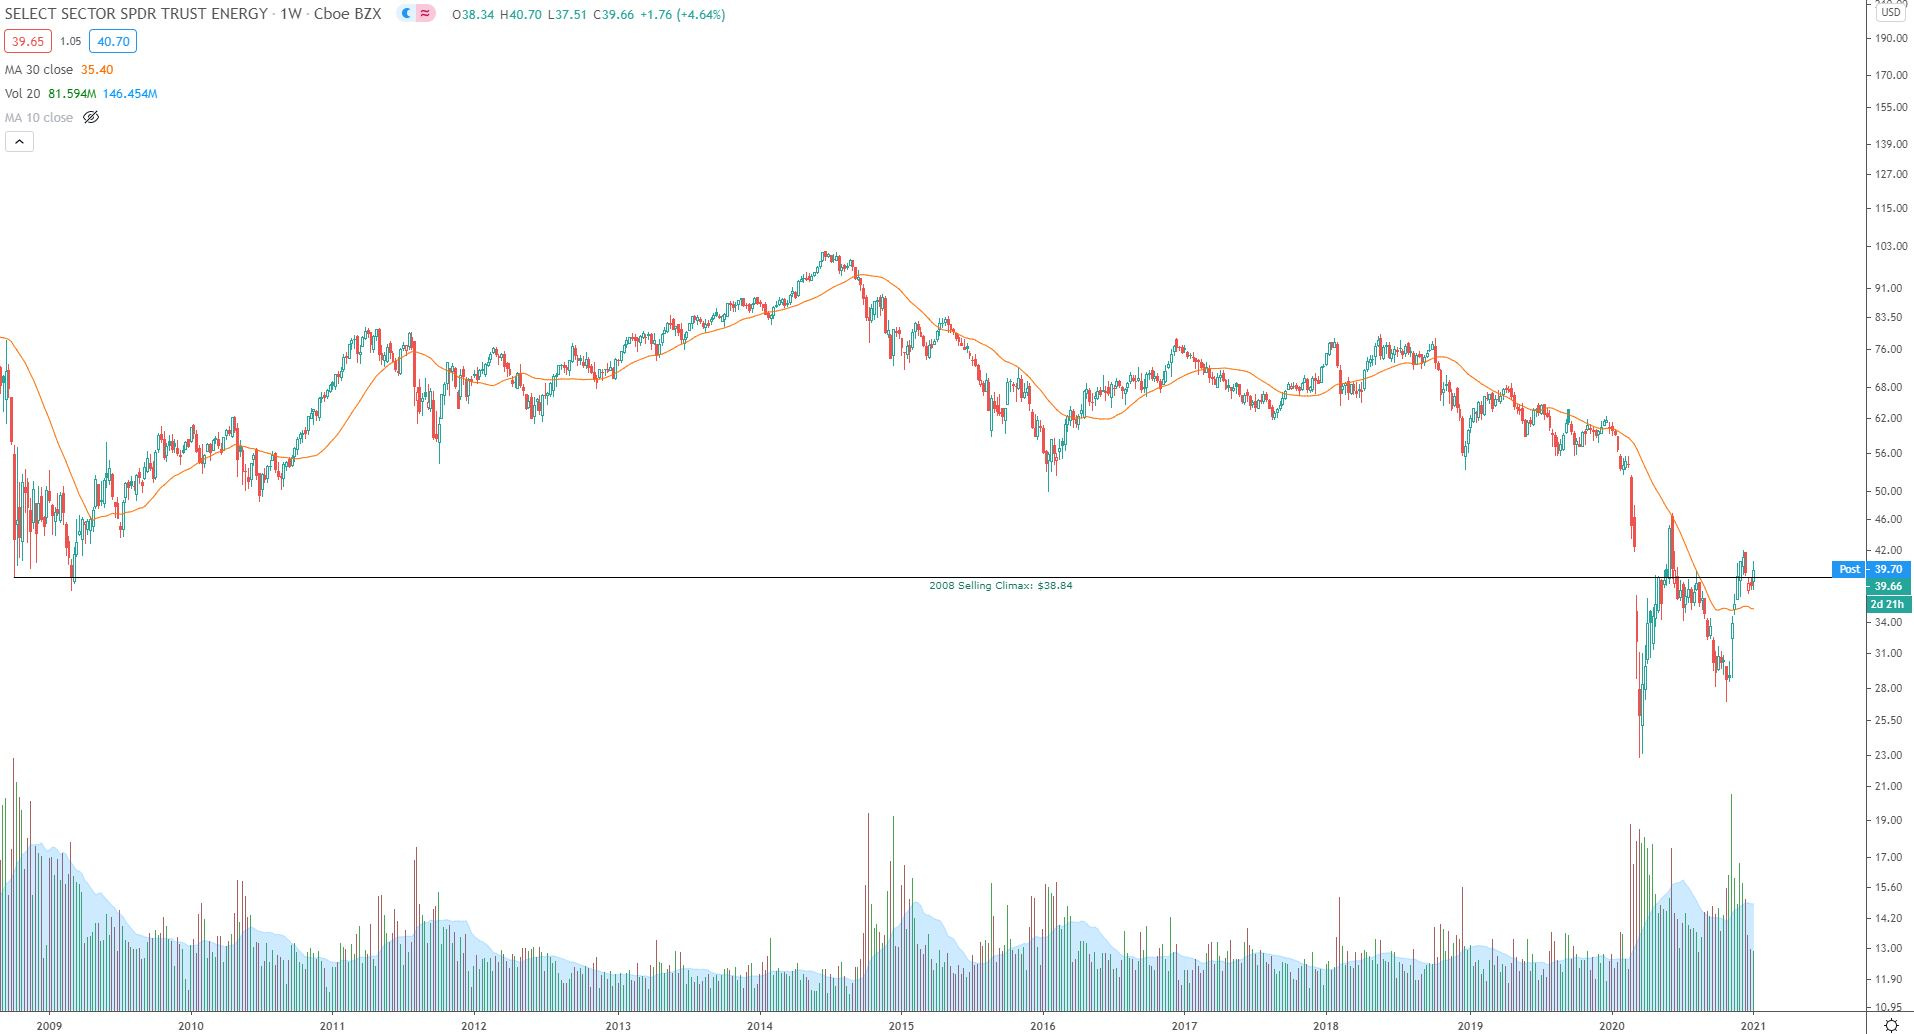
Price is working on its 8th consecutive weekly close above the 30-week moving average. With a few more closes above the $38.84 level, this key moving average will start to curl up and set up a very enticing reward/risk scenario
Just like a mega oil barge turning a corner and gaining momentum, it appears like the oil and energy charts are turning a corner now and starting to pick up the momentum.
One area of the industry that I think is unknown by many right now is the bitcoin mining effect. It takes a lot of energy to be a miner on the network, and there are oil & gas companies choosing to mine bitcoin instead of flaring their hydrocarbons. It seems like a perfect match to me and I think when we look back a few years from now it will seem obvious. With a rising bitcoin price, the miner reward will only increase. There are “bitcoin batteries” helping to power the Texas grid now. There are countries like Venezuela and Iran using their “cheap” energy to mine bitcoin. It is happening. People around the world are waking up and I wholeheartedly believe there will be a new demand vector for energy in the coming years. I don’t have any data right now, and I doubt it’s much to move the needle at the moment, but I predict bitcoin will be an energy sector story in the years to come.
As a chartist I don’t really care what the reason is for the oil & energy advance. Whether it be a new vaccine, travel increasing, bitcoin mining, etc. it doesn’t matter to me. It’s fun to speculate, but in the end all that matters is the price on the chart so that’s what I’ll stick with.
I am busy looking through the leaders in the energy sector for additions to the portfolio, and am also sizing up some leap calls in the XLE & XOP ETFs (or one of their leading names). The industries within the sector showing the most strength right now are:
Oil & Gas E&P
Oil & Gas Midstream
Oil & Gas Equipment & Services
There’s also a name in the Oil & Gas Refining & Marketing industry (REGI - Renewable Energy Group, Inc) that I’ve had my eye on for a while and for some reason haven’t pulled the trigger on yet. REGI saw a 50% decline in Feb-March but has since risen 4.5x from those lows.
After a six year base, this chart has already put in a 7x move.
But with a target of $292, there is still plenty of gas left in the tank
If I take any positions, whether it be a position for the portfolio or a dated call option, I’ll be sure to send out the updates as they are taken.
Have a great night,
Trace