The much-talked-about “quad witching” OPEX event is in the books, and the markets seem to have survived. Hyped-up events like these are often red herrings, and what matters is the follow-through or lack thereof.
As I’ll show below (SPY daily chart), the previous three monthly OPEX events have all been within days of the swing lows, and this time around appear to have put in a similar price/volume profile.
As with the previous events, I’ll watch how the market responds to the pullback on high volume. Typically in uptrends, these high-volume candles result in lows.
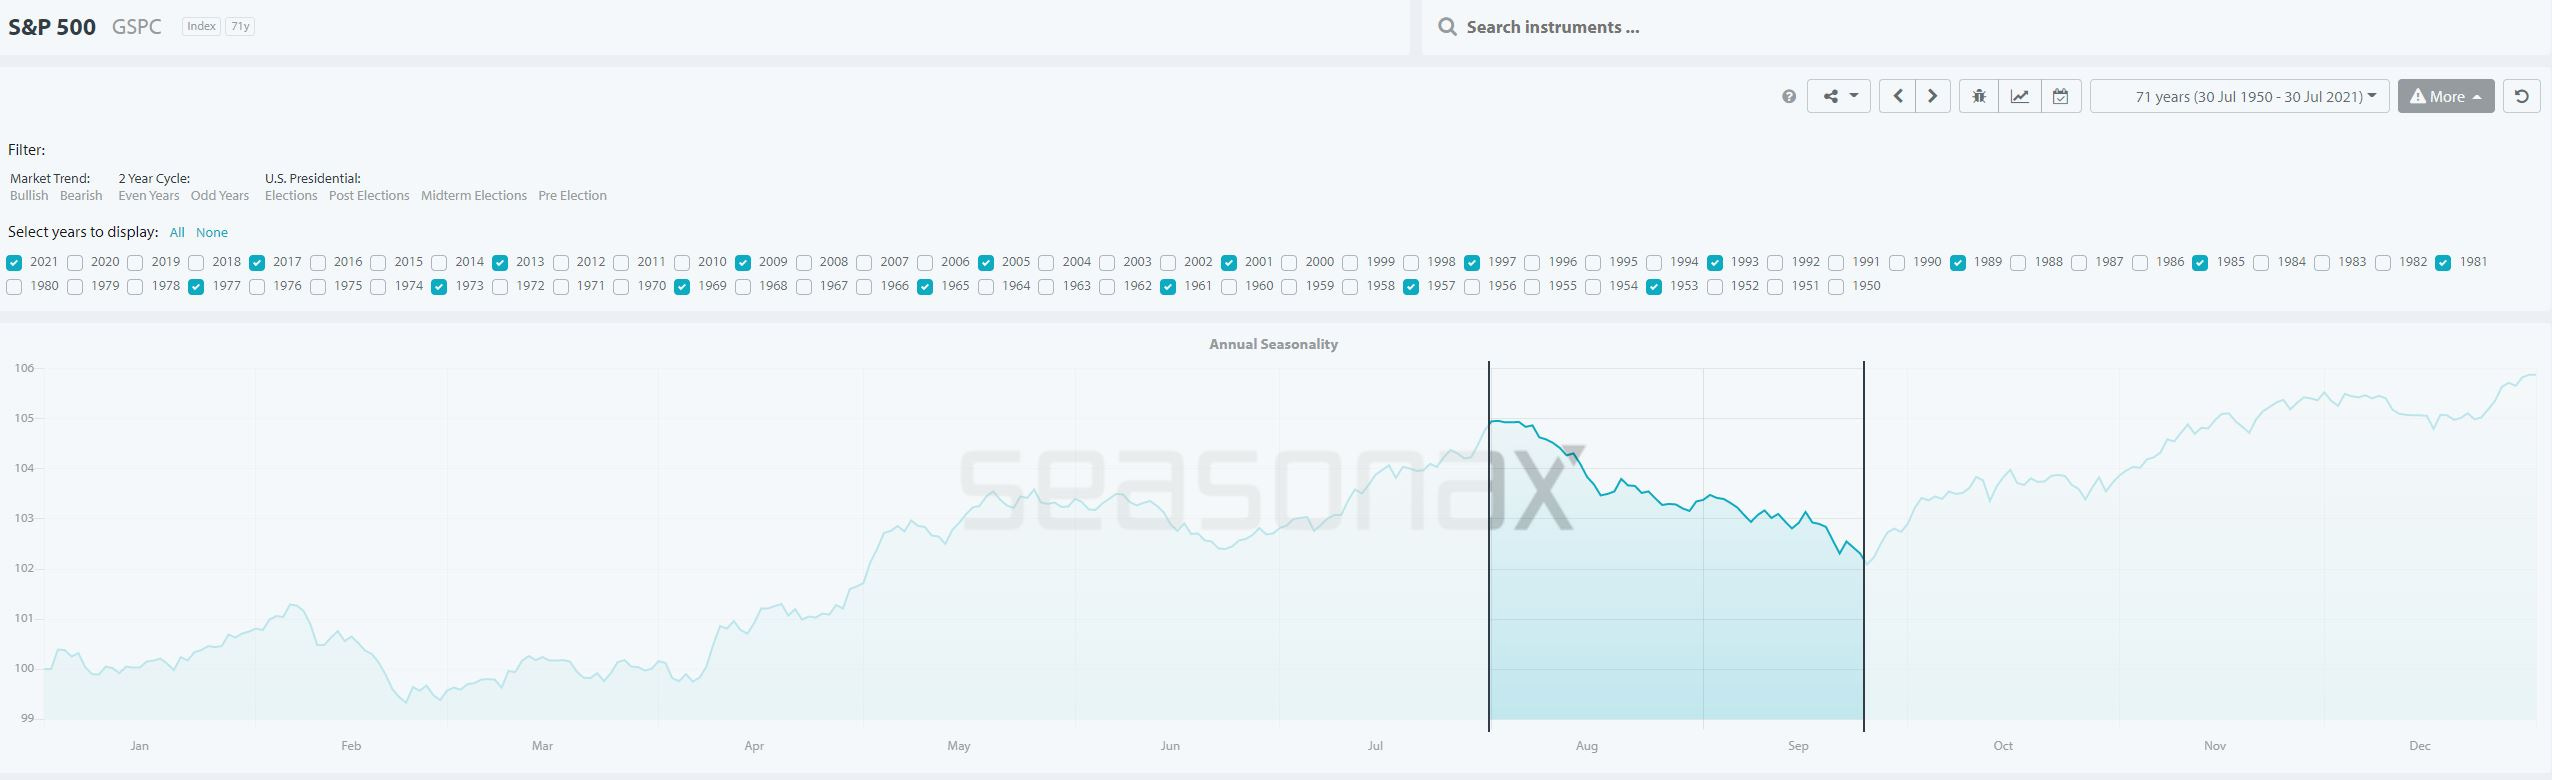
I’m also looking forward to the bearish seasonal period coming to an end. As noted in the August 1st Market outlook, the historical returns (for post-election years) between August 1 - Sept 25th haven’t been the best for the bulls:
As mentioned earlier, the month of August (post-election years) has been brutal. This isn’t a fun period for the bulls, historically.
I’ve highlighted the period between Aug 1 - Sept 25, which has a historical return of -2.88%, which annualized to -17.7%
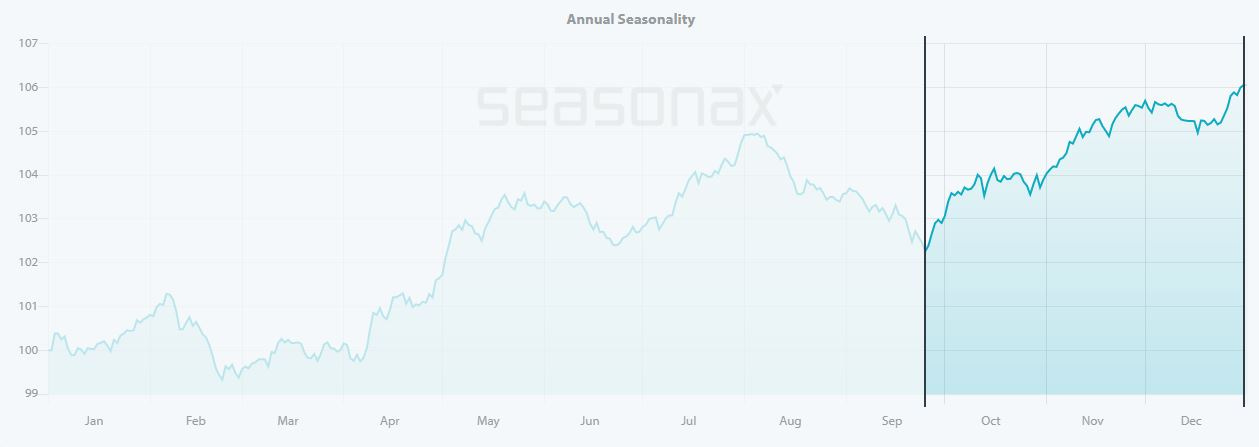
However, beyond Sept. 25 into year-end, the historical returns have been rewarding for the bulls (+4% average return).
SPX Seasonality:
S&P500 Seasonality, Post-Election Years. Sept. 25 - Dec. 31 Highlighted.
NDX Seasonality:
I’m even more excited about the Nasdaq100 returns from Sept. 20 into year-end:
Nasdaq100 Seasonality, Post-Election Years. Sept. 20 - Dec. 31 Highlighted.
The returns from Sept. 20 through Dec. 31 have had an impressive 7.91% average return. I’ll take that!
Weekly Charts:
On the weekly charts, I still don’t see much damage in the four majors. IWM is the only major to still trade below its respective 30-week SMA, but there are some subtle clues in the tape that things could be poised for a change (as I’ll show later - See IWM daily chart).
SPY & DIA are now both below their 10-week SMAs, and QQQ is holding firm above both the 10 & 30 weeks.
SPY:
The weekly channel remains intact.
QQQ:
Consolidating just below a long term target
DIA:
Still in that weekly channel, with the demand line catching up.
IWM:
Still rangebound, with coiled potential energy for a significant move in either direction
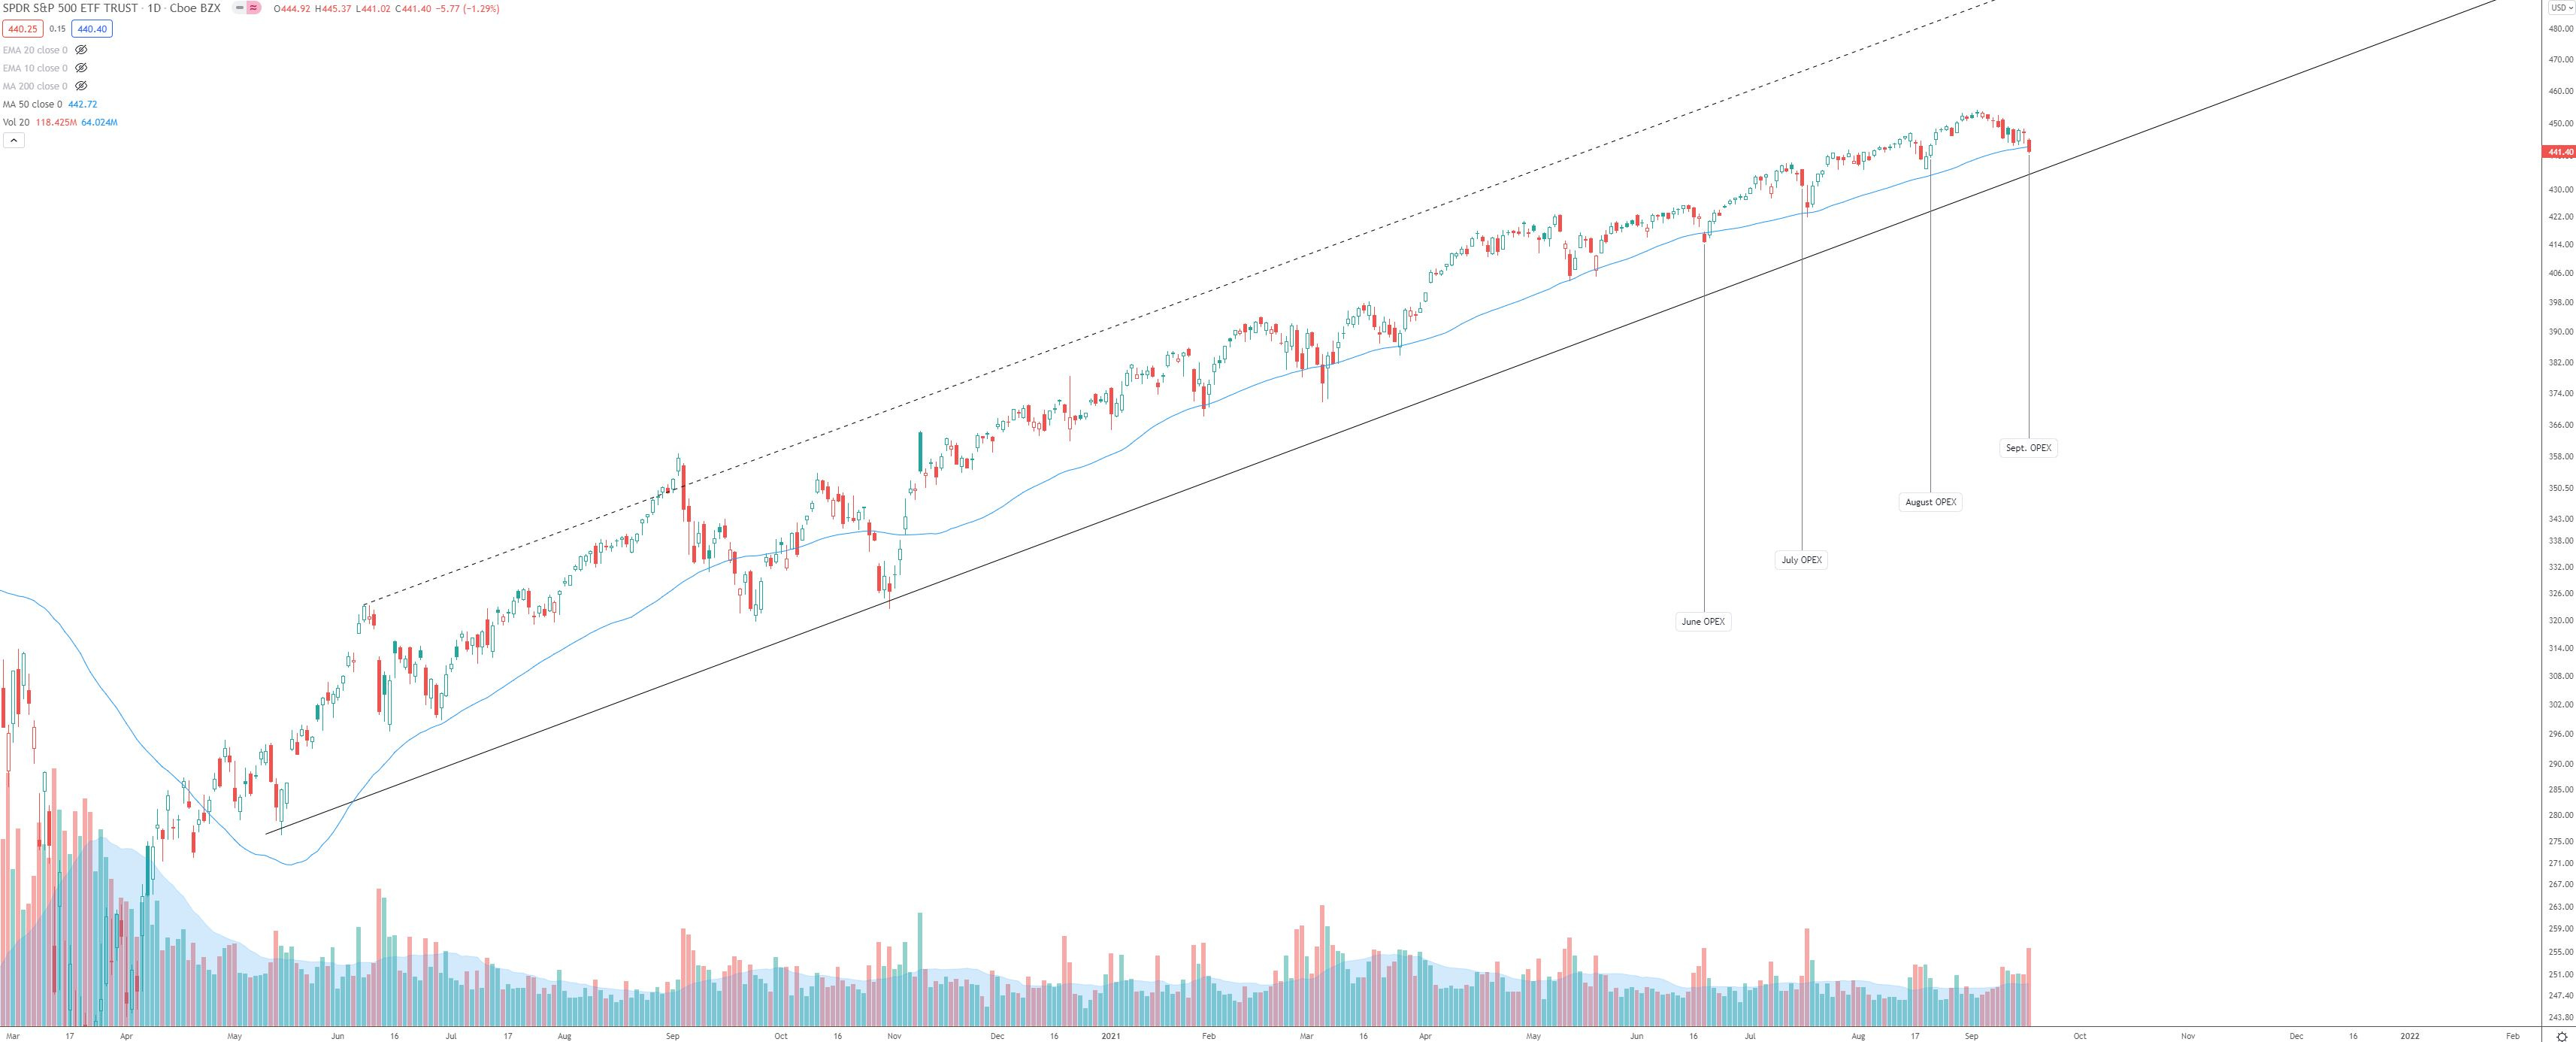
Daily Charts:
SPY:
The four recent monthly OPEX events are shown
Of the last three events (June, July, August), June appears to be closest in volume and price to this most recent September event.
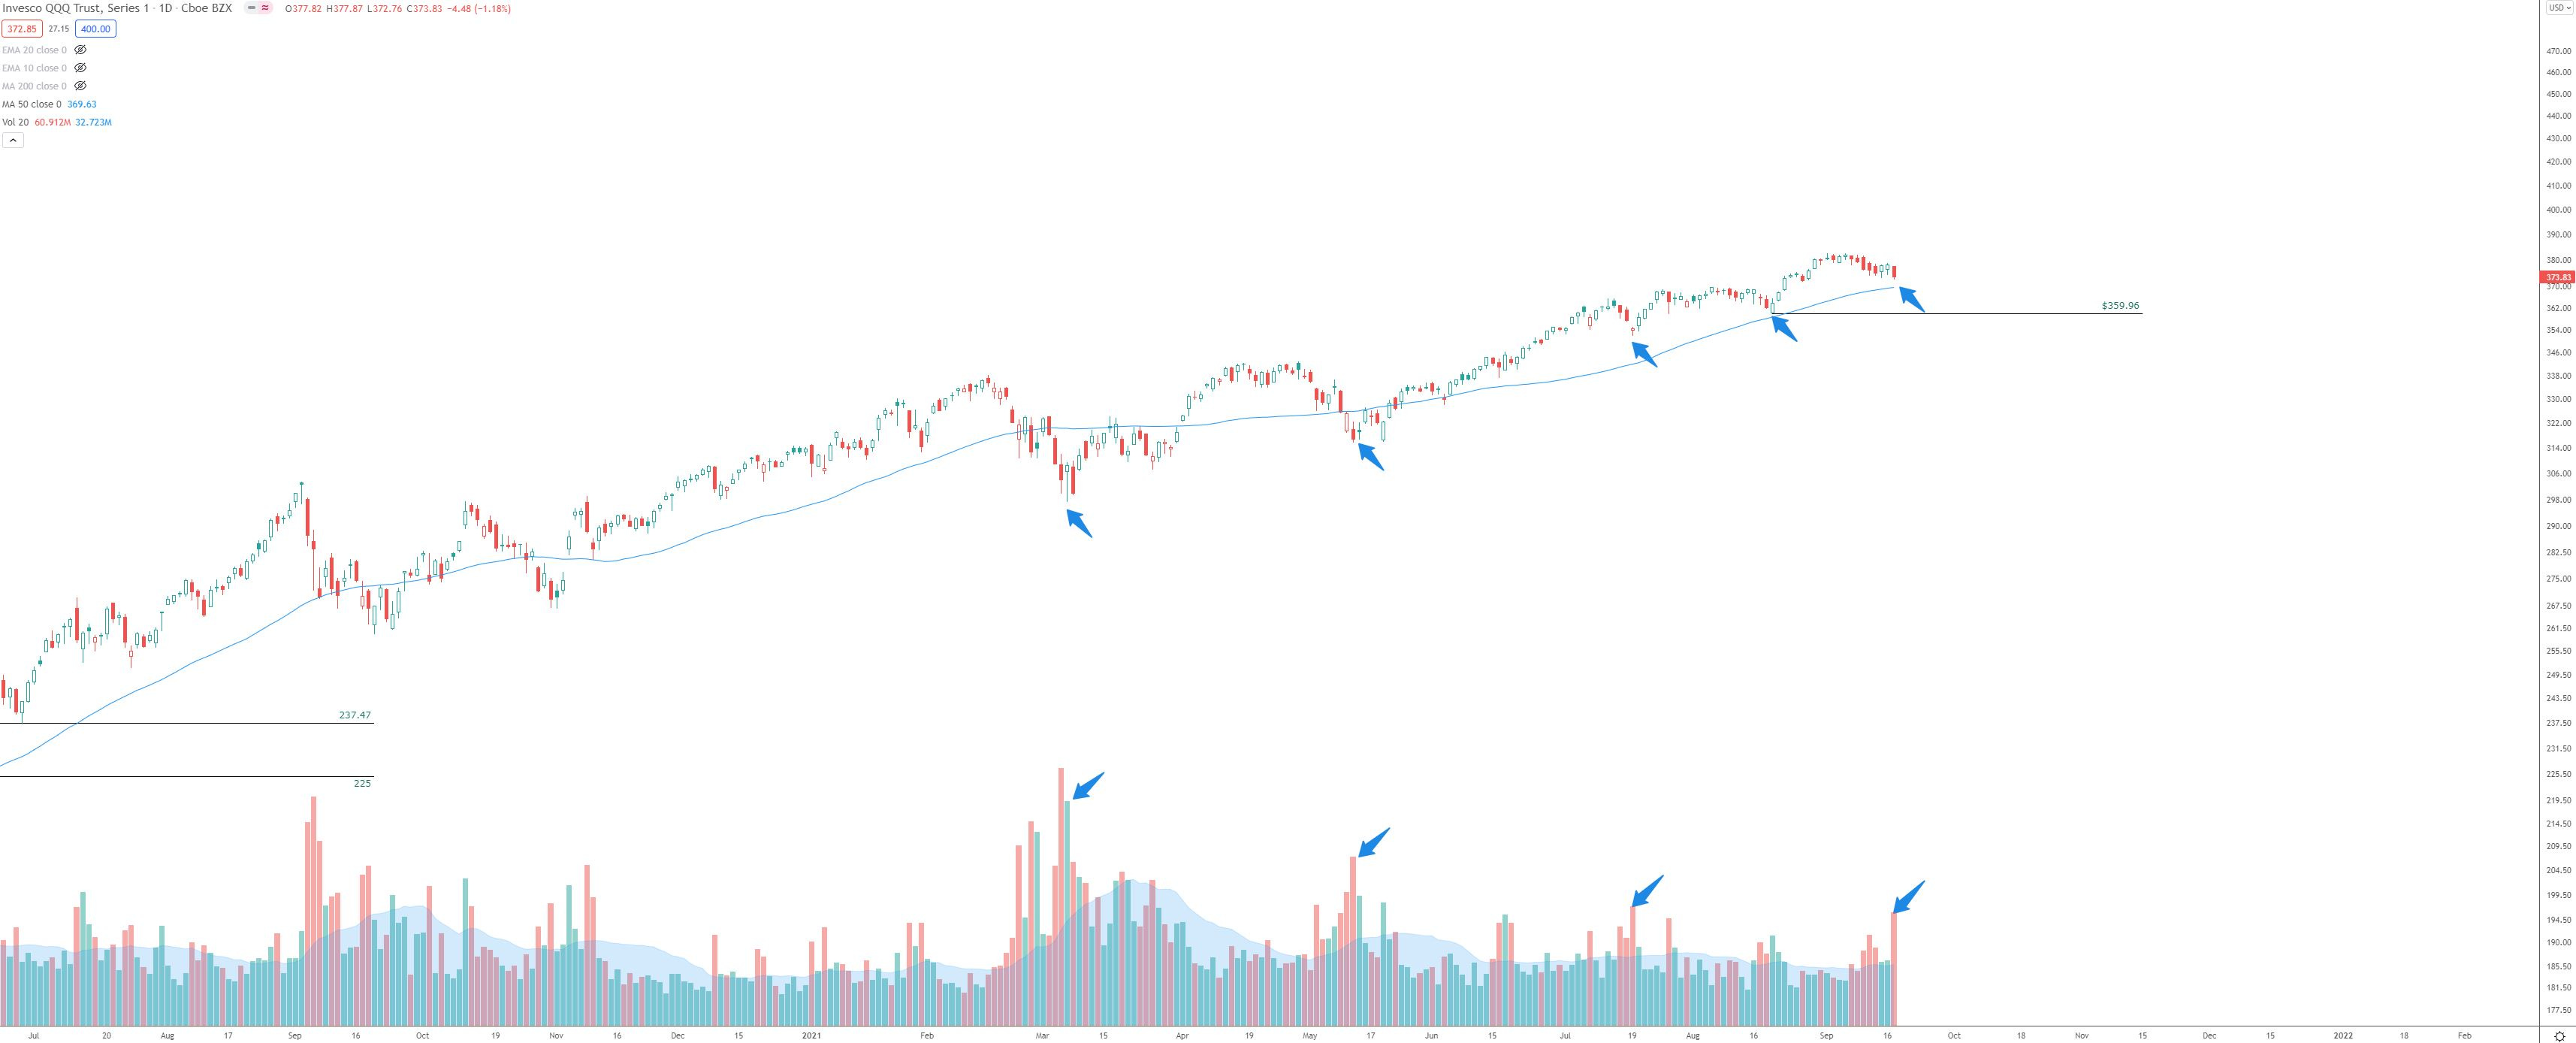
QQQ:
QQQ is another way to look at this recent phenomenon of OPEX pullbacks on high-volume candles.
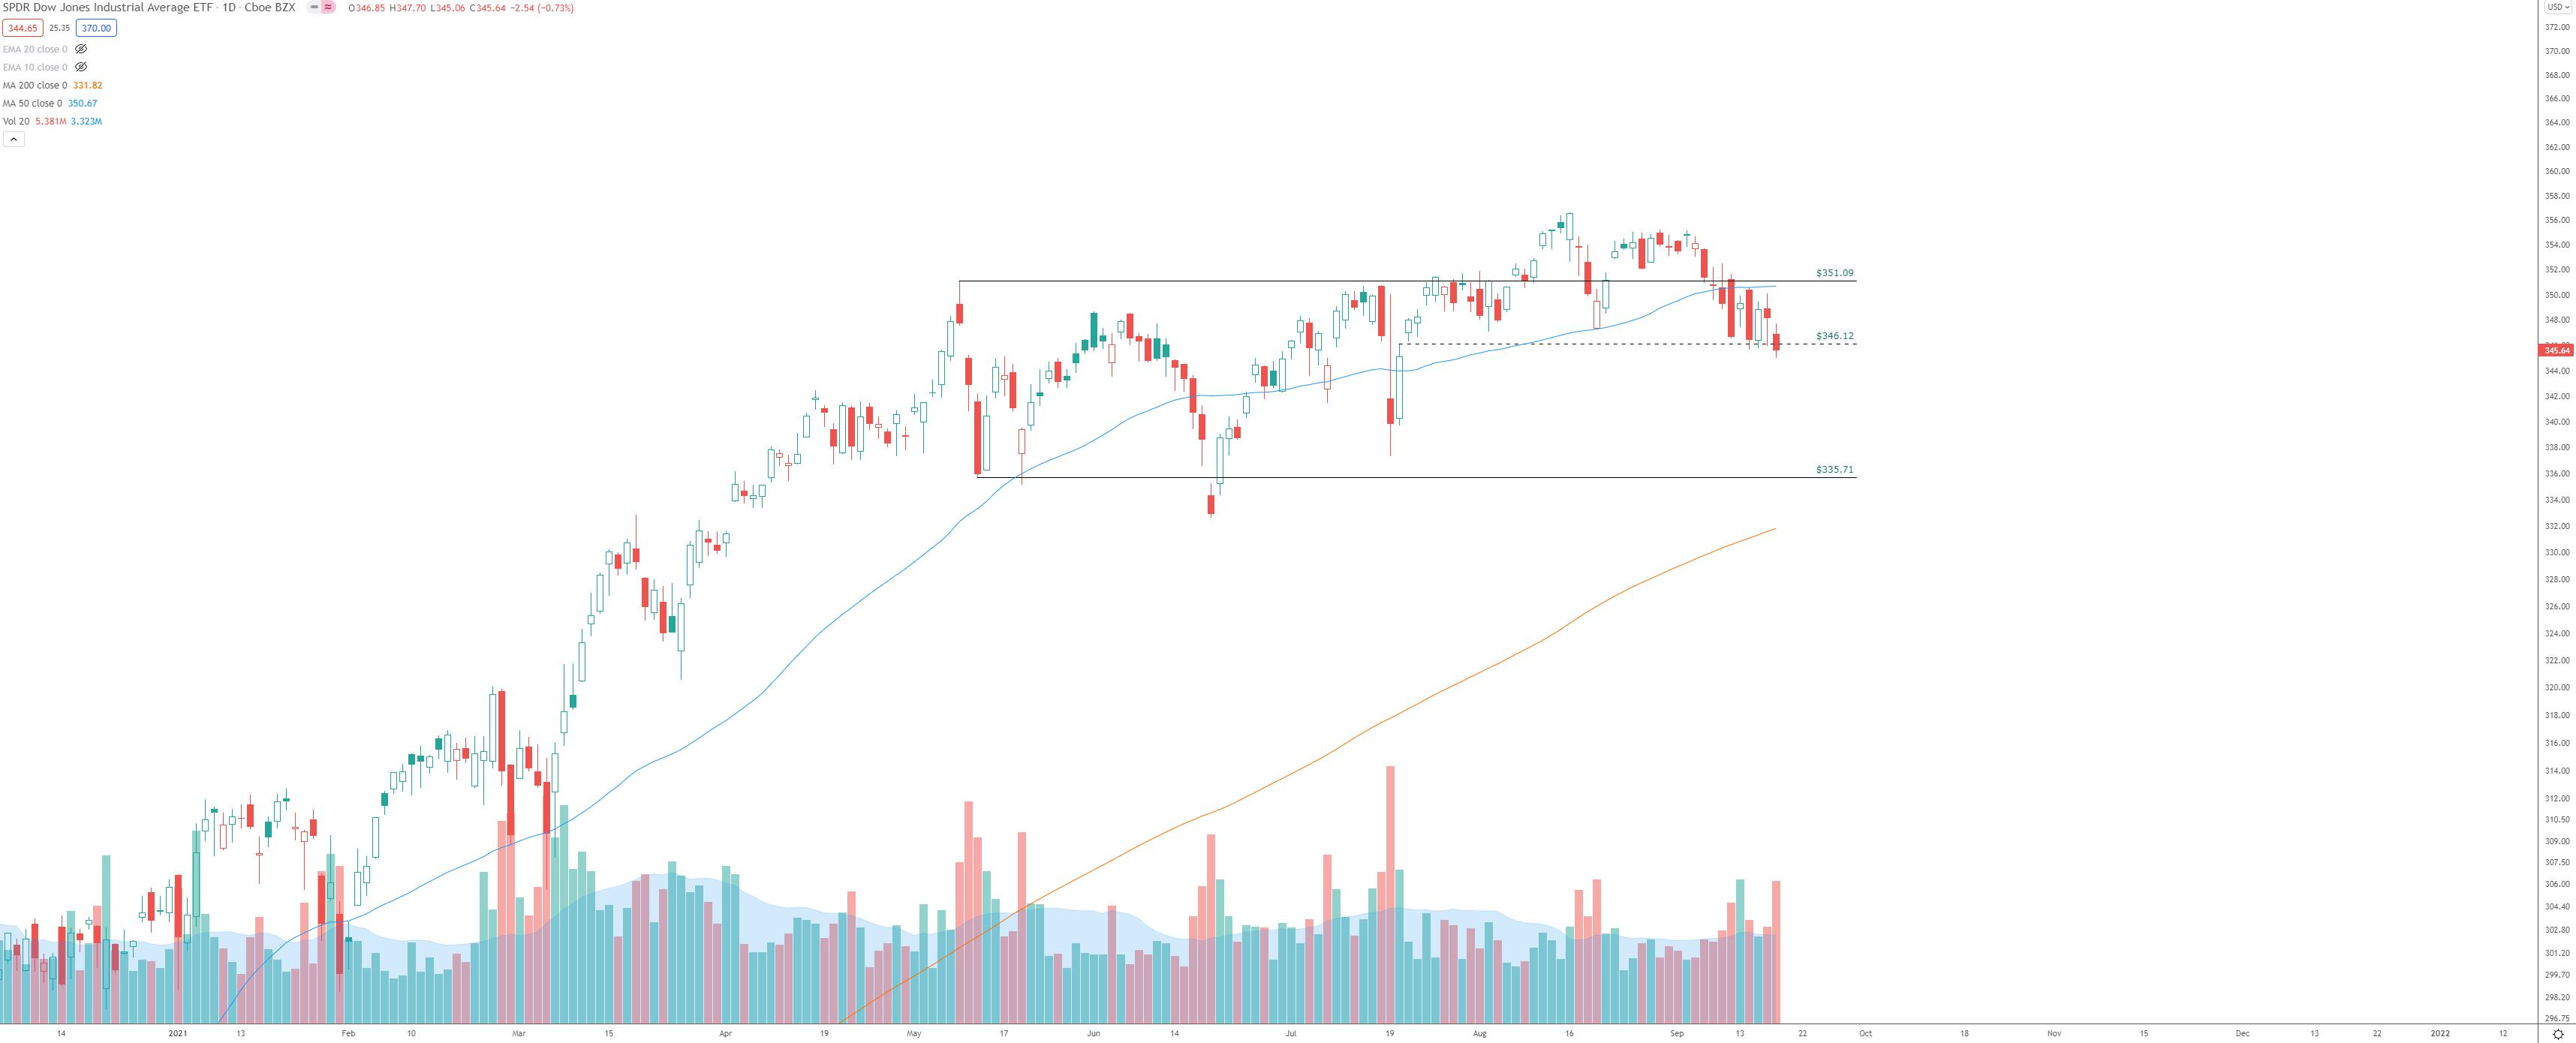
DIA:
In the Dow Jones industrials major ETF, a concern I have is how it has closed below $346.12 on the candle chart.
The concern isn’t as big and a bit easier to see on the PnF chart (see below)
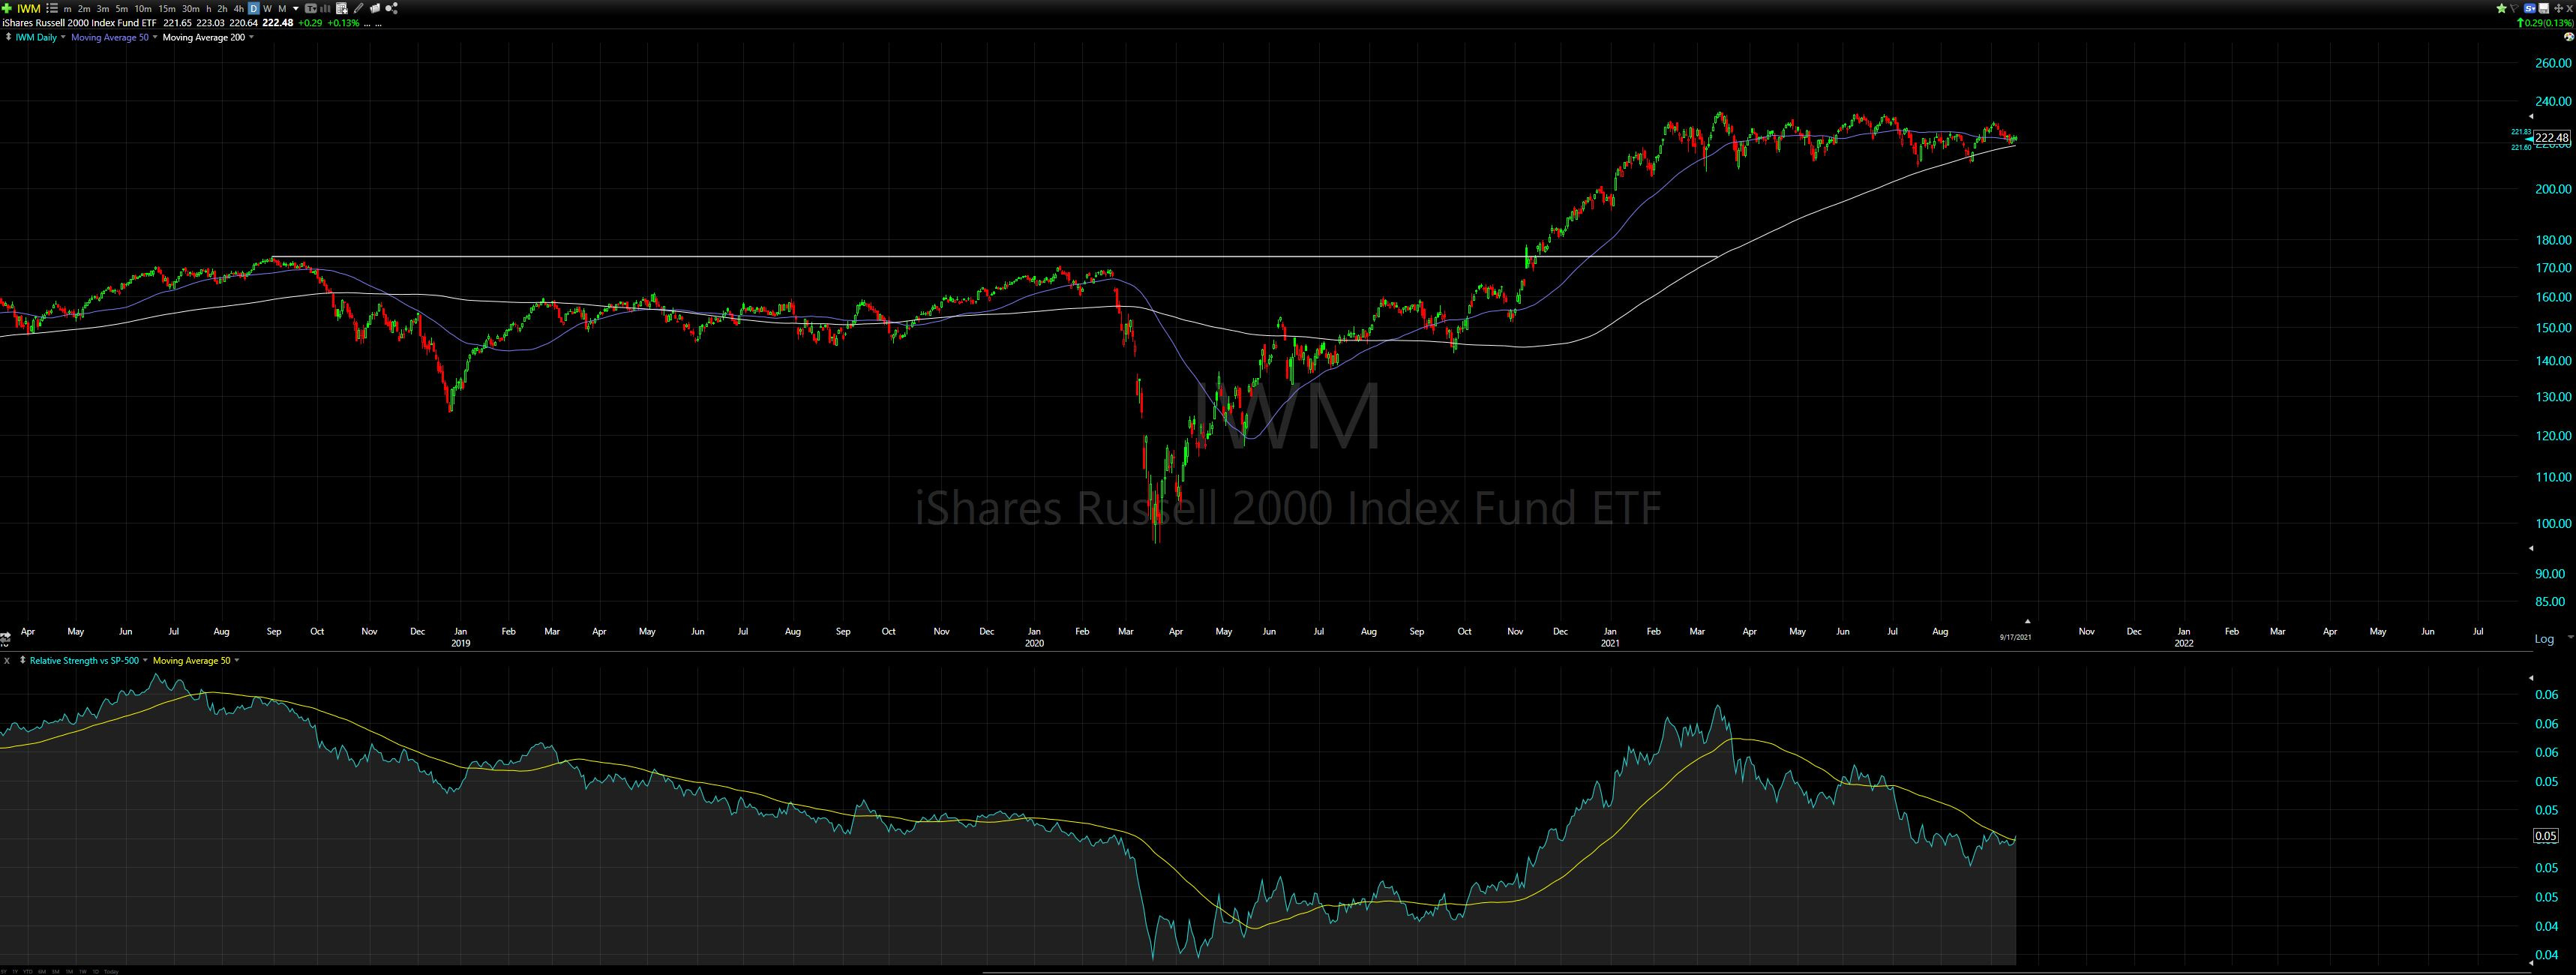
IWM:
A very encouraging development is the small caps holding above the 50-day SMA just as the 200-day catches up
IWM is also showing some strength vs. SPX (see below)
Relative strength vs. SPX:
I like how the relative strength is making a move above the 50-period SMA in an exciting development. I like how this happens just as the 200-day SMA is catching up to the price level IWM closed on Friday.
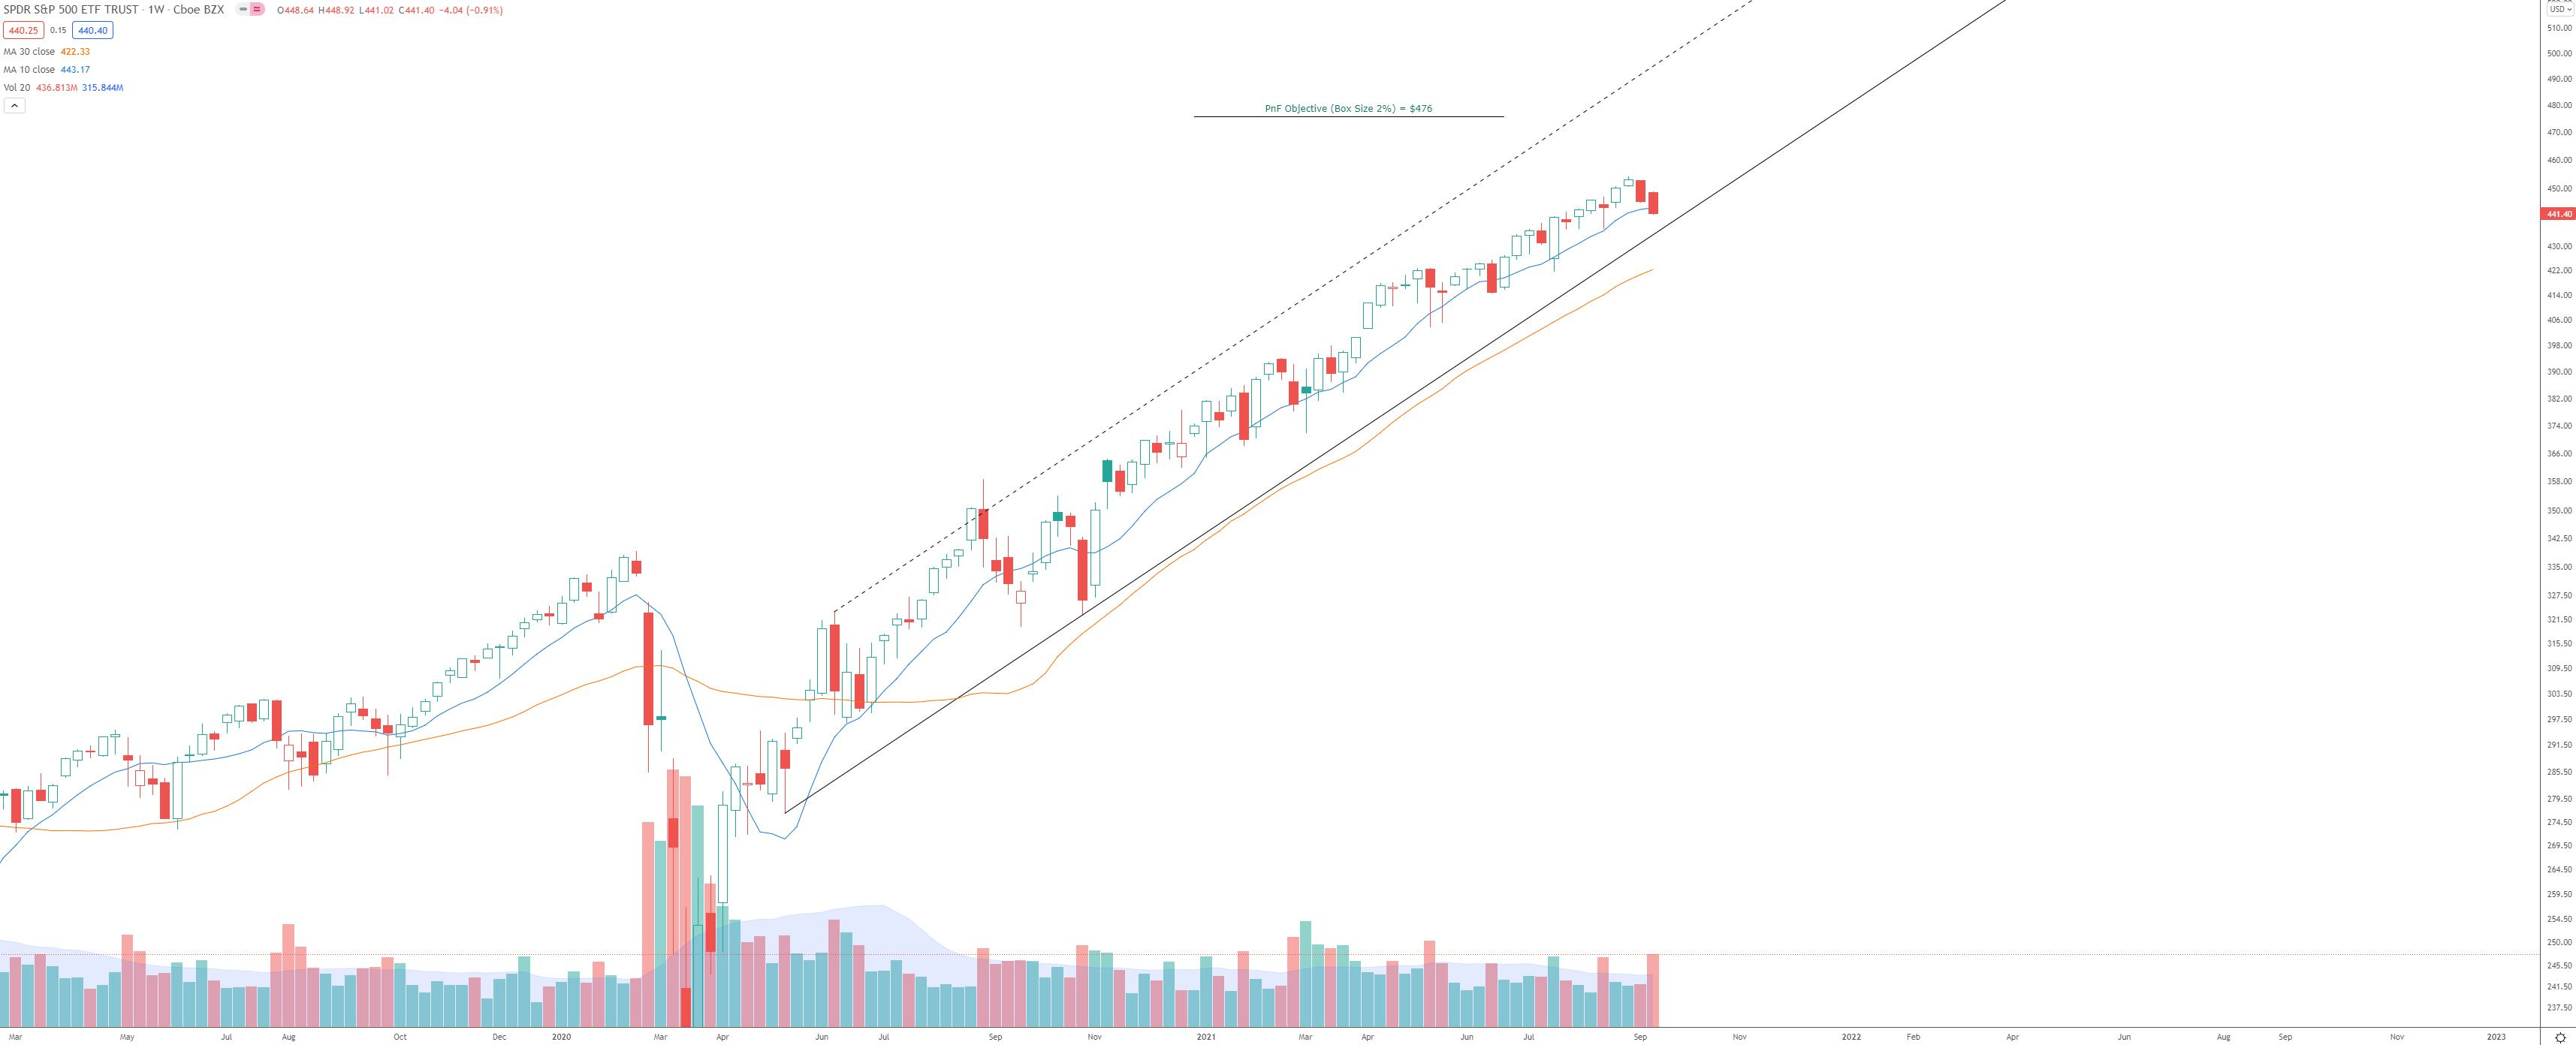
Futures
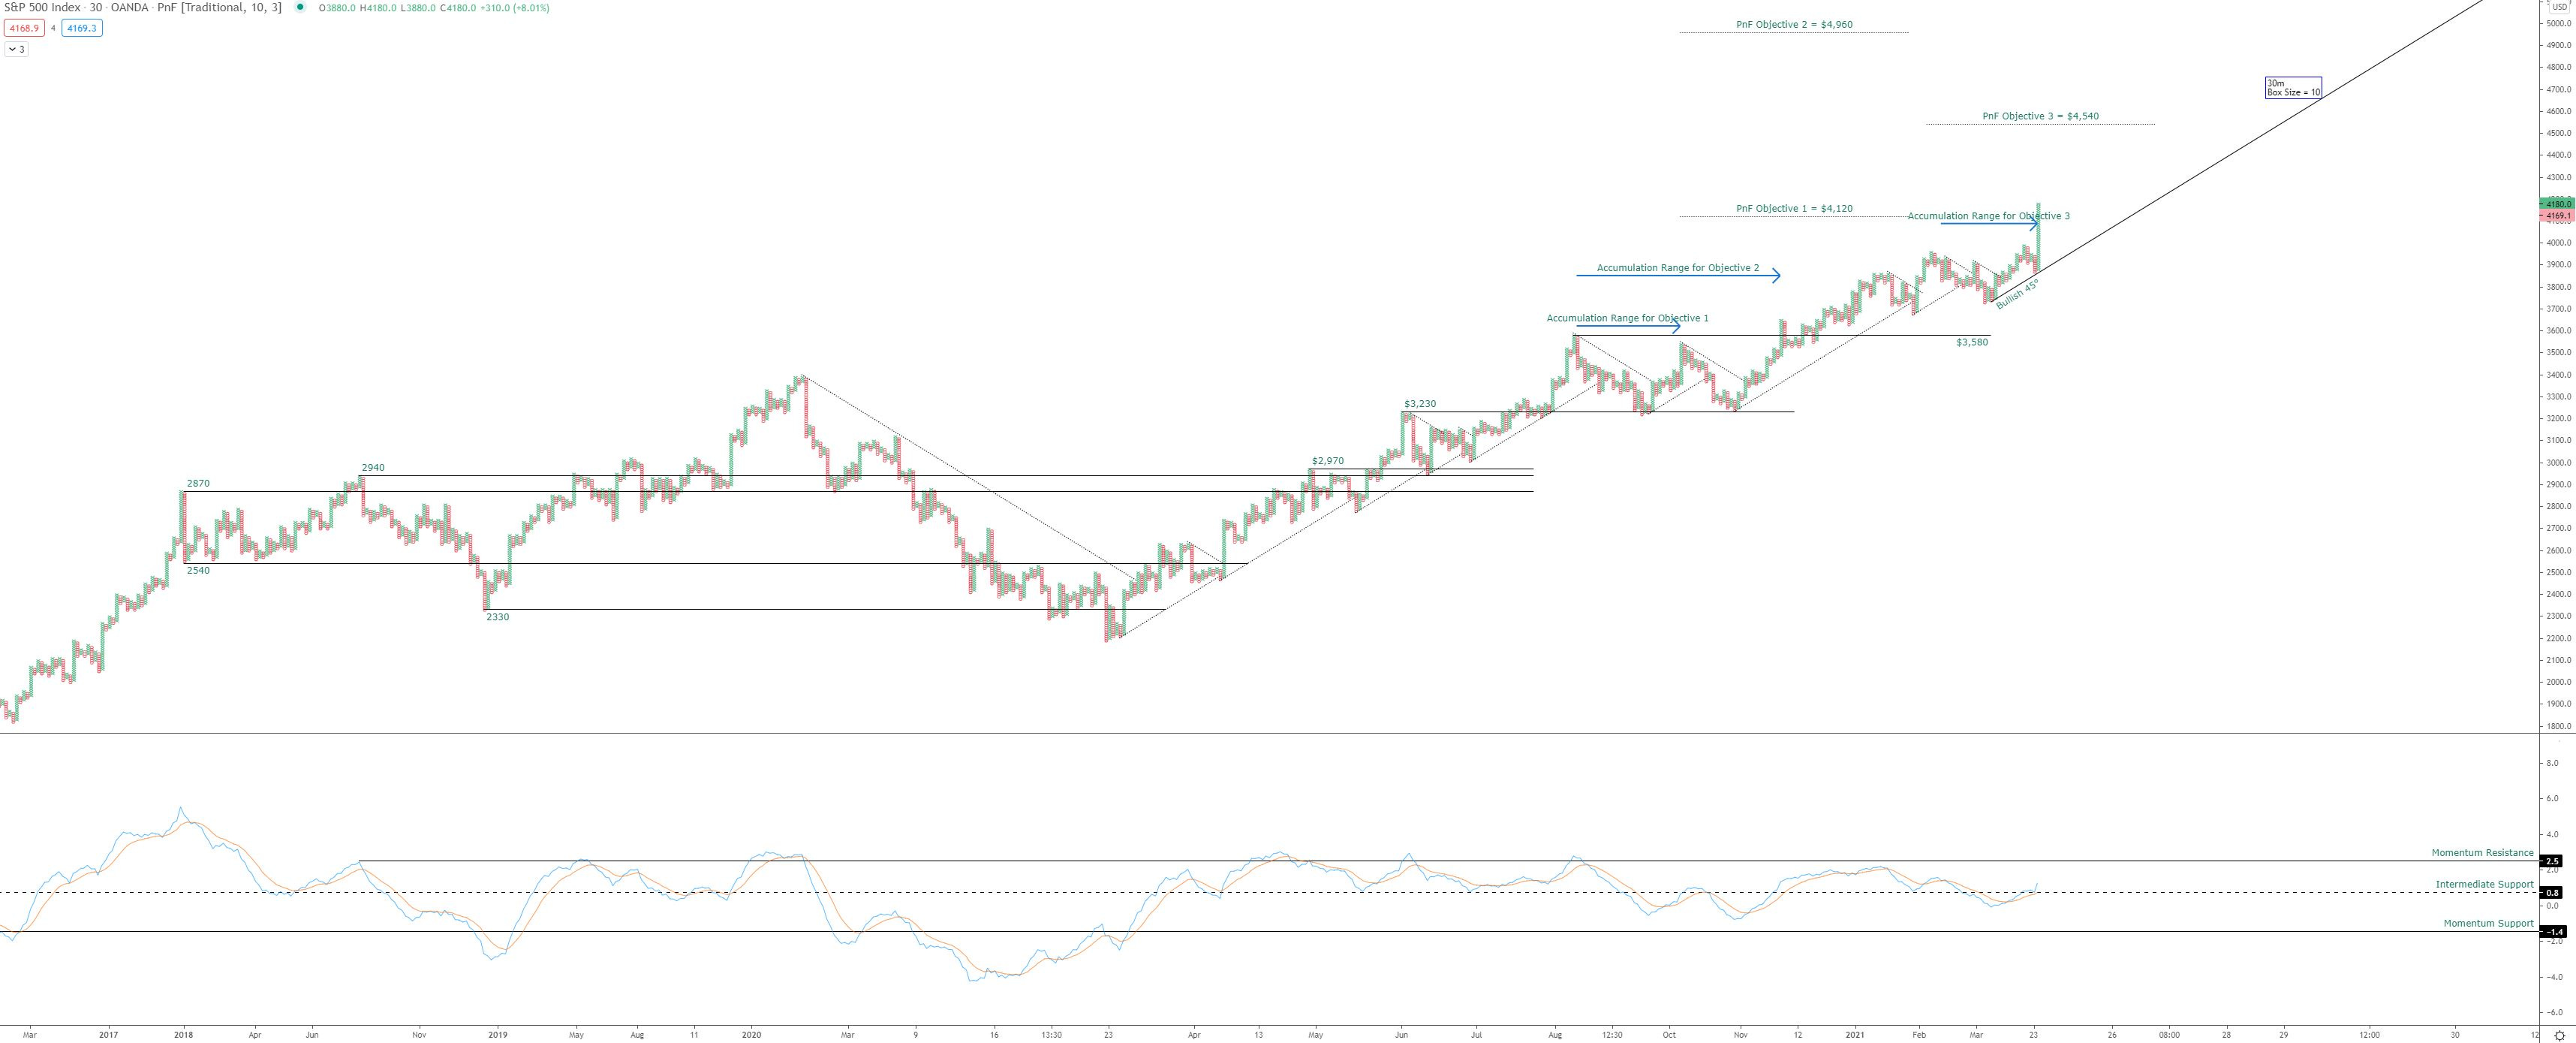
SPX500:
Now that the longer-term target of $4,540 (from April) has been achieved, I’ll get it removed from the chart.
SPX500 achieved objective 1 at $4,120, and I’m removing it from the chart in the future. There is a new objective I’ve shown (#3) at $4,540.
The next target up is $4,960
Here is the updated chart:
The bullish 45° hasn’t been tested, and the recent chopping action has allowed it to catch up to current prices
There are multiple ways to test a bullish 45°, but sideways chopping action (consolidation periods) into them is one of my preferred ways
It allows the momentum to reset lower
It builds a cause for the next leg
It provides a range that helps gauge the reward/risk of potential setups
NAS100:
Similar to SPX, this is chopping into the bullish 45°, just in time for the bullish seasonality to kick in.
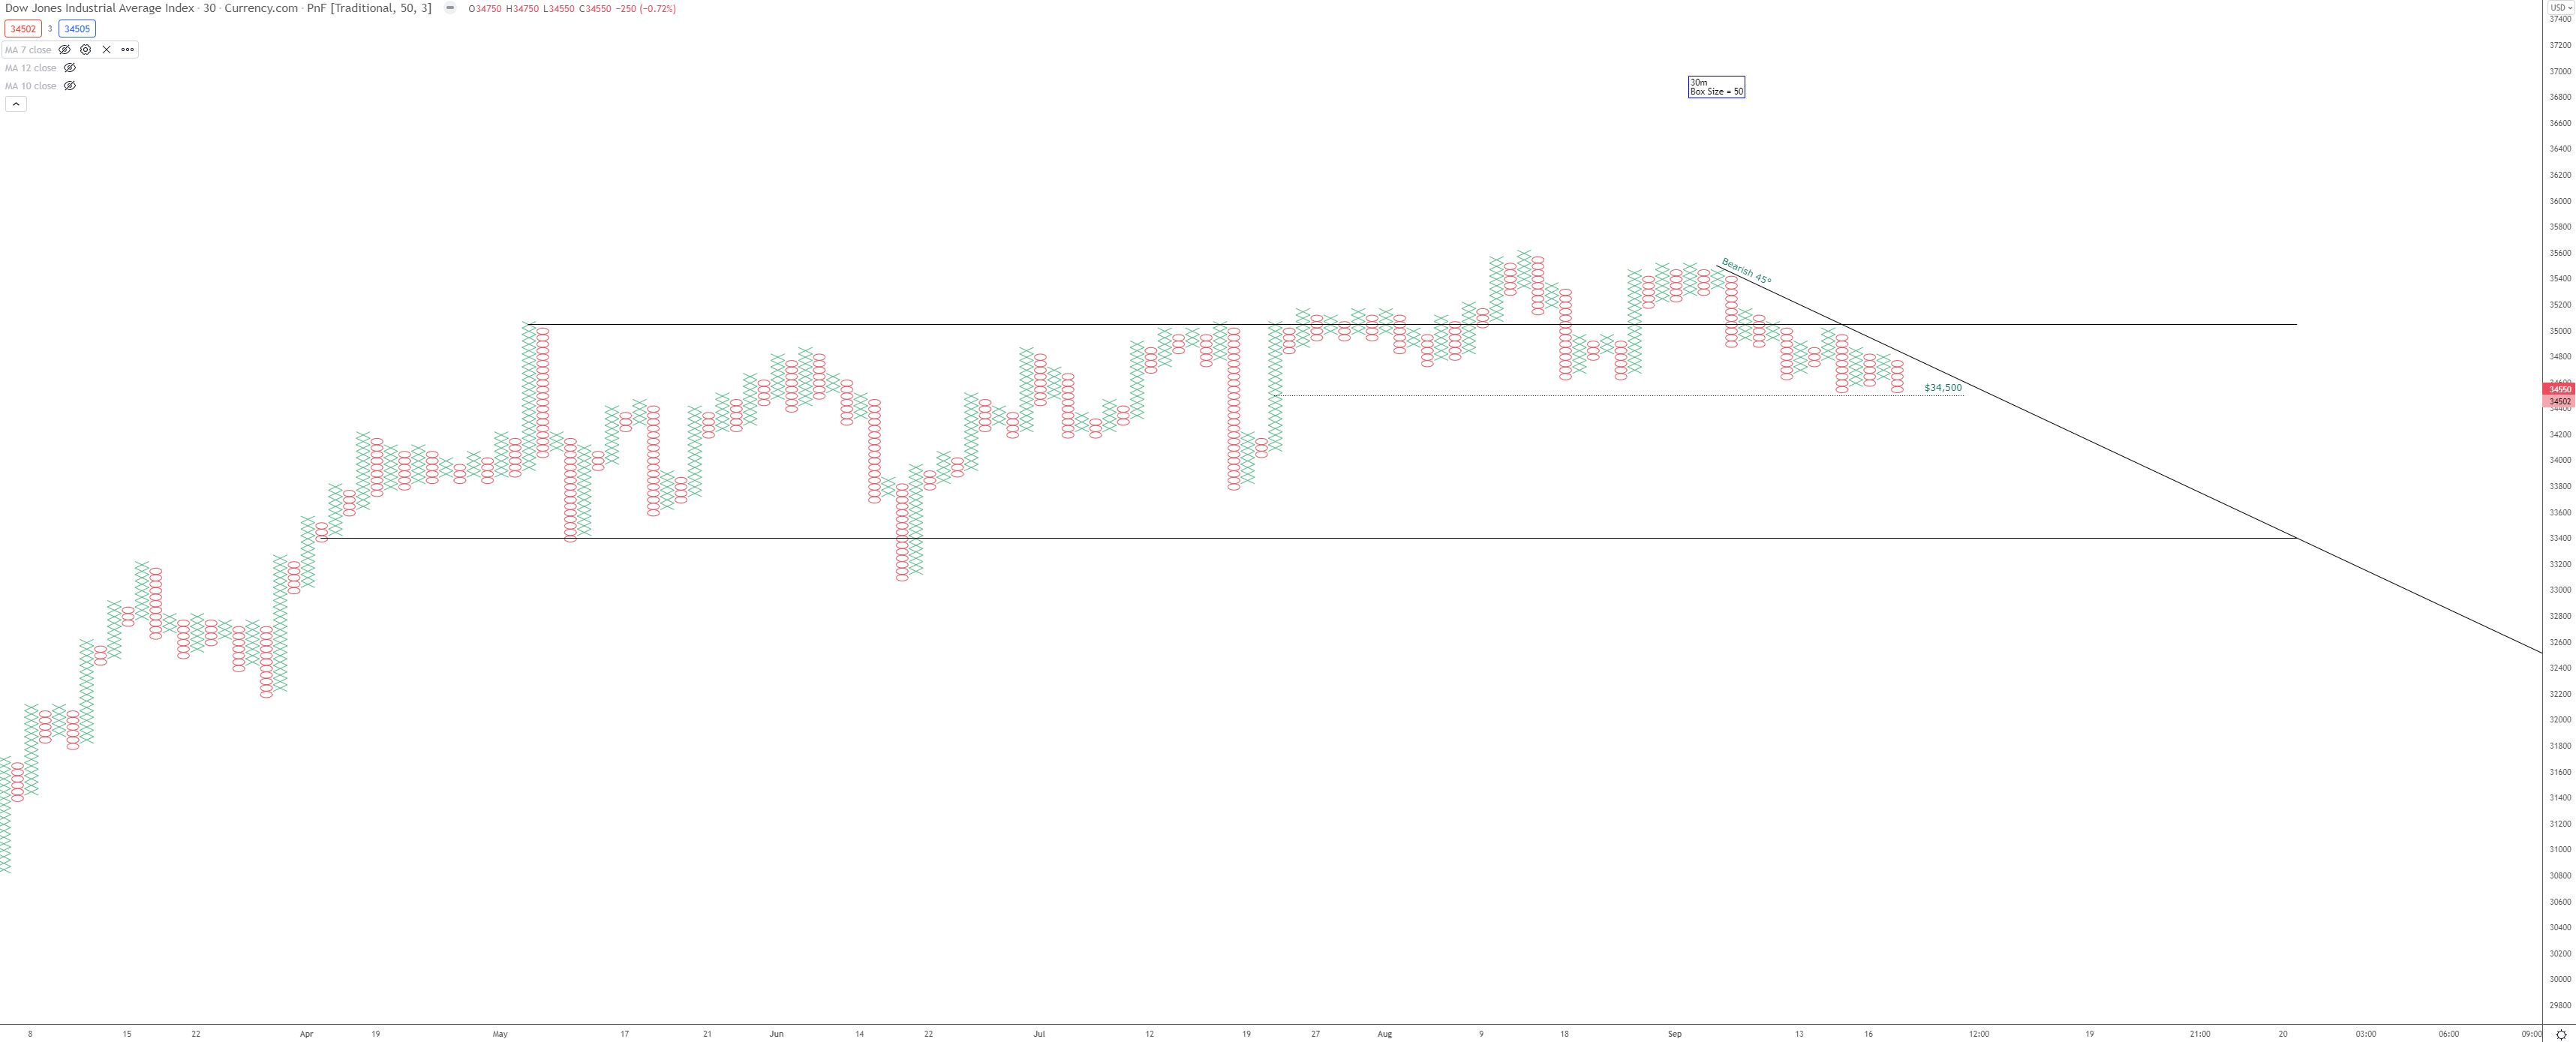
US30:
As noted in the DIA candle chart, there is a concern with the price action closing below a critical support level.
It hasn’t happened on the PnF chart yet, so a bounce from here would achieve two battle victories for the bulls:
Break the bearish 45° trend
Reinforce the support level at $34,500
US2000:
The above chart is the 4-hour chart, showing a powerful bullish trend (via the °45 line) which has had just a single break from the March 2020 COVID lows.
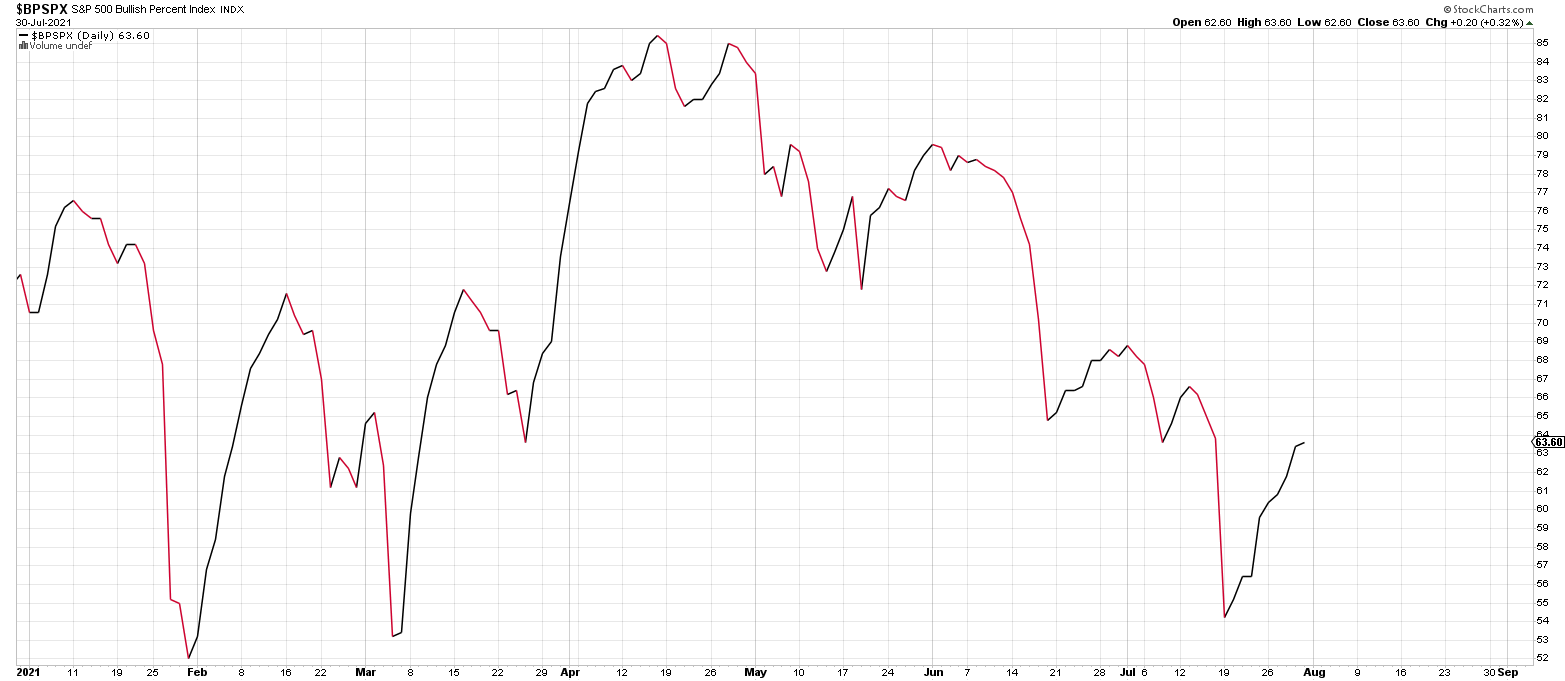
BPSPX:
In that same August 1 linked to earlier, I had this to say about the BPSPX indicator:
BPSPX (Daily)
As we head into August, I’m looking for a break back above 70 to confirm all is well or a break below 47 to indicate trouble lies ahead. Between now and either of those, it will just be noise.
So what has happened since then? Well, not much as the indicator has been rangebound between 50 and 70.
VIX:
The VIX index is my biggest concern at the moment. An often overused indicator by many, I like to keep things simple with the VIX index. If it is above 20 as it is now, I raise my caution levels accordingly.
VIX has closed above 20 for the 2nd week in a row - which is the first time since early 2021 (March).
So far, it hasn’t made it up to the 25-level as it did in each of the prior two months, but there is still another week of bearish SPX seasonality.
The relative strength vs. SPX seems to have flattened out and shown a slight curl higher now - something to keep an eye on.
My scans aren’t showing any sectors/industries that I’d want to jump into for new positions at the moment, and with VIX above 20, I will wait for more favorable seasonality & setups. I’ll let the leaders emerge and plan accordingly. In these environments, I feel it is best to be patient but ready to strike.
The good news is that the bullish seasonality is around the corner, and small caps are looking relatively strong lately. I will continue scanning daily and watching for the market’s clues.
That is all for today. Can you believe I made it through an entire post without mentioning Bitcoin?
Ok, well, now that I mentioned it… ;-)
Here is the seasonality going into the end of the year (including all 11 years of data):
Recall from last week that September is the most bearish month of the year, with -8% average returns. So far, after 19 days, it is up just over 1%
From Sept. 20 into year-end, the average returns (including the bear market years) is 62.8%, which annualizes to 473%. Not too bad!
In the Post-Election years, the Sept. 20 into year-end returns are a staggering 363.8%, which annualizes into 24,225%. I’ll take that!