

Market Outlook 21-Aug-22
Market Outlook 21-Aug-22
Housing & 30-Year Rates, Oil & Inflation Check

Good afternoon,
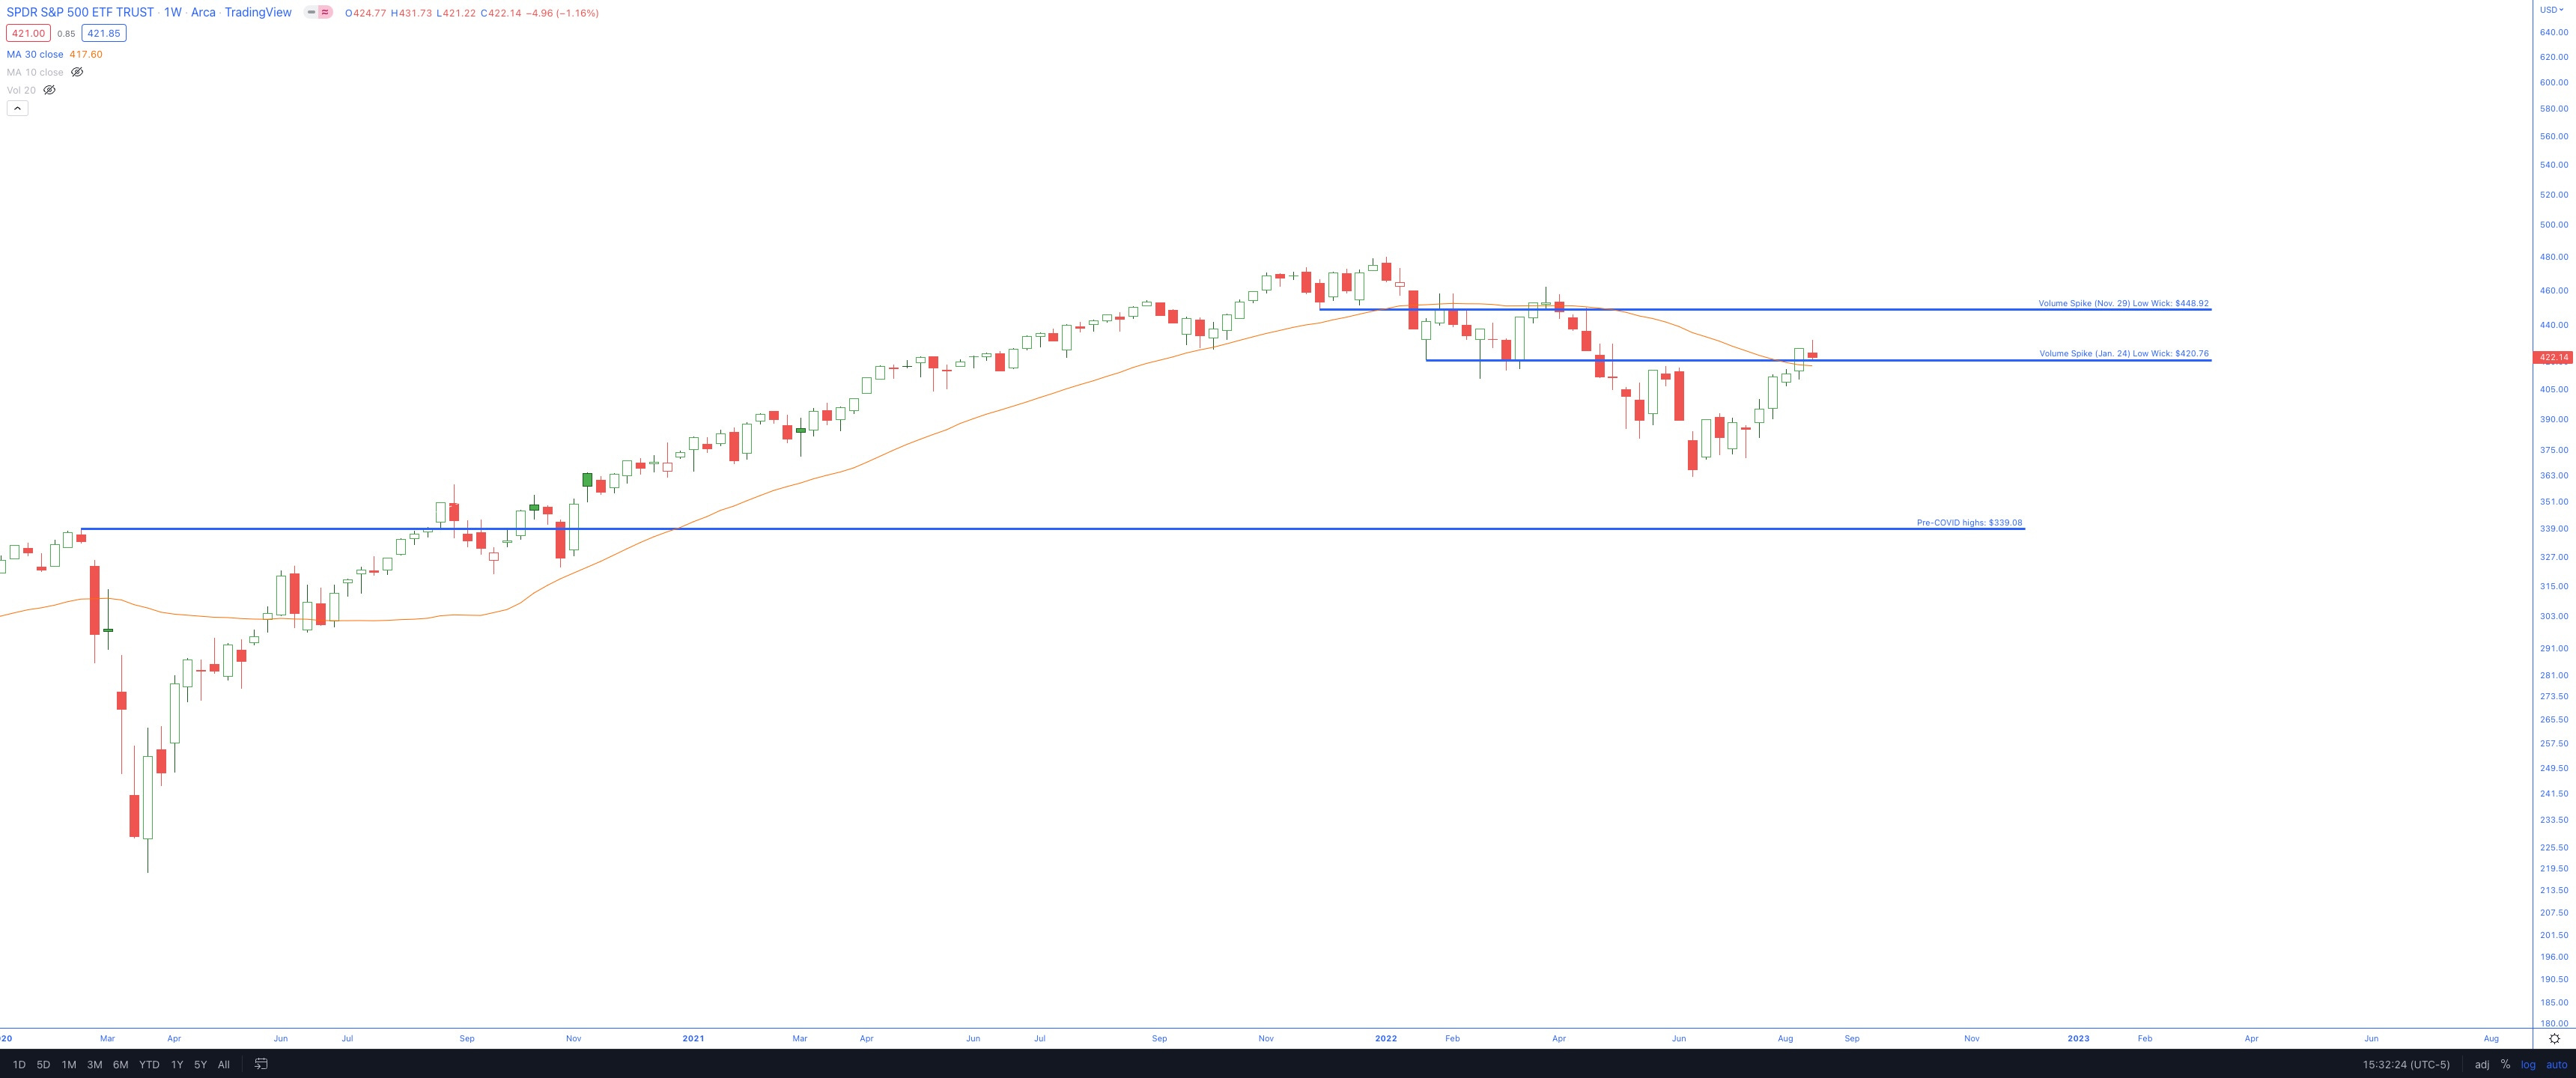
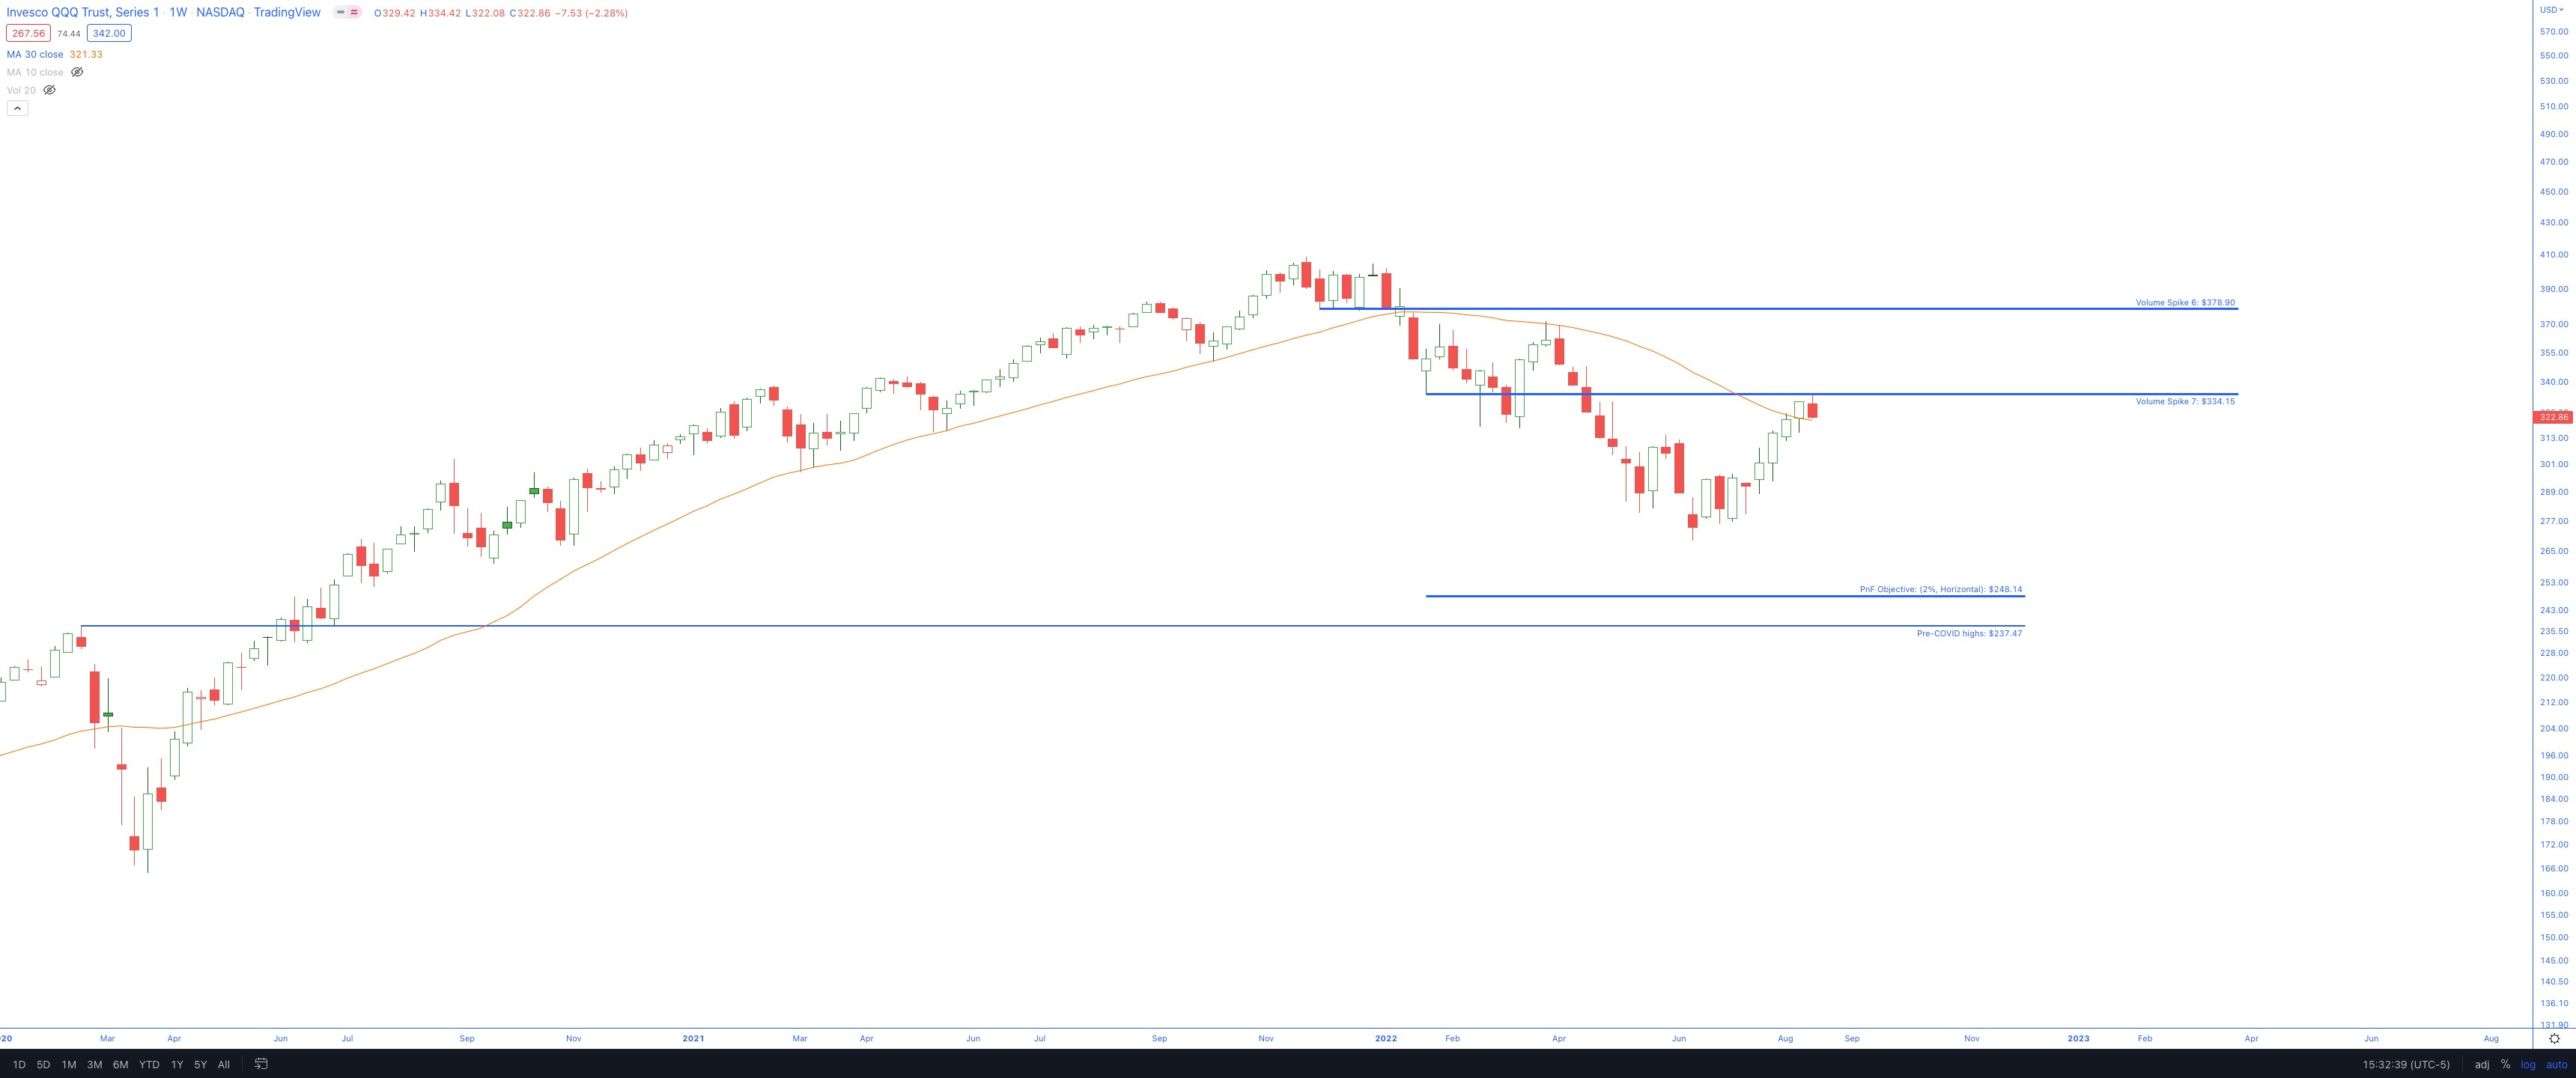
The markets had their first weekly pullback in five weeks, cooling off the sentiment a bit this weekend. All four majors remain above their respective 30-week SMAs, and only QQQ remains below the PAV spike level from the Jan. 24th weekly candle low wick.
SPY
QQQ
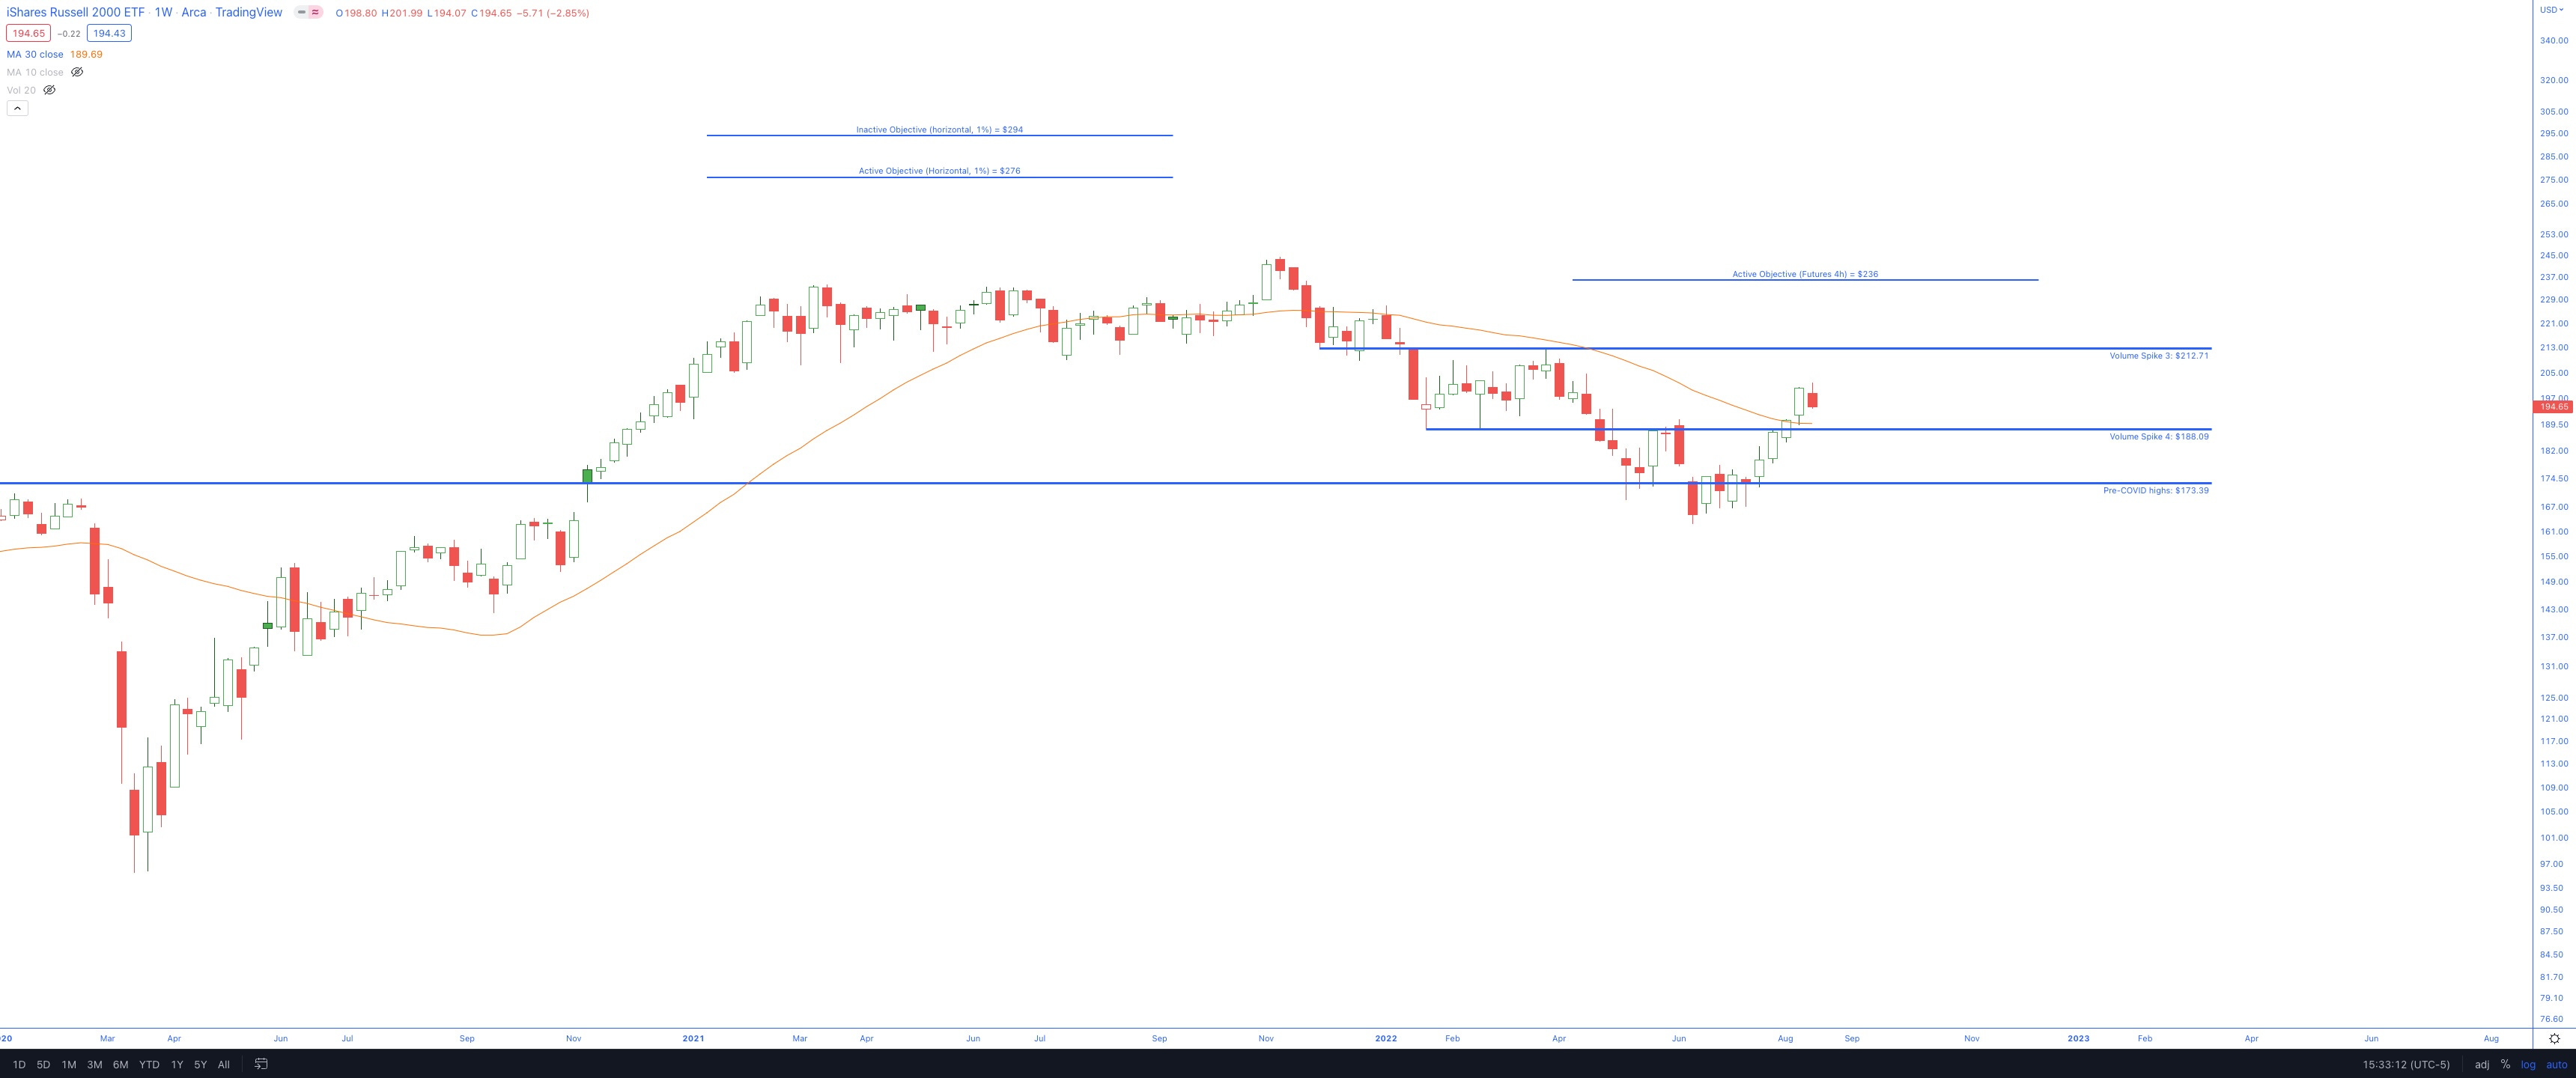
IWM
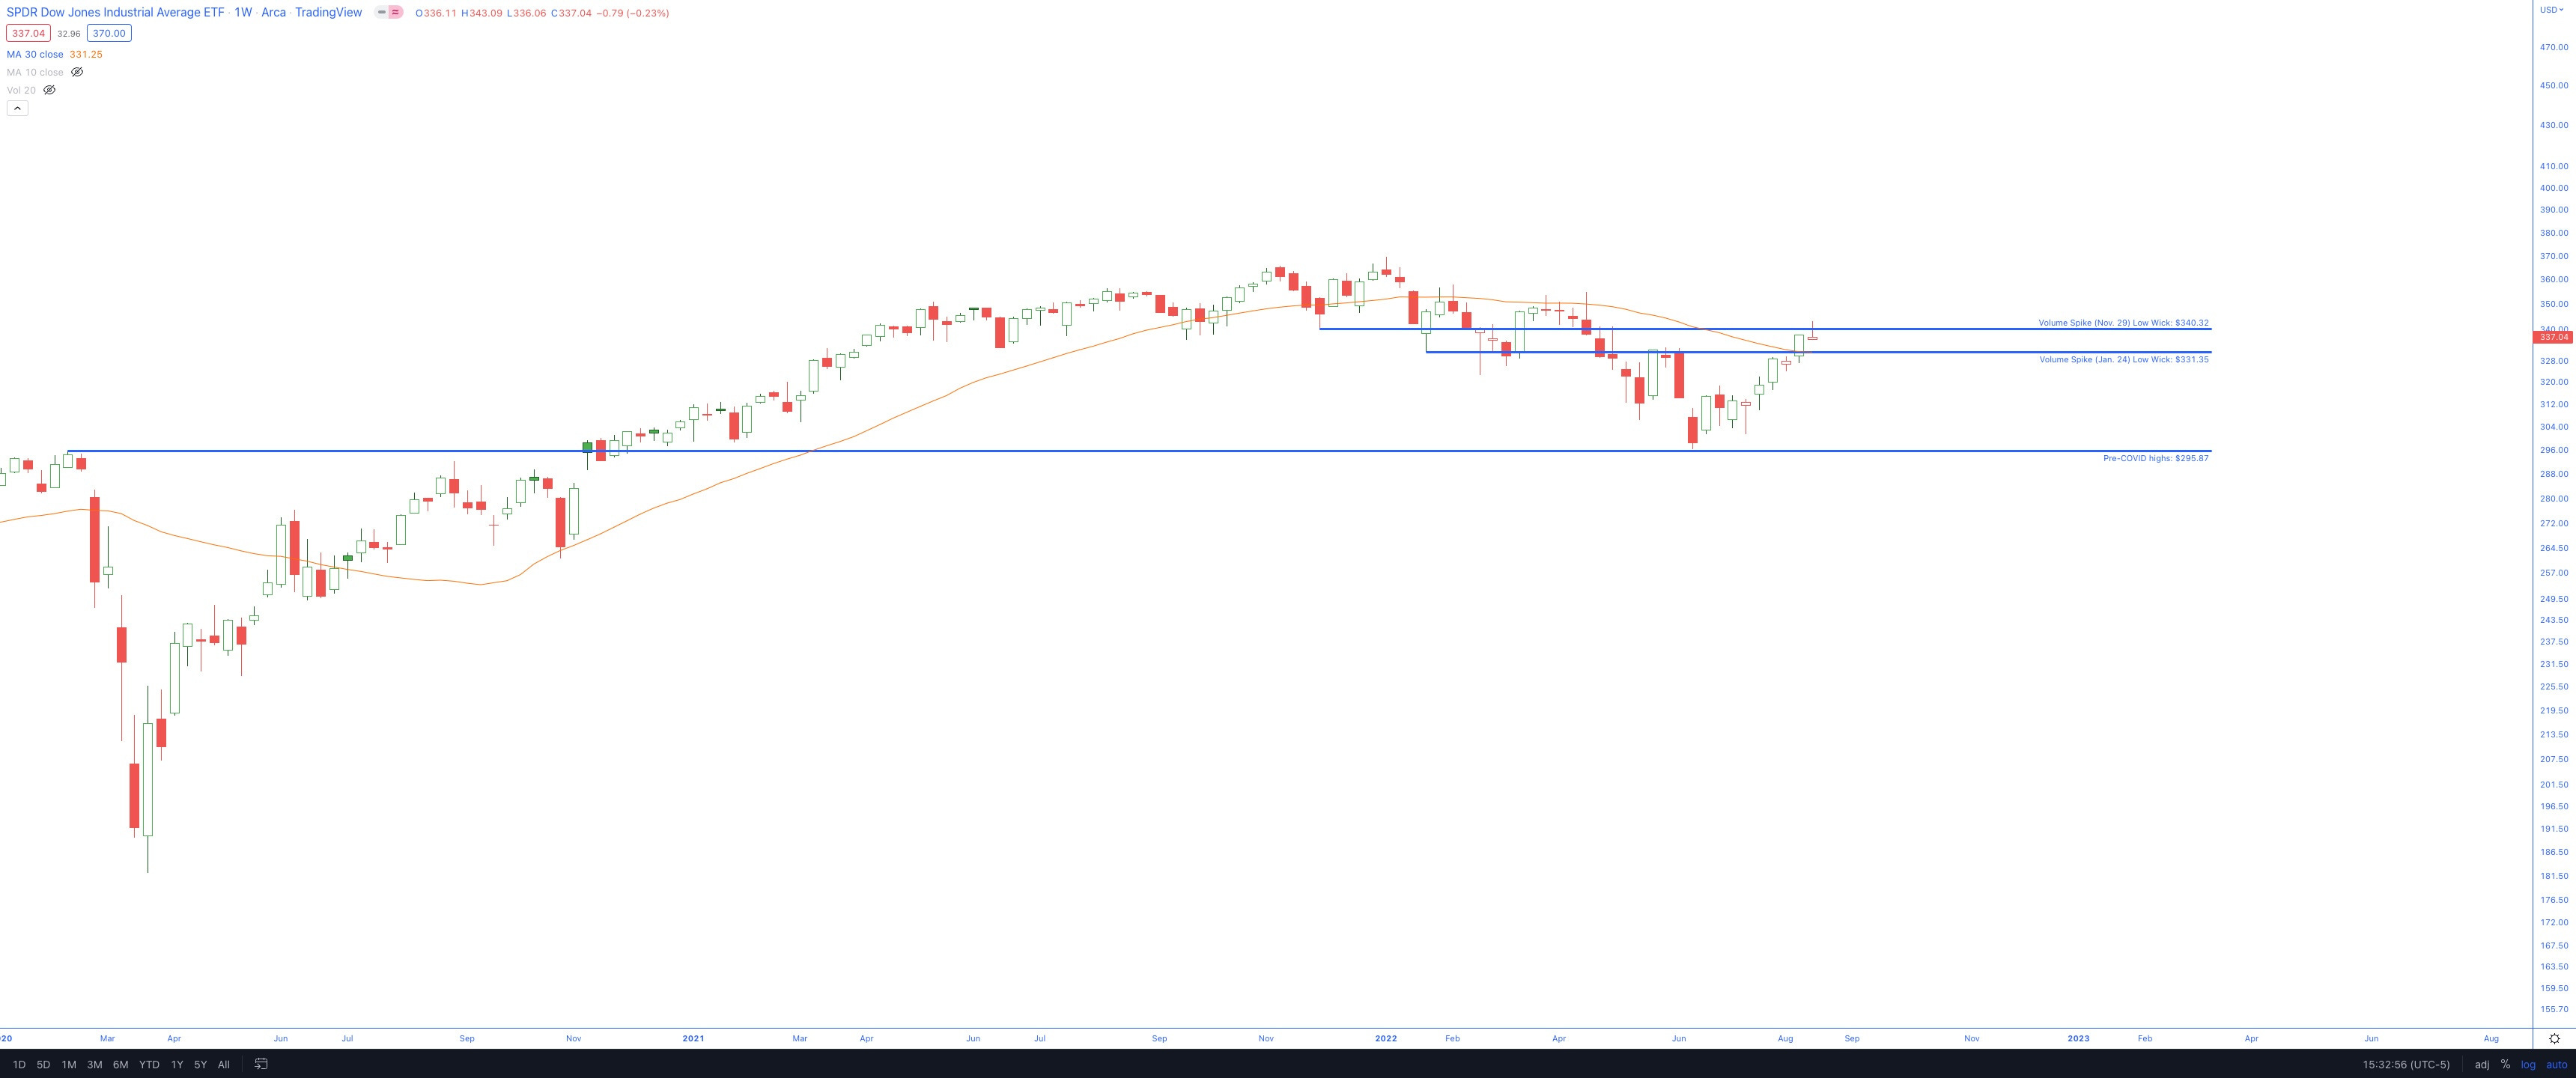
DIA
Two weeks ago, my thoughts regarding IWM being above the 30-week SMA and the Jan. 24th low wick were:

The fact that a significant ETF is now above the 30-week SMA and the Jan. 24th low wick is noteworthy. It could be a short-lived, one-week incident, but it is very well worth tracking. It has my attention, and I’m happy to see where this goes over the next week or two.
Now, two weeks later, all four majors are above that moving average, and only one (QQQ) remains below the Jan. 24th low wick.
More time is needed, but as it stands now, it looks like quite a bit of repair has taken place on the charts.
Housing and Interest Rates
Housing
On Friday, I had some drinks with a group of friends, and someone mentioned how lucky he and his wife were to time the recent housing market moves.
They came across a lot they liked and decided to purchase and order lumber in February 2020. They had the house built during the lockdowns and recently sold it this year, making tremendous gains on their investment. He plans to wait for the “housing bubble to collapse” and repeat the process.
The conversation inspired me to look at the HGX chart today:
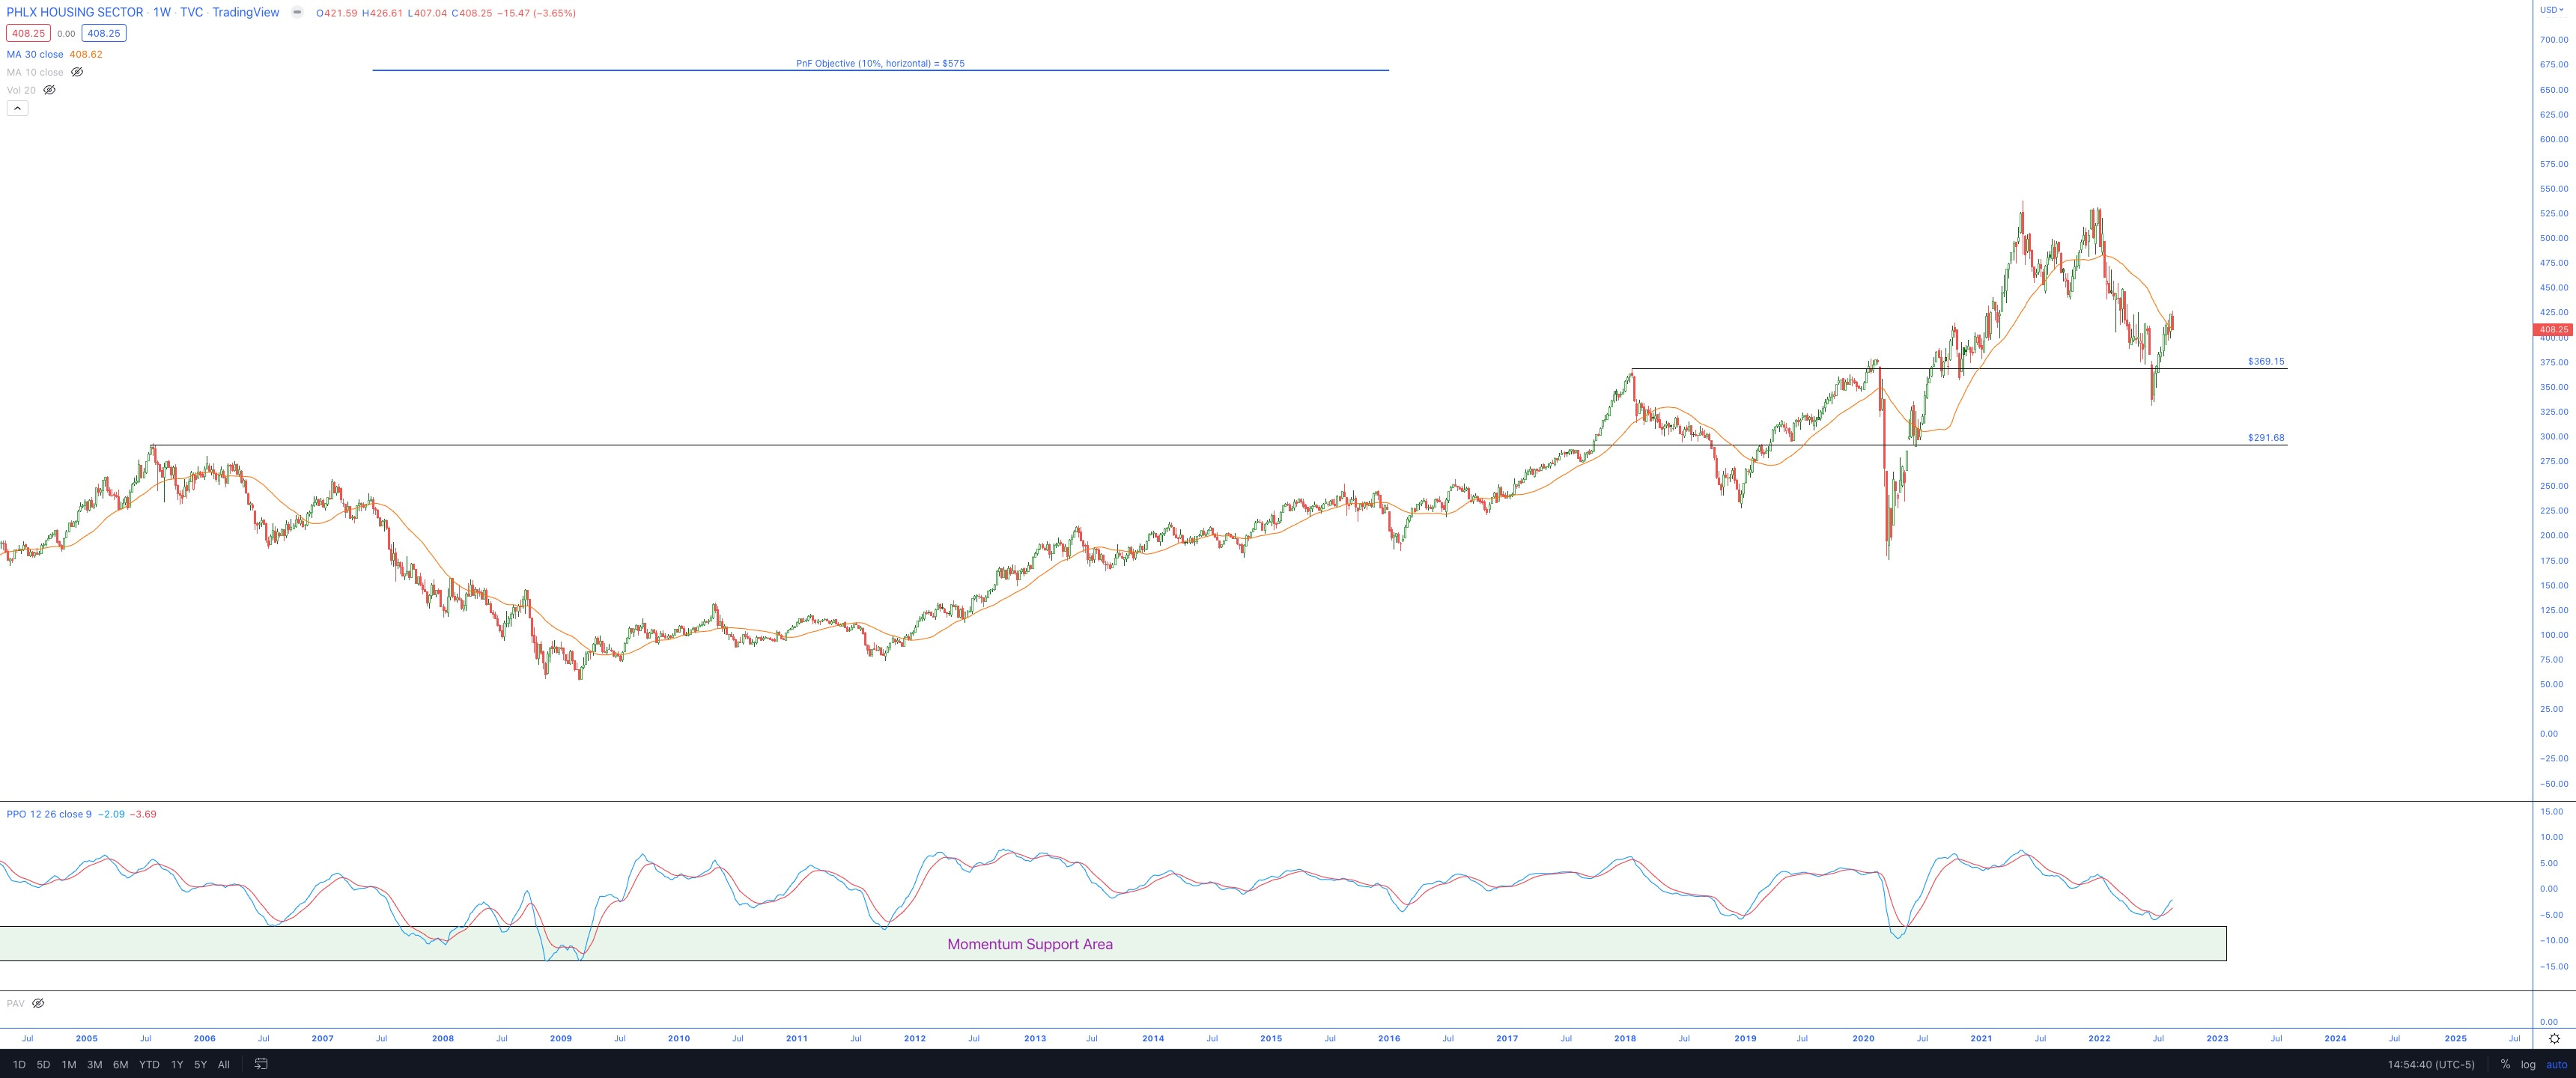
The above chart is from the " HGX " ticker, the PHLX Housing Sector Index.
There are some key takeaways when I look at the above chart and compare it to my friend’s locked-in mentality that the housing market is in a “bubble”:
From the peak of the housing market (July 2005) to the recent dip (June 2022), there was only a 12.8% increase in the chart. That does not seem like much at all over 17 years!
He could be correct, and the housing market is in a bubble. Or, he could be holding on to that wishful thinking because that is what would be easy for him to compound his recent gains.
When it comes to housing, I think it prudent to evaluate the 30-year rates.
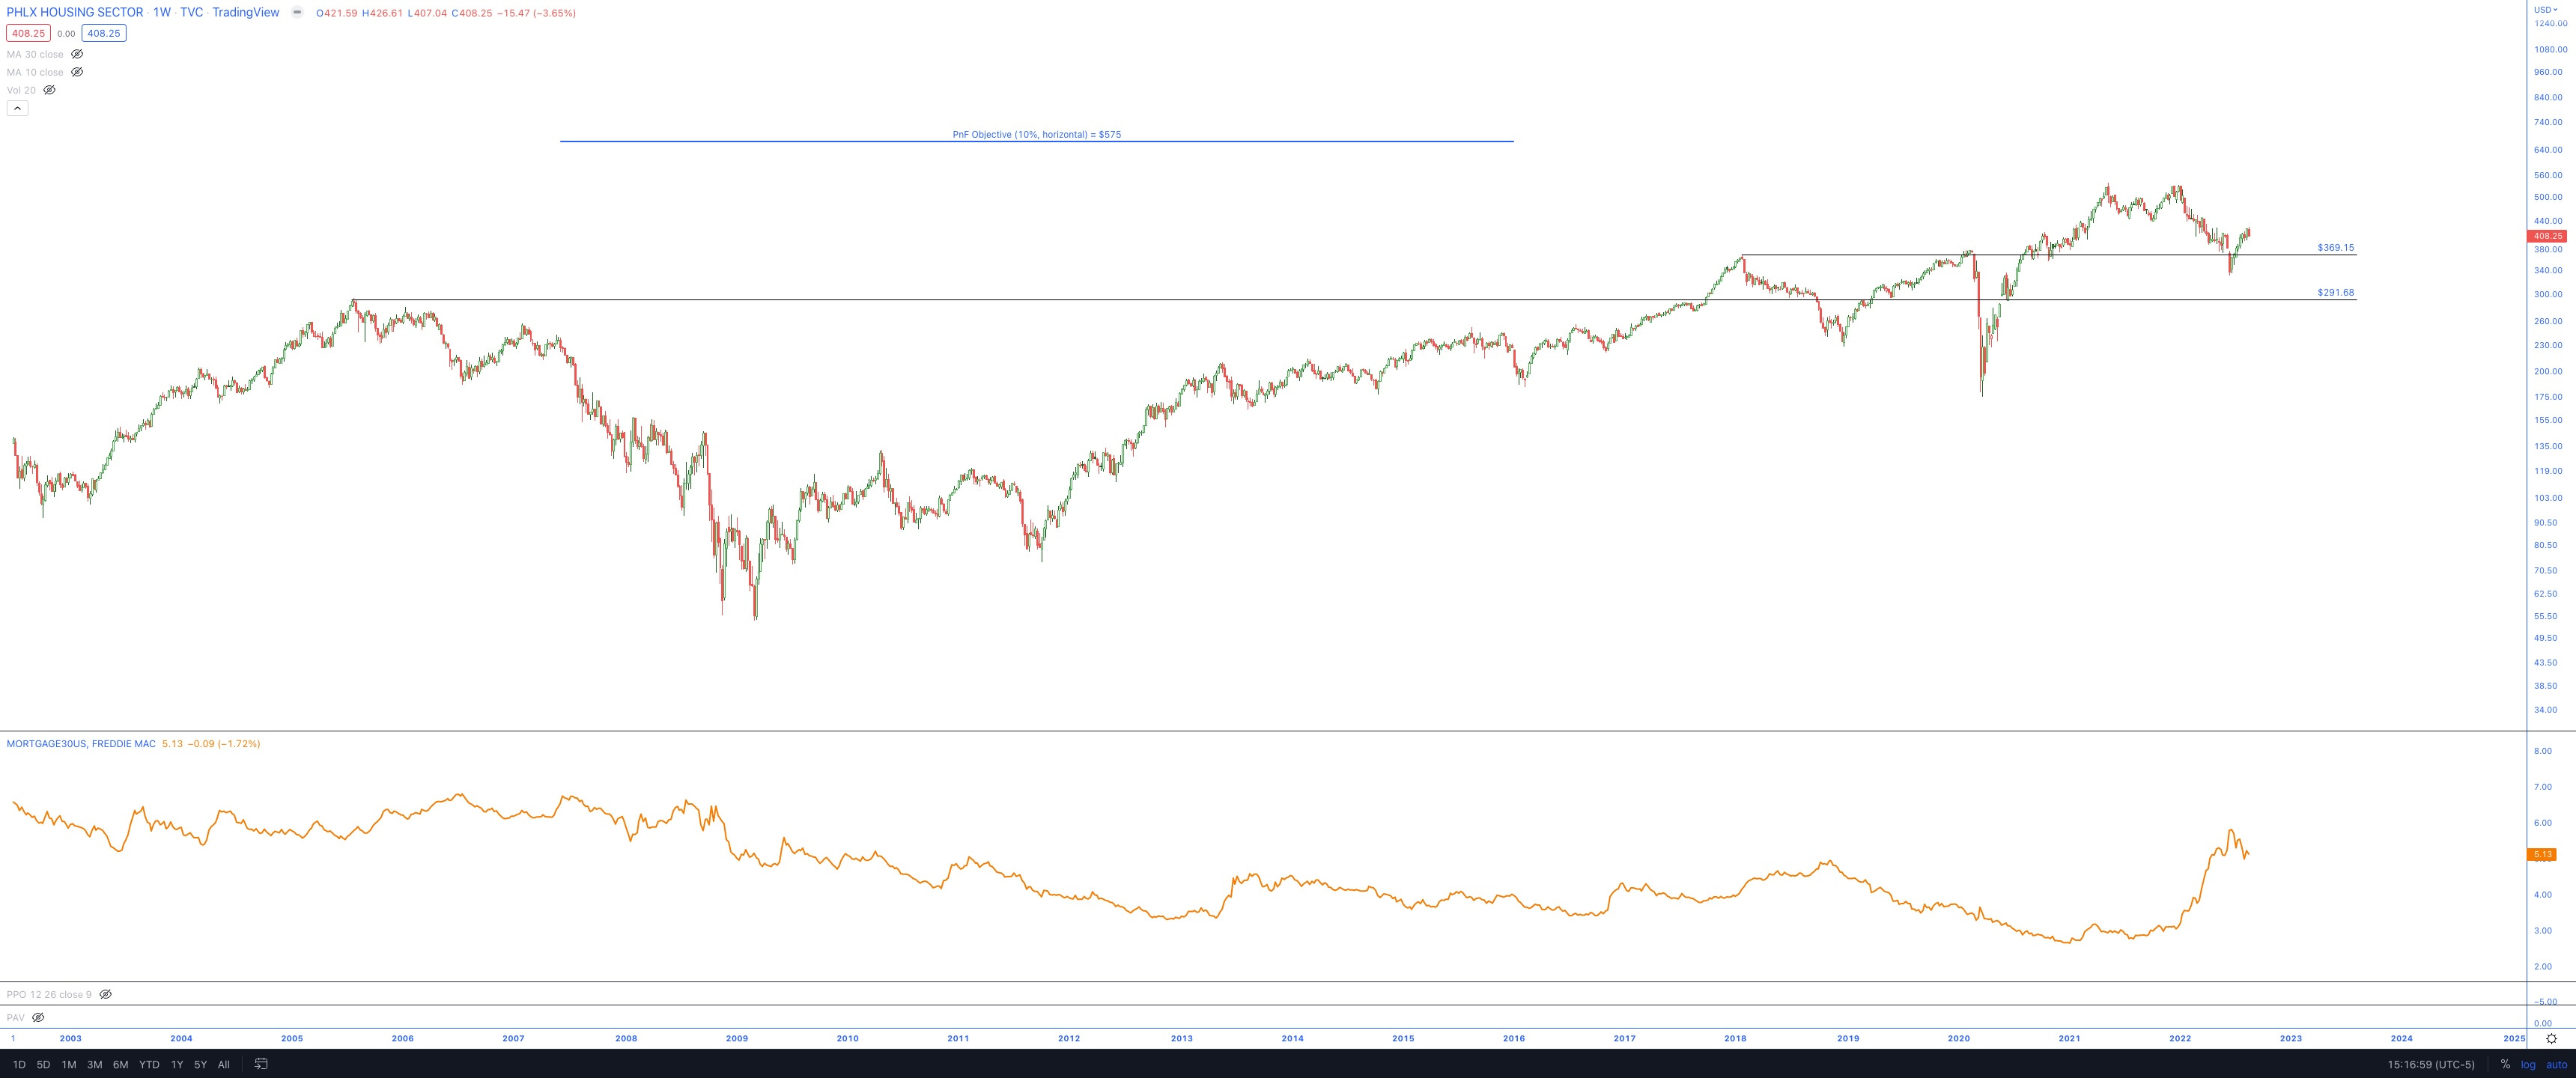
The chart clearly shows an almost perfect inverse correlation
If rates continue rising, I believe my friend will be proven right
30-Year Rates
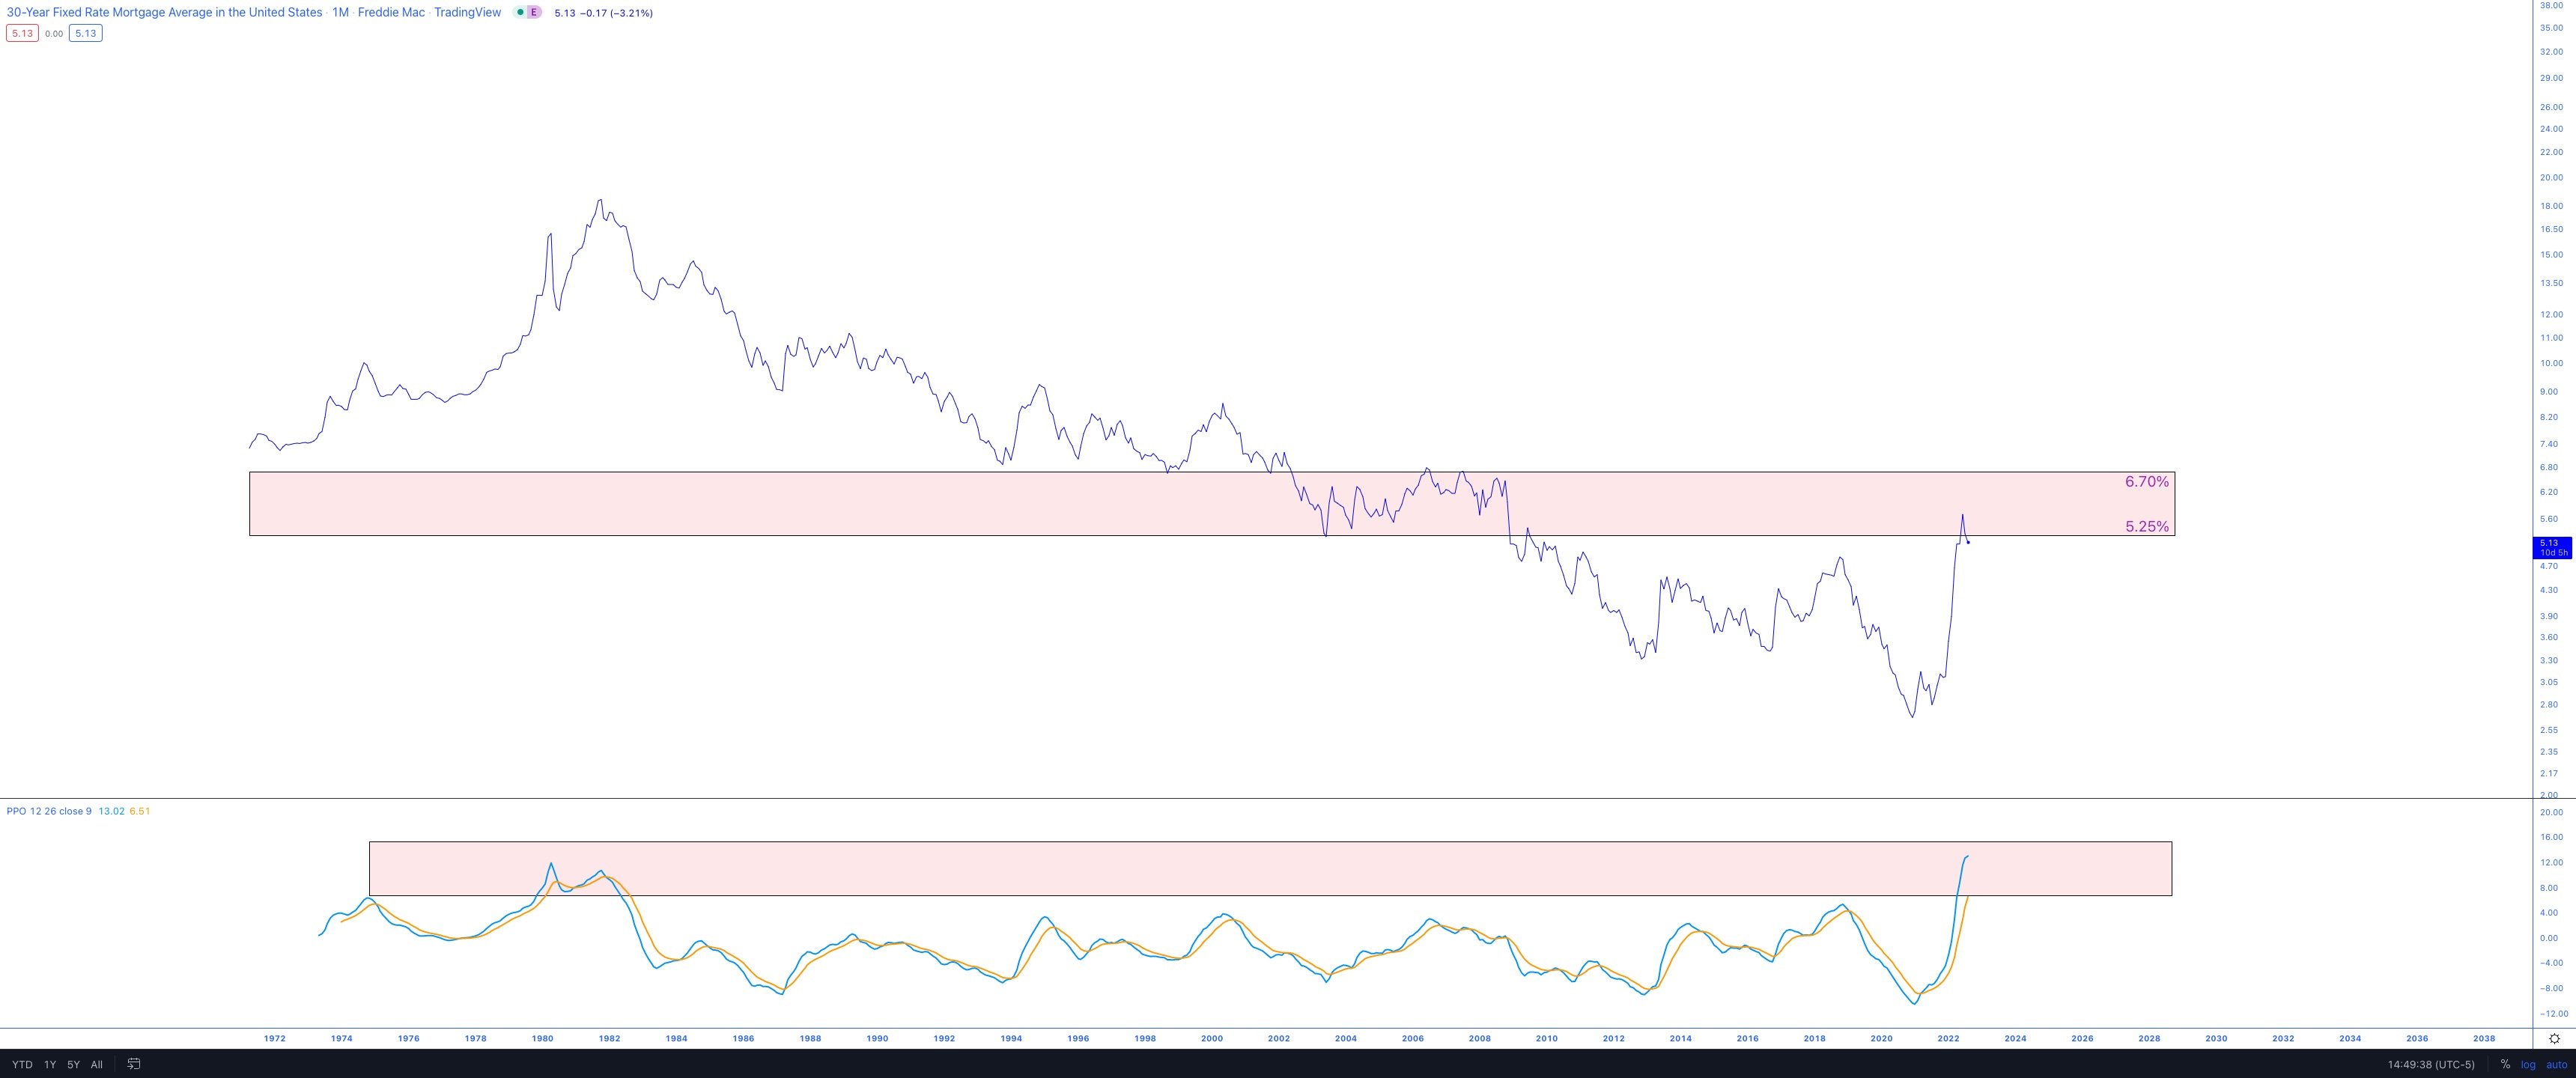
Here is a longer-term chart of the 30-year rates.
The markets have memory, and the interest rates are no exception. As they climbed into the mid-5 % territory, prior support turned to resistance and halted them.
The recent rate halt occurred as the momentum was at the extreme upper end of its historical range.
My opinion:
The housing market may pause, consolidate and go sideways for a while. But I don’t believe it is in a bubble, based on the historical HGX chart only moving 12% from July 2005 to June 2022.
I could be wrong; rates could continue shooting higher, lowering housing prices. It just doesn’t look that way with what I can see in front of me.
Oil: Rally to Resistance or More Downside to Come?
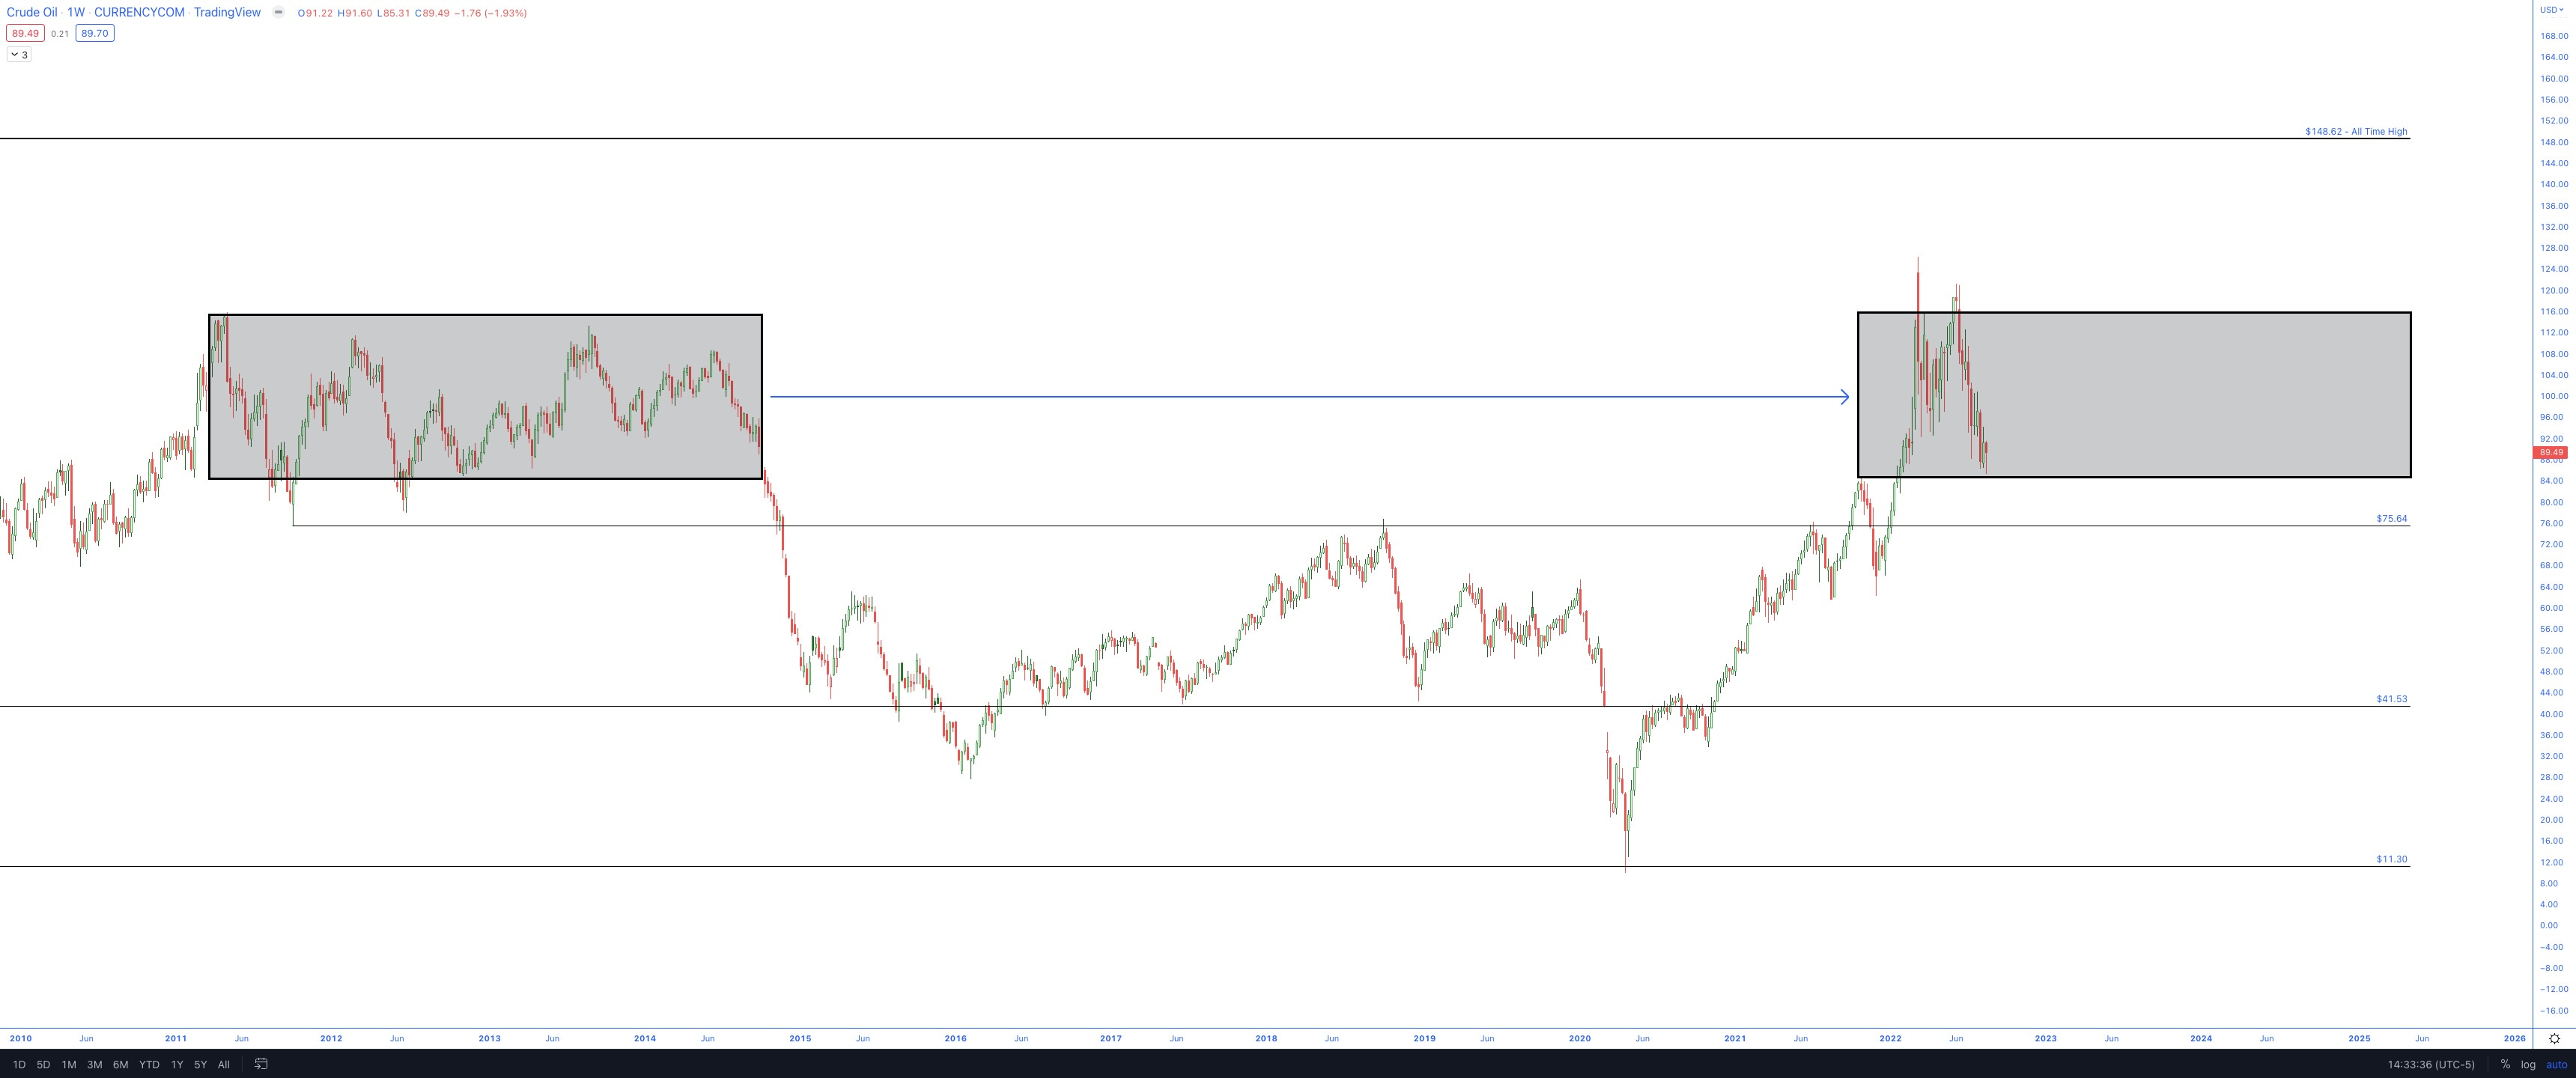
Oil is back to the base area from the analog I shared in January.
The move in 2022 has been very similar to the 2011 move, when Oil dropped to the mid $70s by October, followed by another rapid thrust to the high end of the range.
With that said, I believe there is a scenario for a further decline in oil prices, mainly because of the long-term pitchfork chart I’ve shared previously. So far, it has worked out reasonably close to the prior analog:
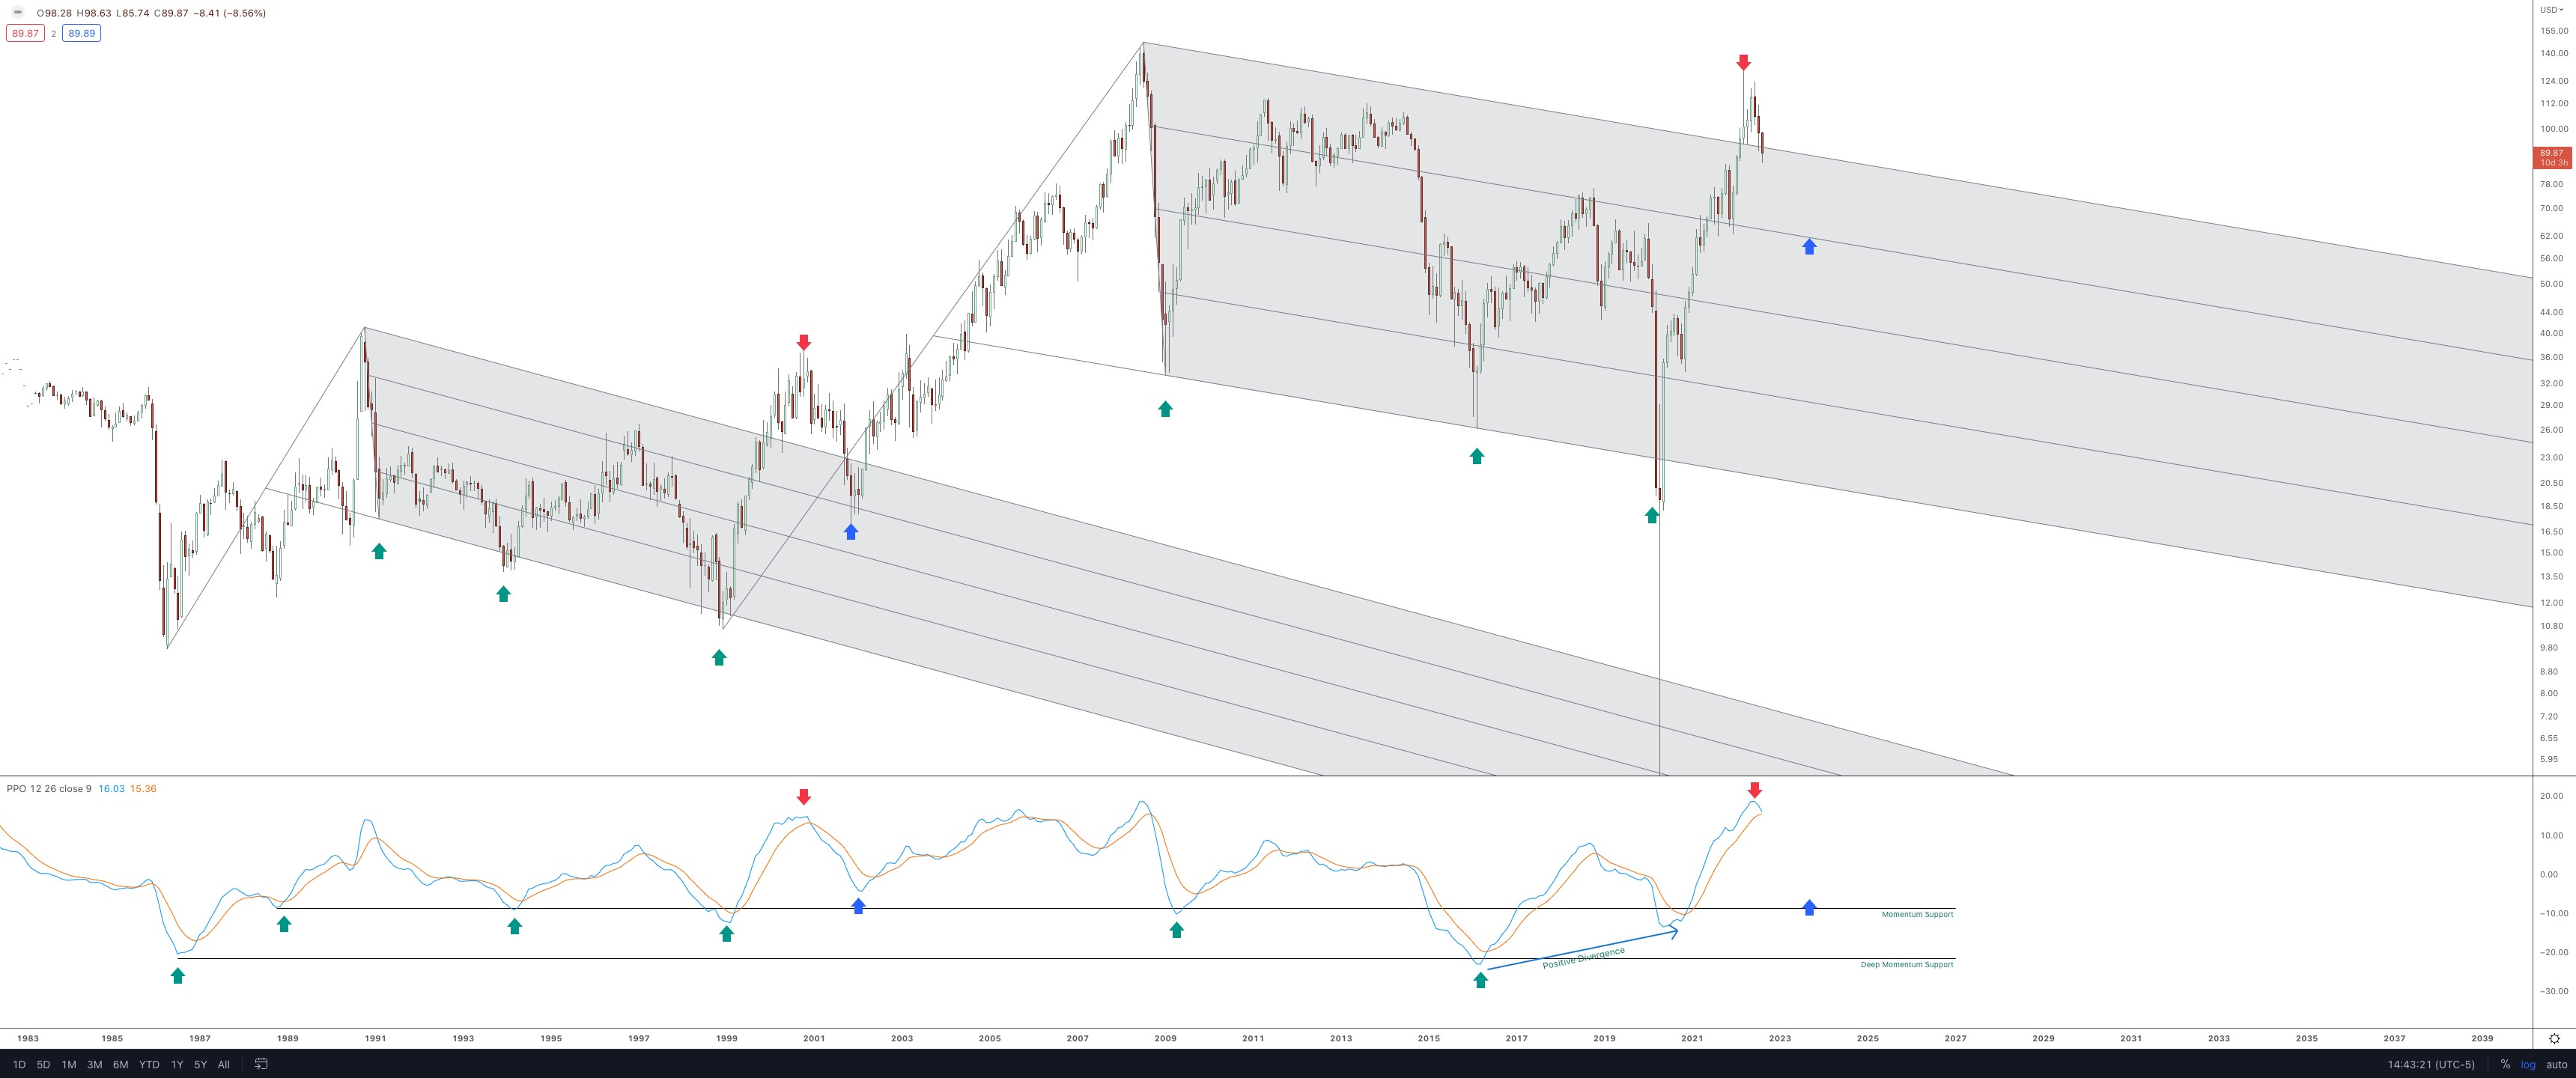
If something like this were to play out, I believe the potential in oil companies would be tremendous.
At that point, perhaps next spring-summer, I would be all over the XLE/XOP/XOM/COP/HES/VLO type of names looking for dated call positions.
Inflation: The 102-Year Trend Line
June 1920. March 1947. March 1980. What do they all have in common? Those were the precise months where the United States YoY inflation rate tagged the 102-Year trend line. Please see the chart below:
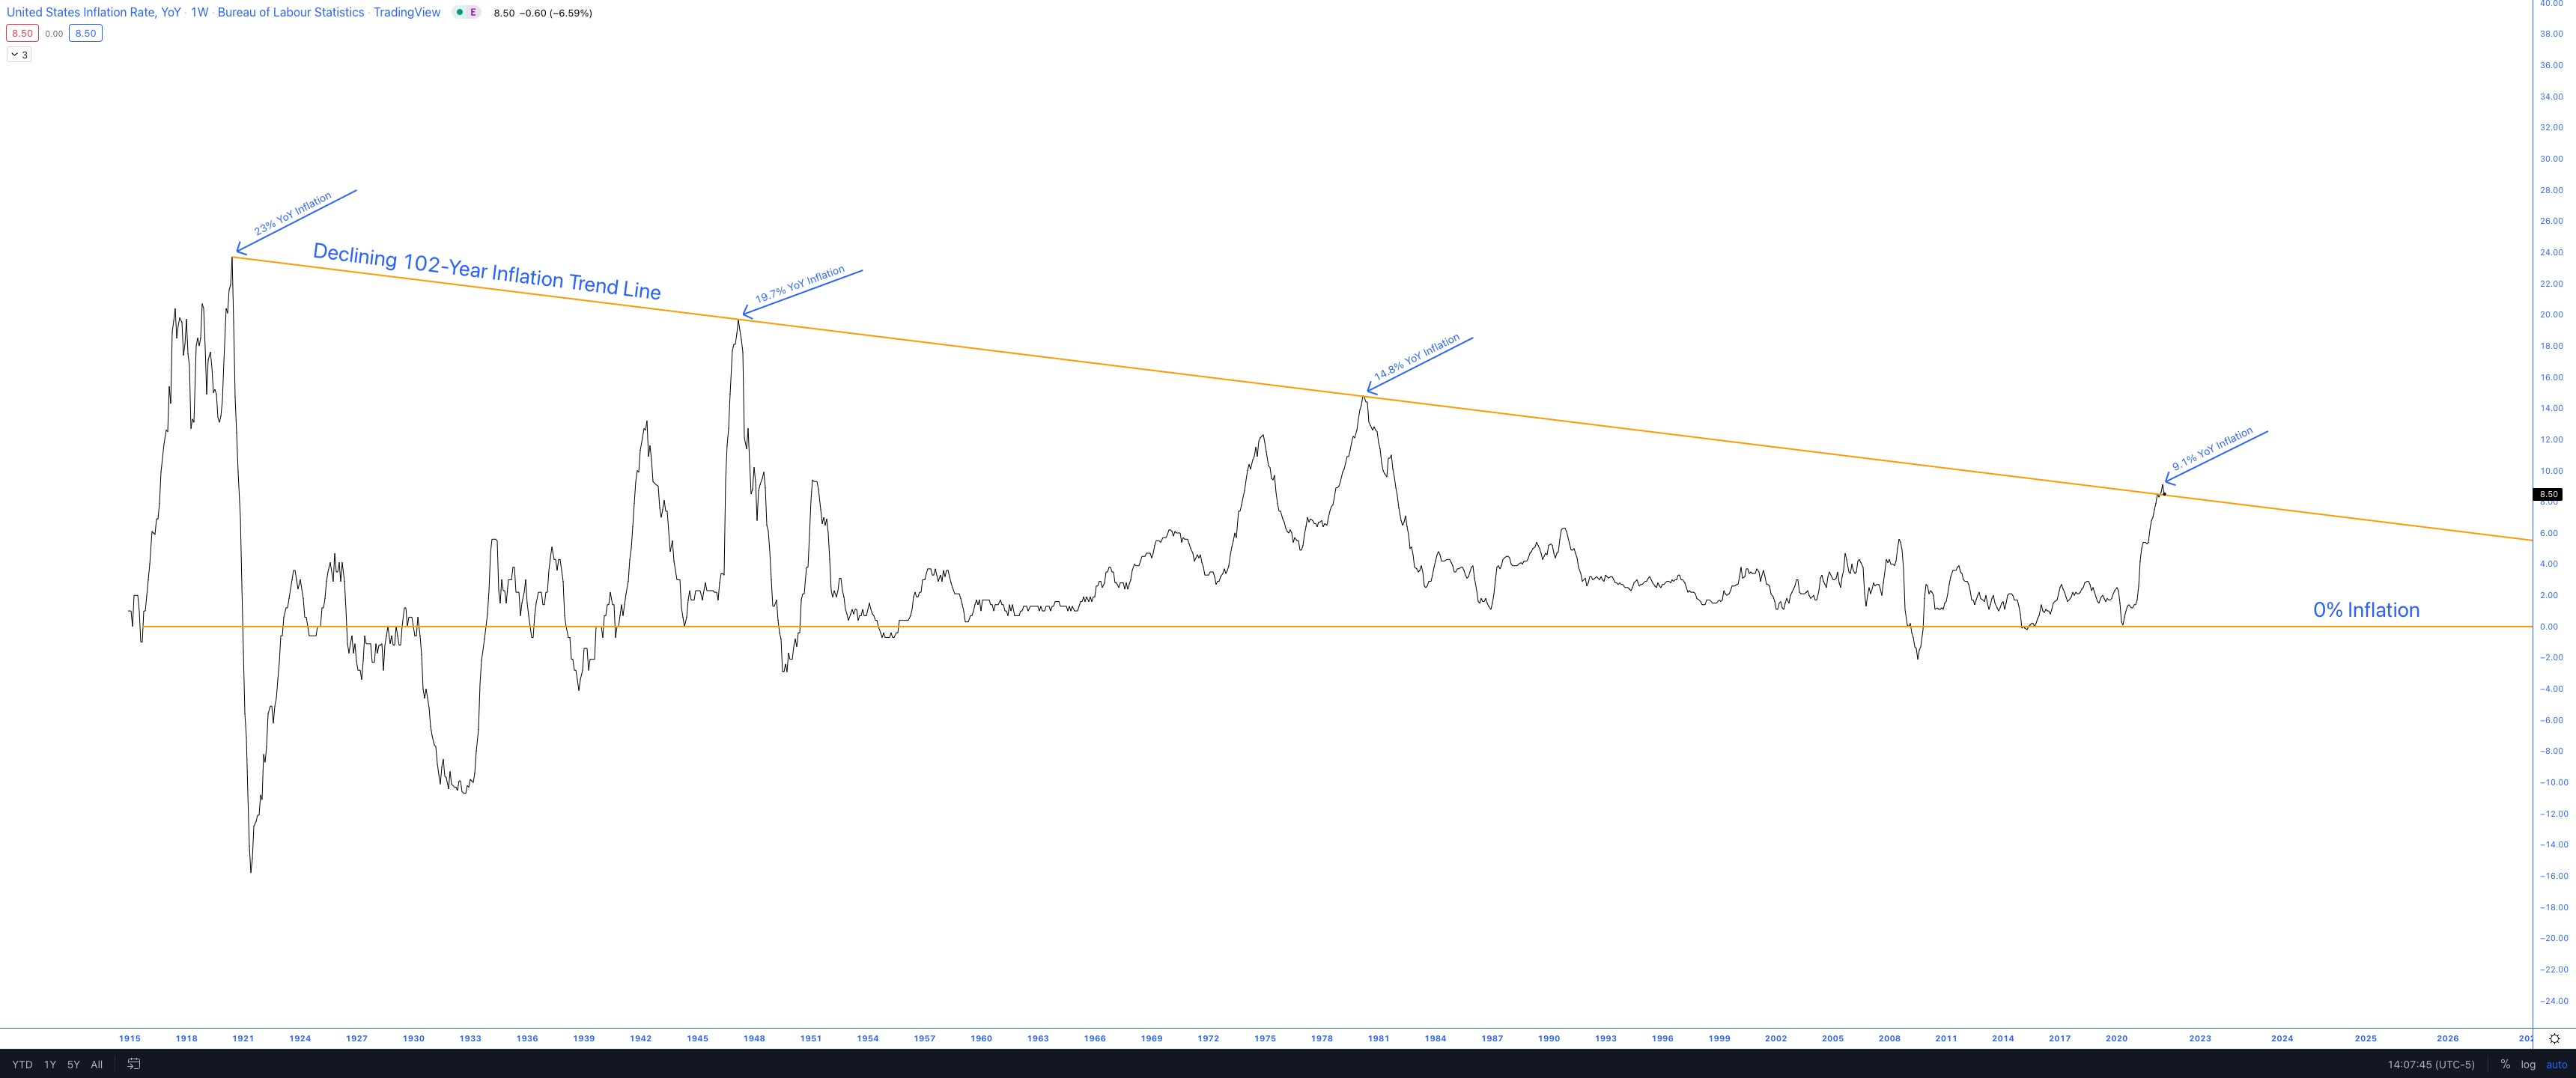
If history repeats, there should be a steady decline over the next 24-36 months into the 1-2% territory. Was May 2022 the end of that trend, or just a deviation? We should have an answer soon.
Even with a steady decline, everything impacted by rising inflation is poised to have drastically higher prices over the 3-4 year period. It compounds quickly.
For example, here are the YoY inflation prints from the last two Mays:
May ‘21: 5.0%
May ‘22: 9.1%
If the YoY inflation rate were to decrease back to 5% in May ‘23 and get down to 2% in May ‘24 (which doesn’t look unreasonable according to the historical reactions from the trend line), the four-year impact would be +22.5%. Pretty steep. I don’t know what it all equates to or the consequences for the markets, but just some food for thought.
Have a great week,
Trace