

Market Outlook 2-27-22
Market Outlook 2-27-22
Be Ready

Good afternoon investors and traders,
Wow. After flipping through hundreds of charts today, I finally see some preliminary signs of the market vigorously defending an area— trying to carve out a bottom desperately. I’m seeing many long wicks and volume (price adjusted) spikes—more on this below.
But before I get into that, I want to reiterate that it’s necessary to remain as objective as possible when participating in the markets. As always, the goal is to stay objective and eliminate emotions as much as humanly possible. We’re all human and bring our emotions to the table— I get it. But from all the successful market legends, the common theme is that they can reduce emotions and subjectivity. In these times of heightened volatility, objectiveness is of paramount importance.
I have been sharing for nearly two months now— and I’ll show again below in the charts— that the futures trends continue to remain objectively bearish via the PnF 45° lines. I cannot count how often I’ve been spared from harmful entries and losses by simply obeying the PnF 45° trends. In all my experiences, the PnF trends have made the most significant difference in my career. Not moving averages, not indicators, not volume. They are all helpful in their ways, but the objective PnF trends trump all.
Back to the markets. Volatility remains elevated, and caution flags should remain up. The bears achieved another one of the distribution objectives last week (NQ futures). I’ve said it before, and I’ll repeat it: In a downtrend, as long as the bears continue to achieve the downside targets, the strength of the said trend is reaffirmed. The same goes for uptrends and bullish targets. For now, I’m seeing the bearish targets confirming the trend lower.
With that disclaimer out of the way and knowing that the predominant trends remain lower, this weekend’s review of charts has given me more bullish optimism than at any time over the past month and a half. Every trend eventually comes to an end. I want to be ready for a pivot higher, with a plan to best capitalize on a new direction. Jumping in early is not my style, so I wait for confirmation, prepared with a plan.
I don’t need to be in the first 20% or last 20% of a move. There’s plenty to be had between the 20s, and man successful trading/investing careers can and have been made that way. Accepting this fact was a giant step in winning the psychological battle against the markets.
Popular tickers with promising setups
I’m going to share a few charts (AAPL, AMZN, TSLA) on some leading names that I think are showing potential setups for higher prices, should the markets indeed be carving out a much-needed bottom.
Market highlights
Getting the bad stuff out of the way first
The major ETFs are all in downtrends
They all remain under the respective 30-week SMAs
They all remain under the 200-day SMAs
VIX is elevated, with a third weekly close in the high 20’s at ~27.5
The 30-minute through 4-hour PnF objective 45° trends remain lower
Now for some good stuff
All four majors closed the week near the highs
All four majors had weekly candles with extremely long wicks underneath the bodies.
The market and its trickiness
As the market often loves to do, this week leaves us with an extreme data point that doesn’t immediately clarify the future direction. But it does help us delineate areas of bullishness and bearishness.
The weekly low wick can be used as a make-or-break pivot
Respect the trend until it breaks.
For the aggressive, this means shorting the bearish trend. For others, it means raising cash and respecting stops on the way down.
Be ready with a plan.
Have some targeted names and create a watchlist. Below I’ll share a few and explain how I’m looking at their charts.
Add some alerts for critical levels.
Keep dry powder available to capitalize with.
Weekly Charts
DIA
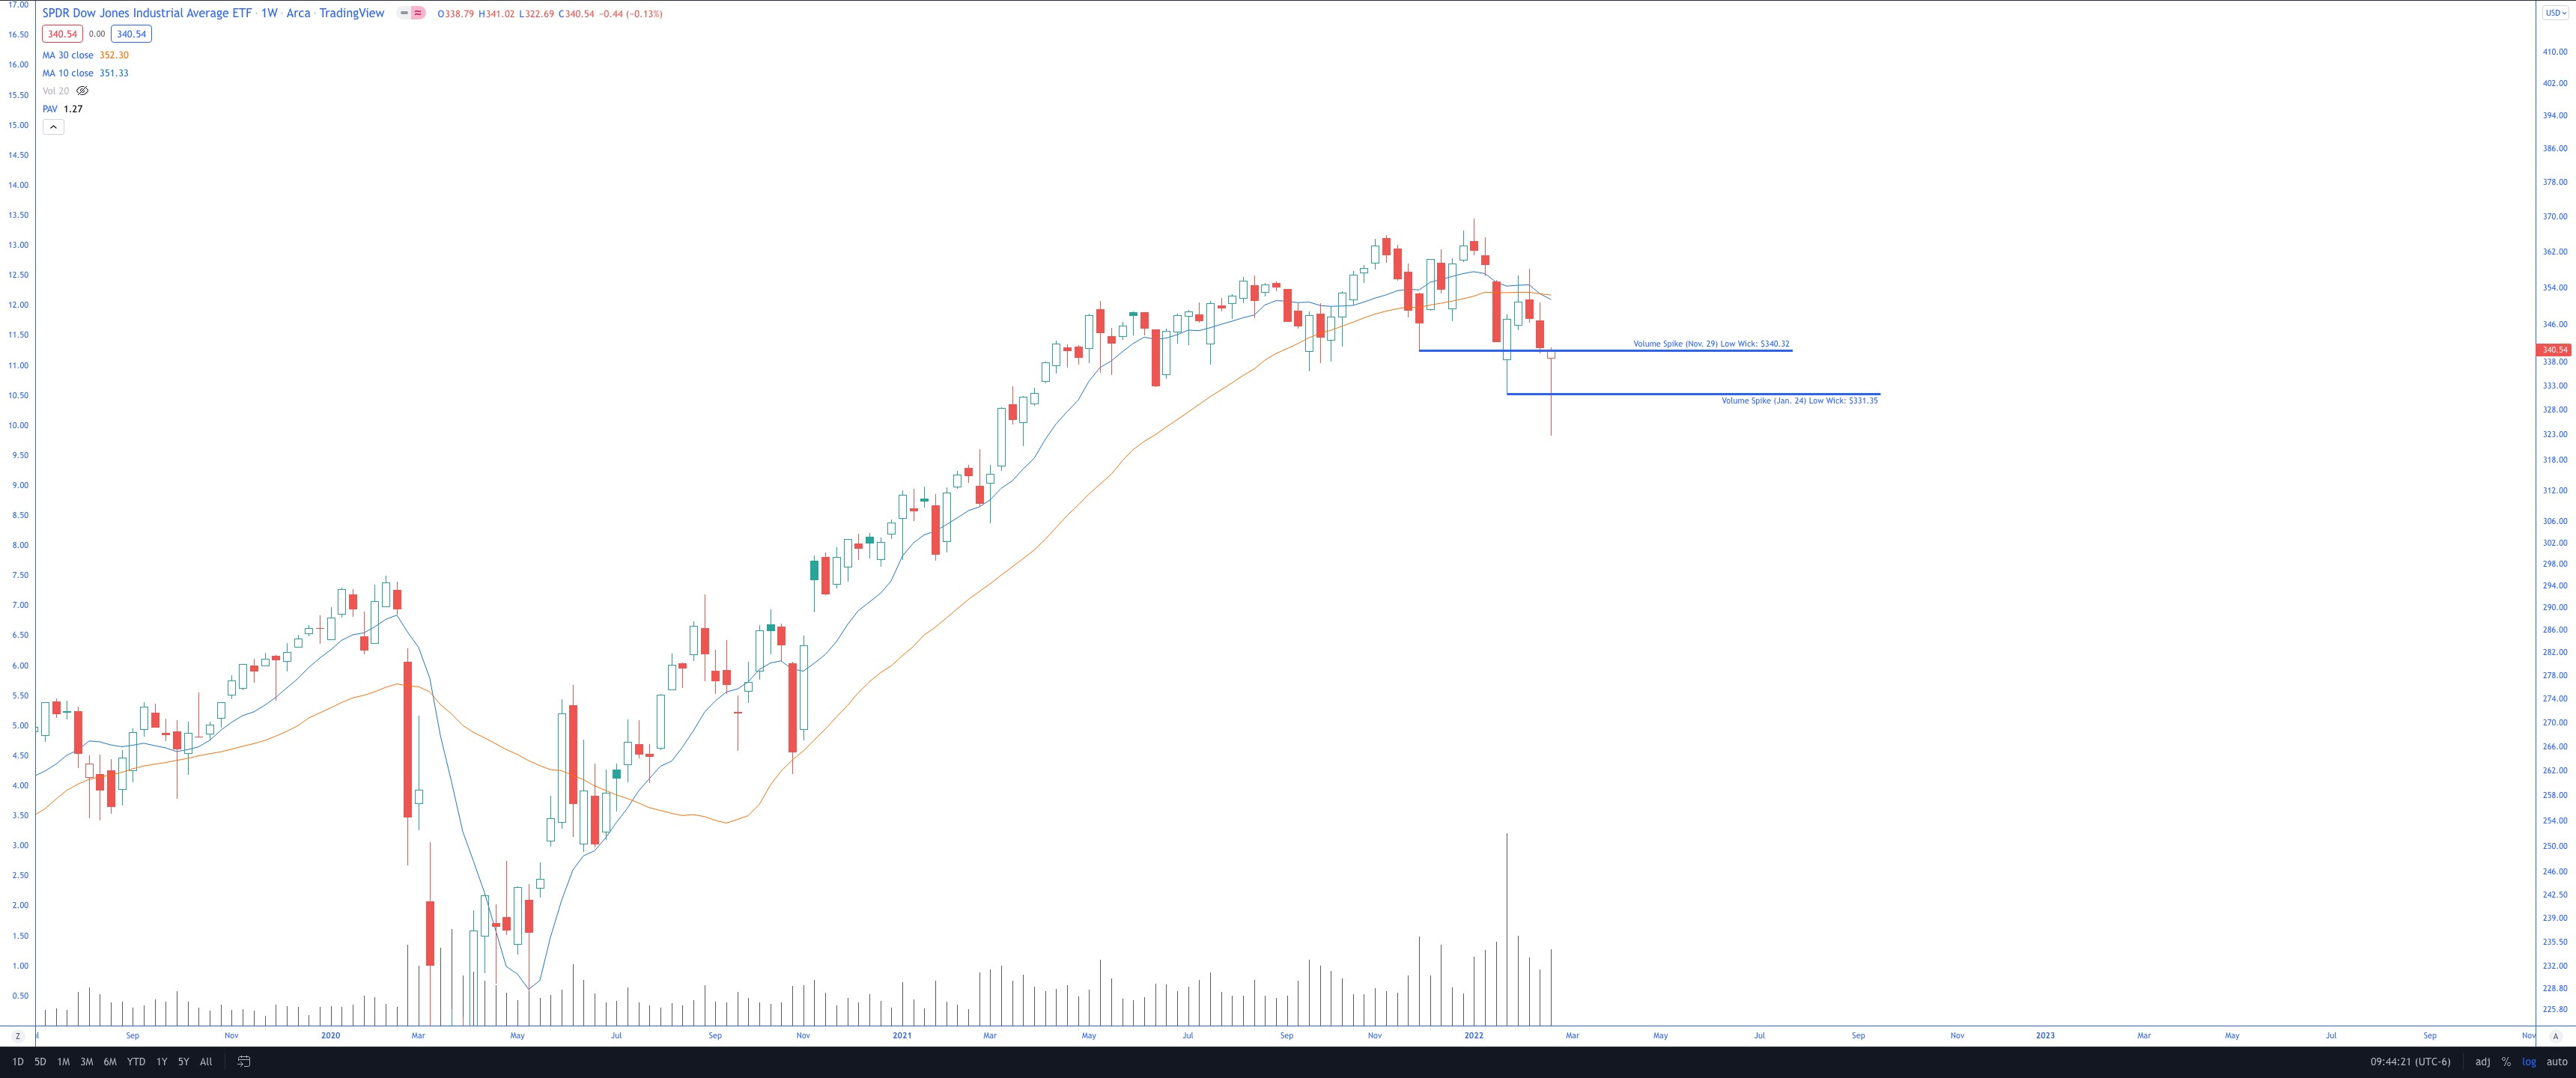
In one of the most impressive weeks I’ve seen, the DIA weekly candle not only took out the stops below the Jan. 24 weekly candle lows, but it also took out the stops above the Nov. 29 weekly candle lows. In one week, stops were run on both sides, ending nearly flat for the week. “Screw the most people.”
It’s hard to see on the chart, but DIA did close above the Nov. 29 weekly lows - which I continue to regard as a fundamental level due to the price-adjusted volume spike that occurred during that week. DIA is the only major to close above this (Nov. 29 weekly candle low) level.
With that said:
DIA put the 10-week SMA / 30-week SMA bearish crossover in this week. Another sign of a downtrend.
And, of course, DIA remains below both key moving averages.
Keep reading with a 7-day free trial
Subscribe to Charts For Freedom to keep reading this post and get 7 days of free access to the full post archives.