

Market Outlook 18-Sep-22
Market Outlook 18-Sep-22
Sentiment, Seasonality & 21-Day Scans, An Emerging Leader for Next Rally

Good afternoon traders and investors,
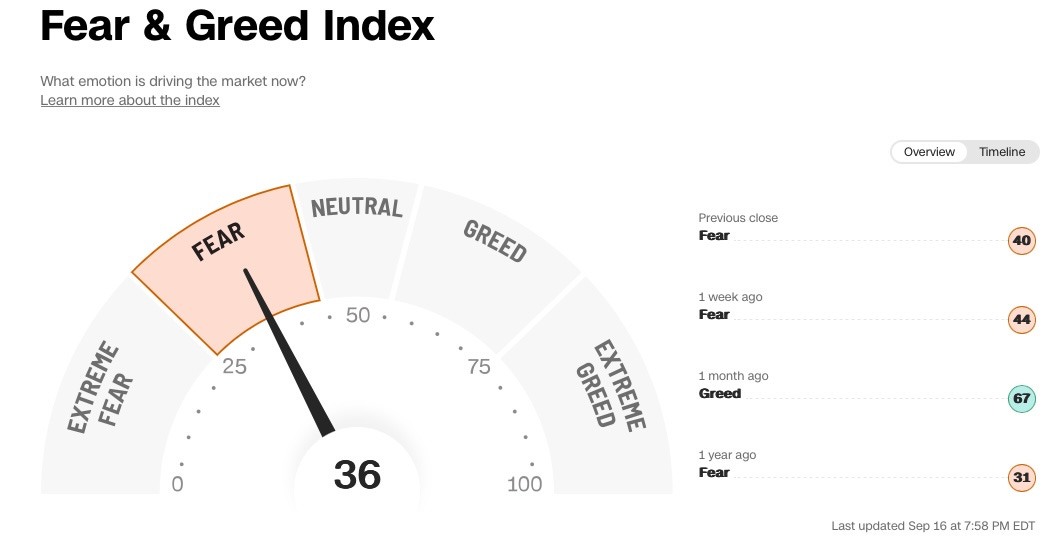
The market whipsaw continues. SPX has now given back most of the June-August rally gains, closing only 5% above the June lows. The sentiment is justifiably bearish with the market’s pullback (11% decline in SPX over five weeks).
Here is the Fear and Greed index (courtesy of CNN)
Today I wanted to focus on the seasonality during midterm election years and the spillover into the pre-election years. I believe now is a perfect time to get a refresher on seasonal trends, as the bearish-to-bullish seasonality transition is poised to occur in two weeks. Please see below.
Seasonality
On April 24, I shared the midterm election year seasonality in my Market Outlook.

Here is the chart from that post I want to highlight now:
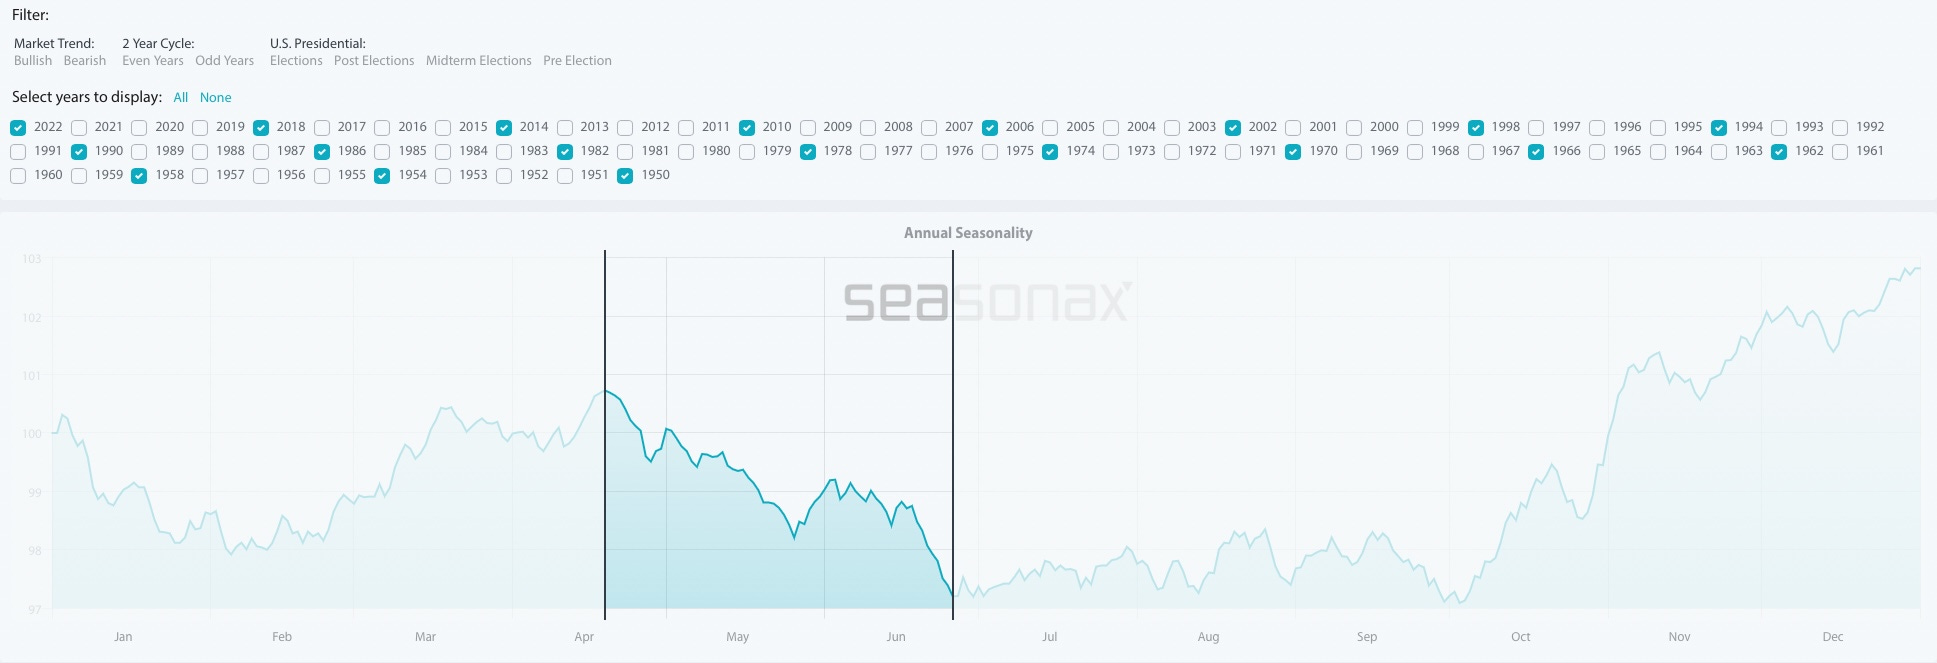
From mid-April through mid-June, there wasn’t much forecasted help for the bulls, and coincidentally the market bottomed in the June 13th weekly candle.
The period from mid-June through the end of September is choppy (result = flat). There are two more trading weeks in this period.
The early-October to year-end period is historically very bullish.
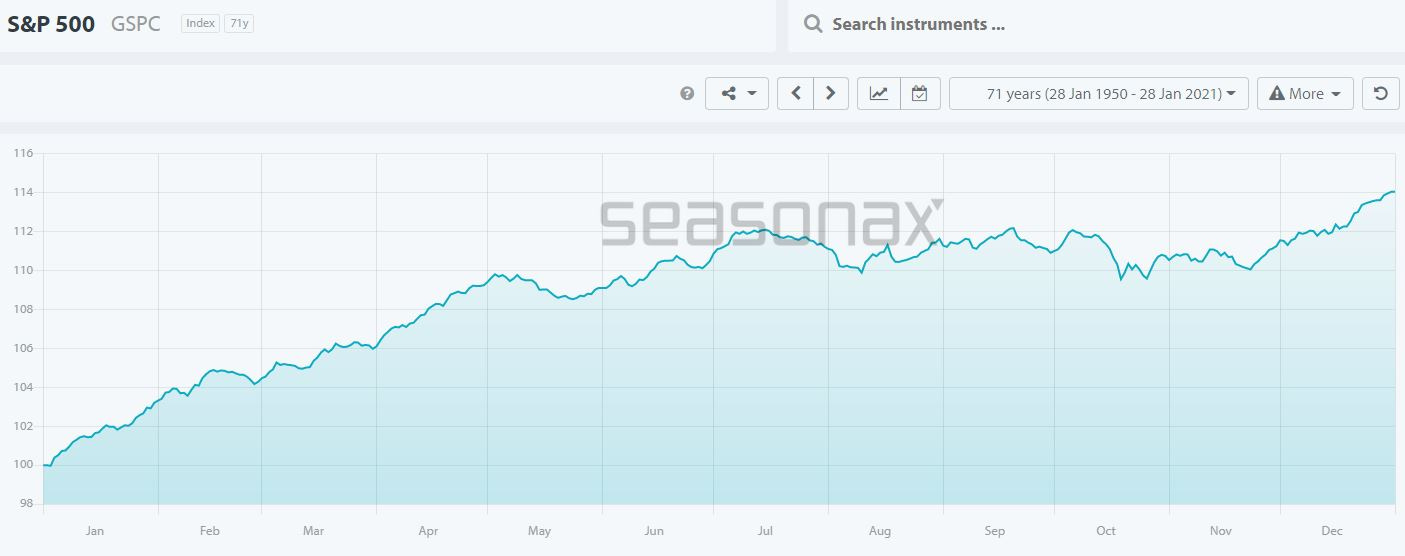
S&P 500 Midterm Election Year Seasonal Pattern Since 1946
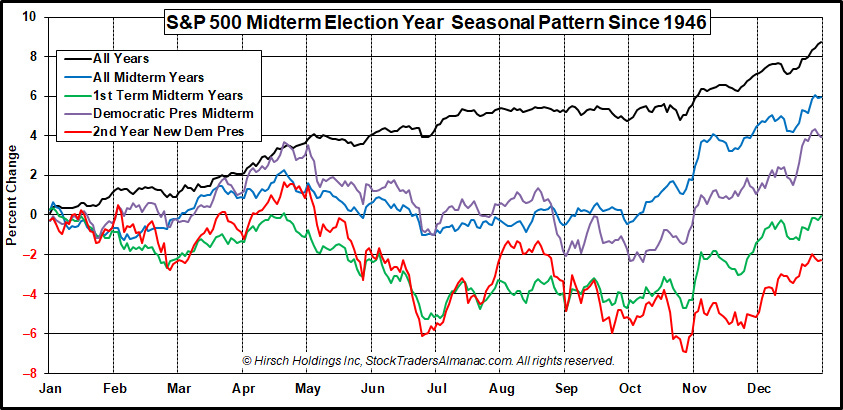
The above chart is one I found as I searched for seasonality from different sources, confirming what was shared in the Seasonax chart.
It adds a few more comparison patterns, including the print with a Democratic President.
In all but one plot (2nd Year new Dem Pres), the seasonality pivots in early October, with a reversing action to the upside.
SPY Weekly Chart
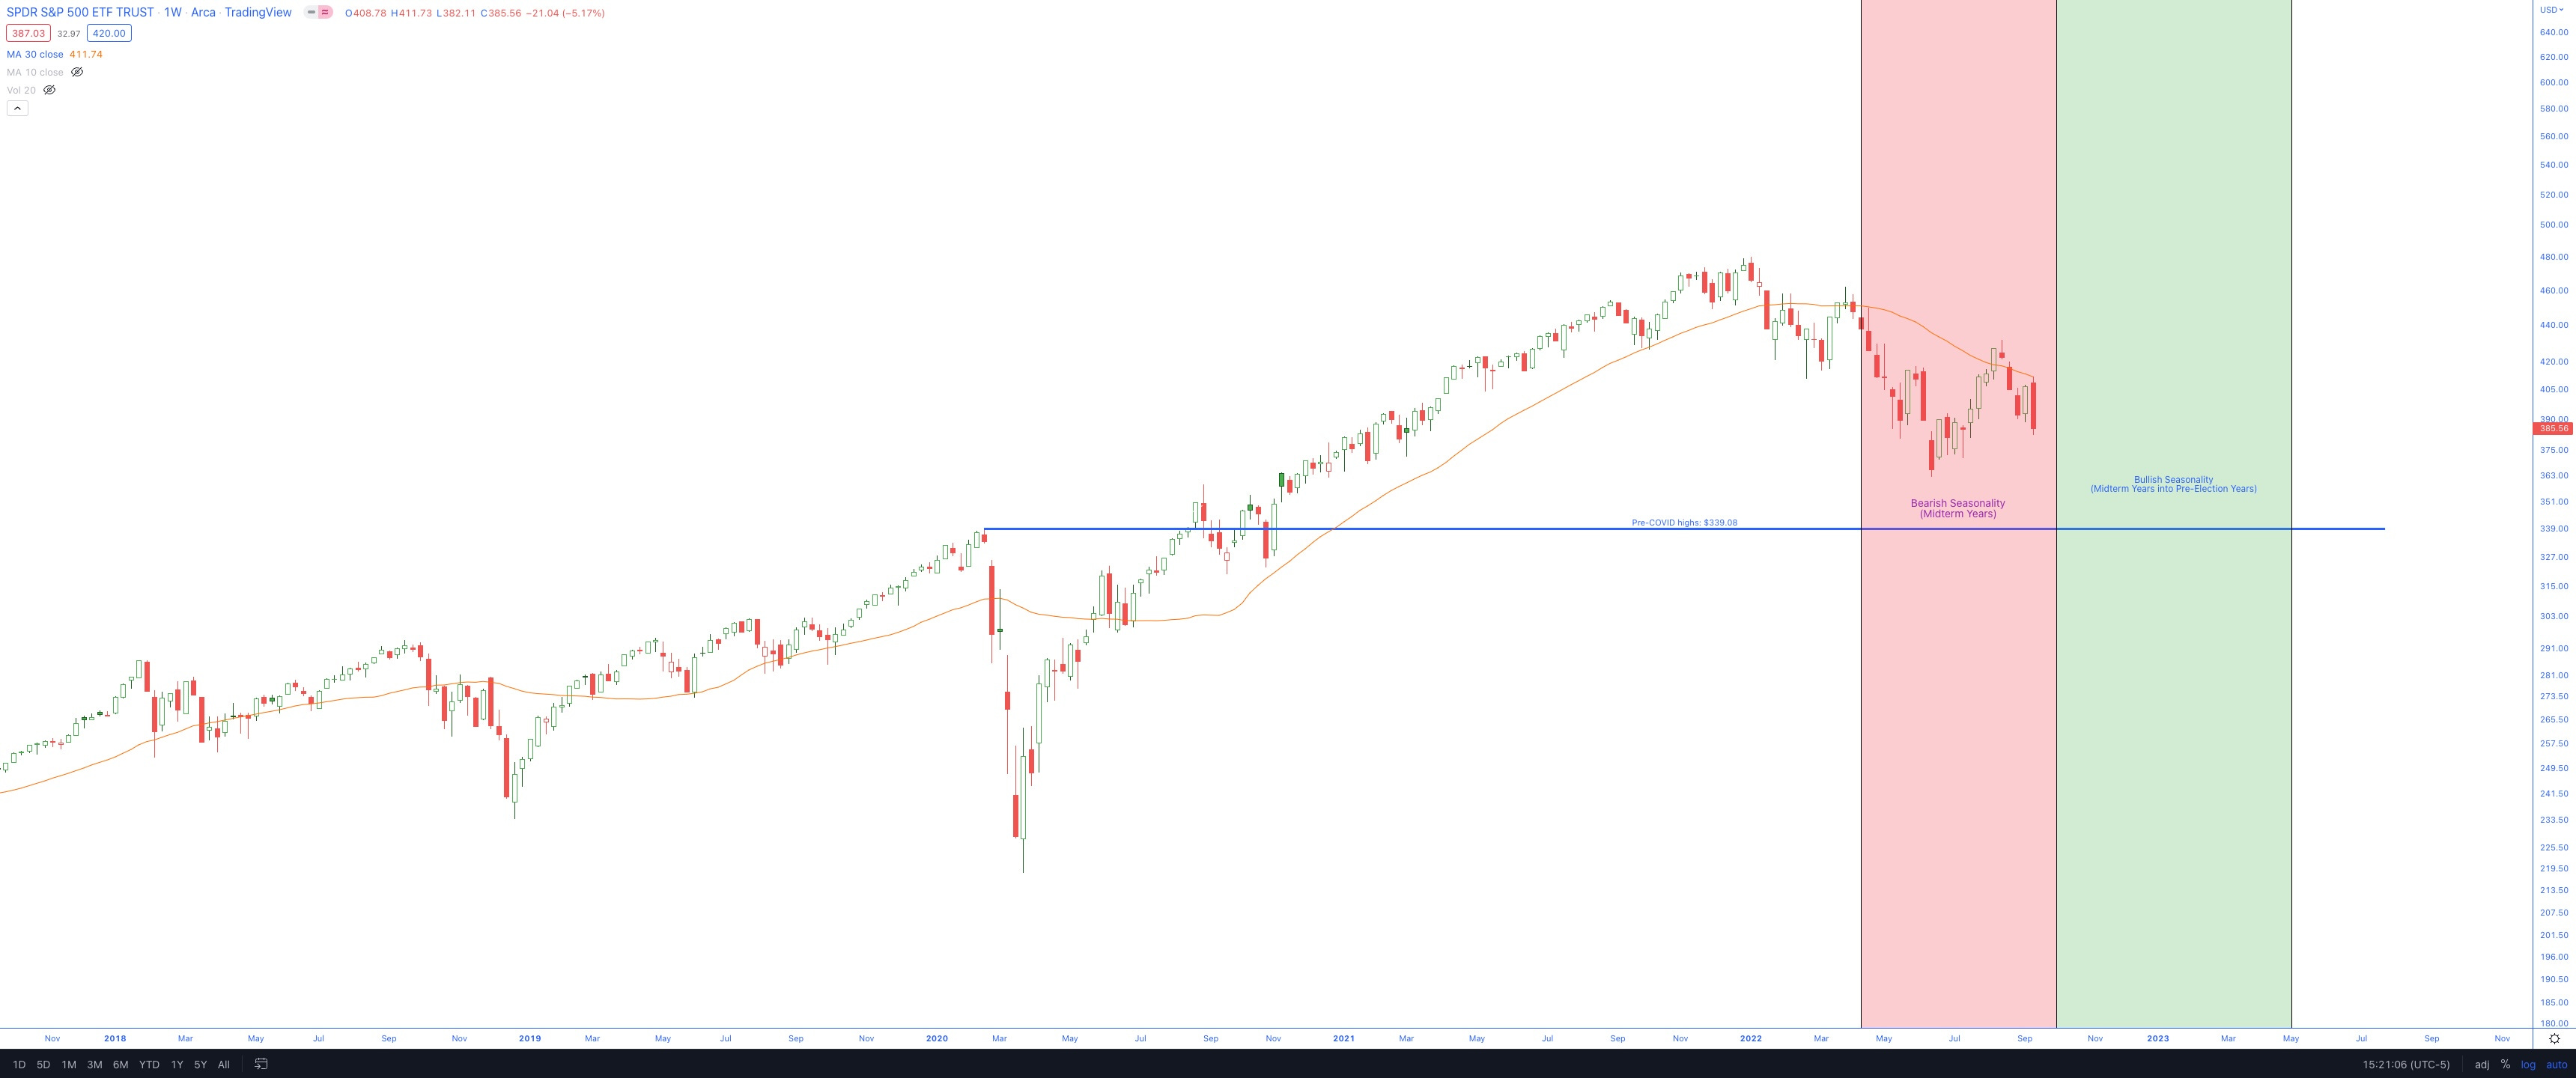
In the above chart, I’ve shaded the regions of bearish (red) and bullish (green) seasonality.
I’ve extended the green period through the end of March 2023 due to the pre-Election year bullish seasonality.
Pre-Election Year Seasonality
Some good news for the bulls: The bullish seasonality doesn’t stop at year-end. It continues until the end of April.
My takeaway:
I want to be prepared for the pending six-month stretch of bullish seasonality. I know the flip from bearish to bullish winds is not guaranteed. But I also understand that the market has incredible methods and capabilities of luring in and trapping enough people at the most unfortunate time. Perhaps the next two weeks will do the trick.
“If it doesn’t shake them out, it will wear them out.”
I should note that the market decline started before the mid-April top. By mid-April, the market was already 5% below the highs from ‘21. So the seasonality isn’t always going to be precise. It is just a tool to use with the other tools one uses.
21 Day Scans
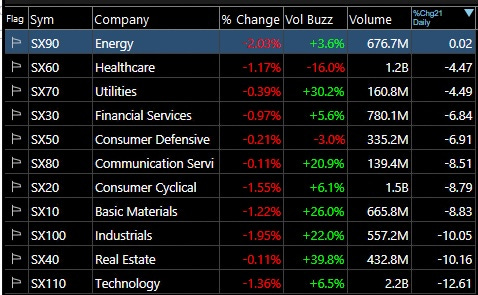
Above are scan results of Sector performances over the last 21 days. The only one with positive returns (barely) was Energy. In a period where crude oil was down 8.5%, the Energy sector was flat. To me, that is a huge clue the market is giving out.
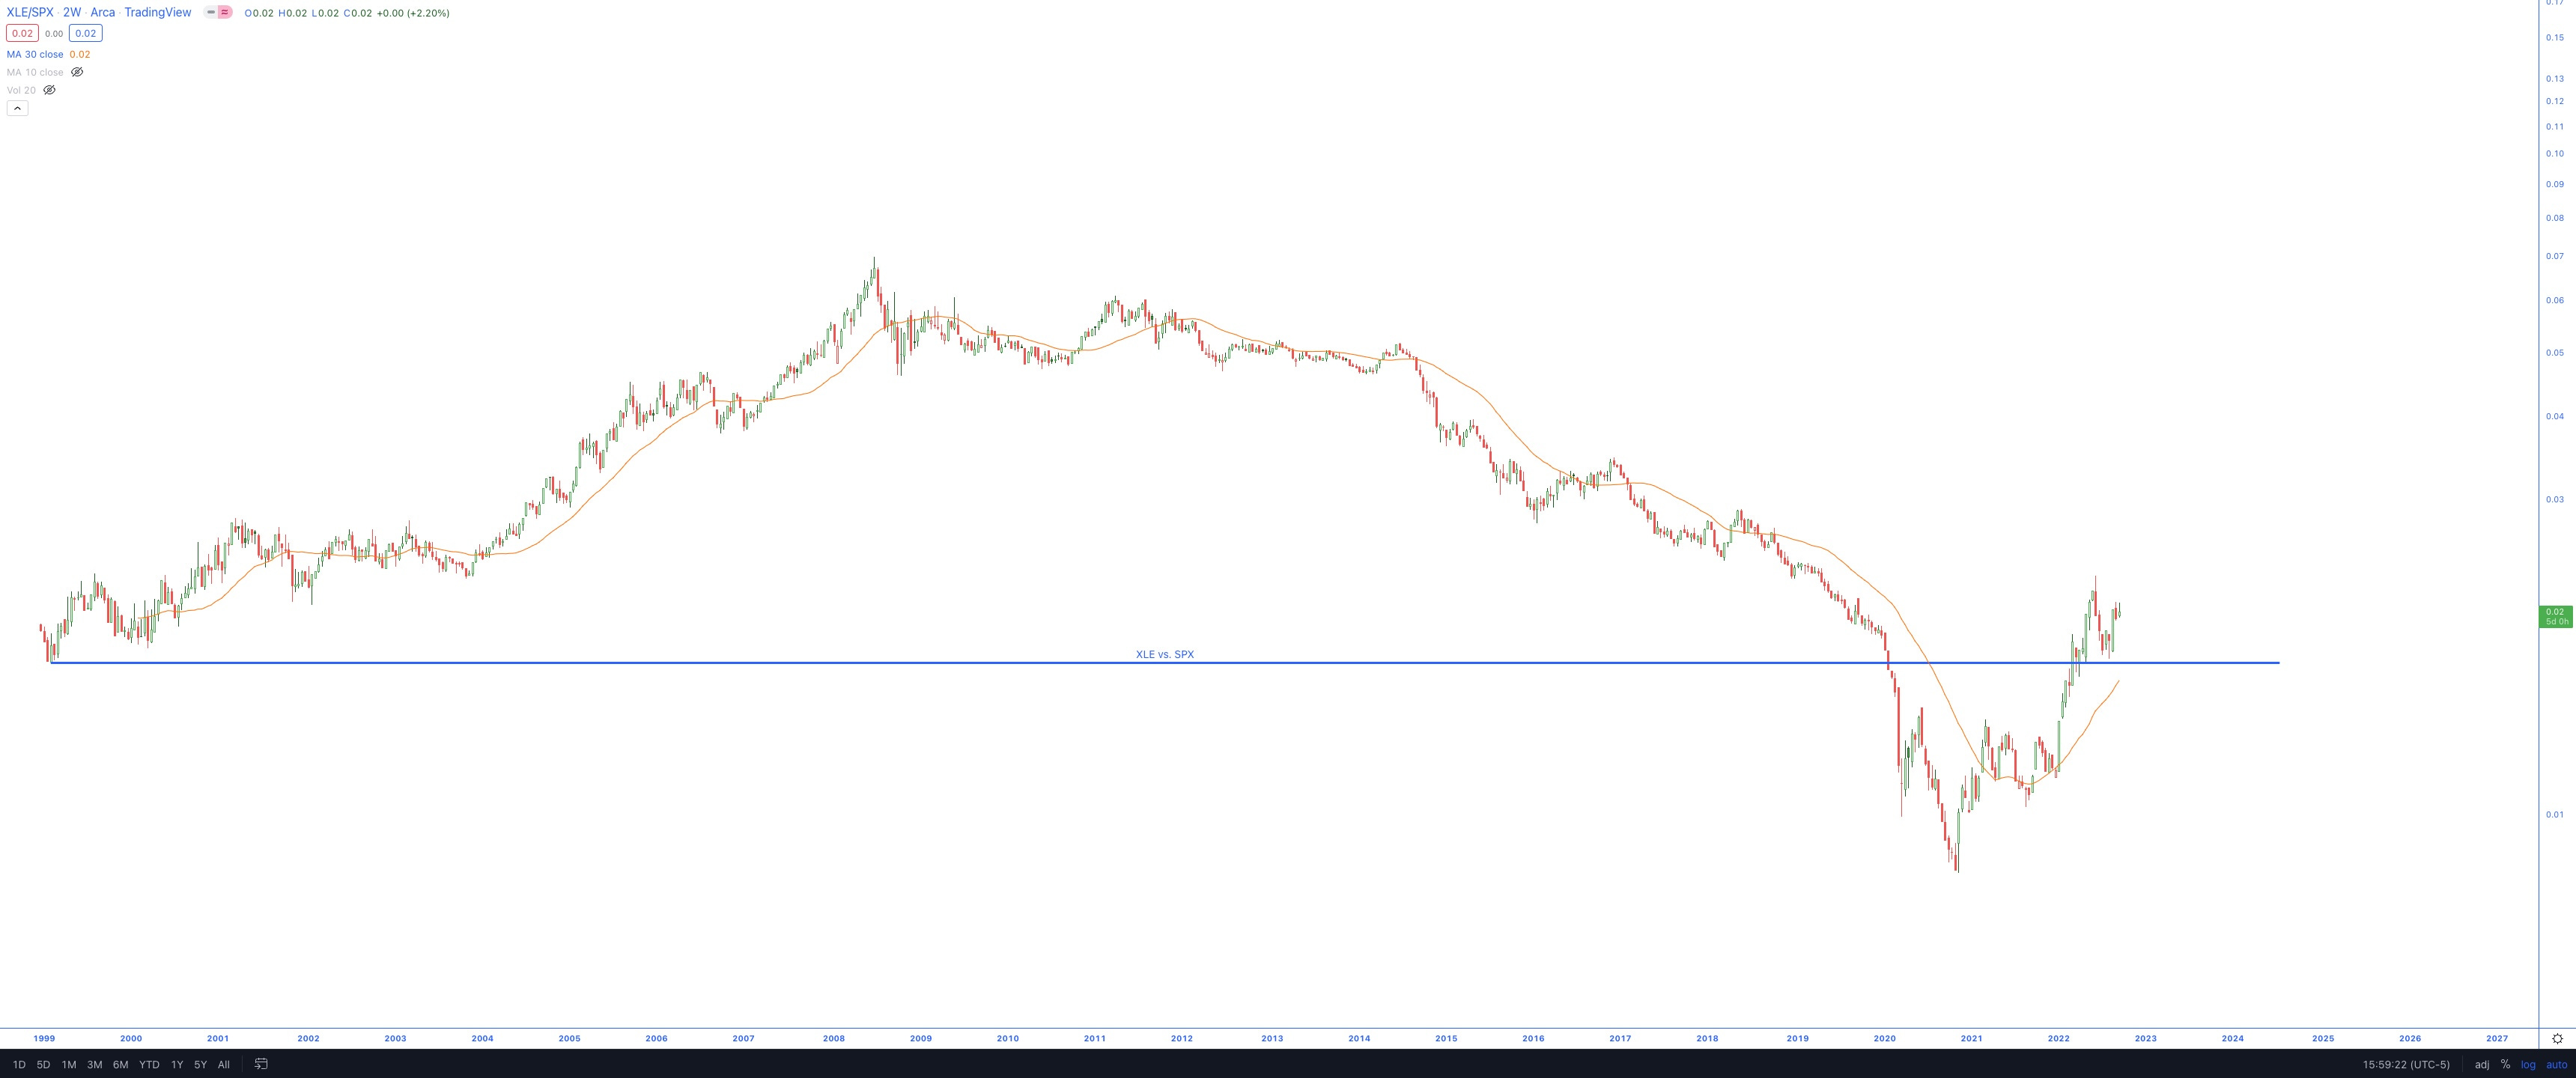
Using XLE as a proxy, here are some relative strength charts of Energy vs. SPX & NDX.
XLE vs. SPX
XLE vs. NDX
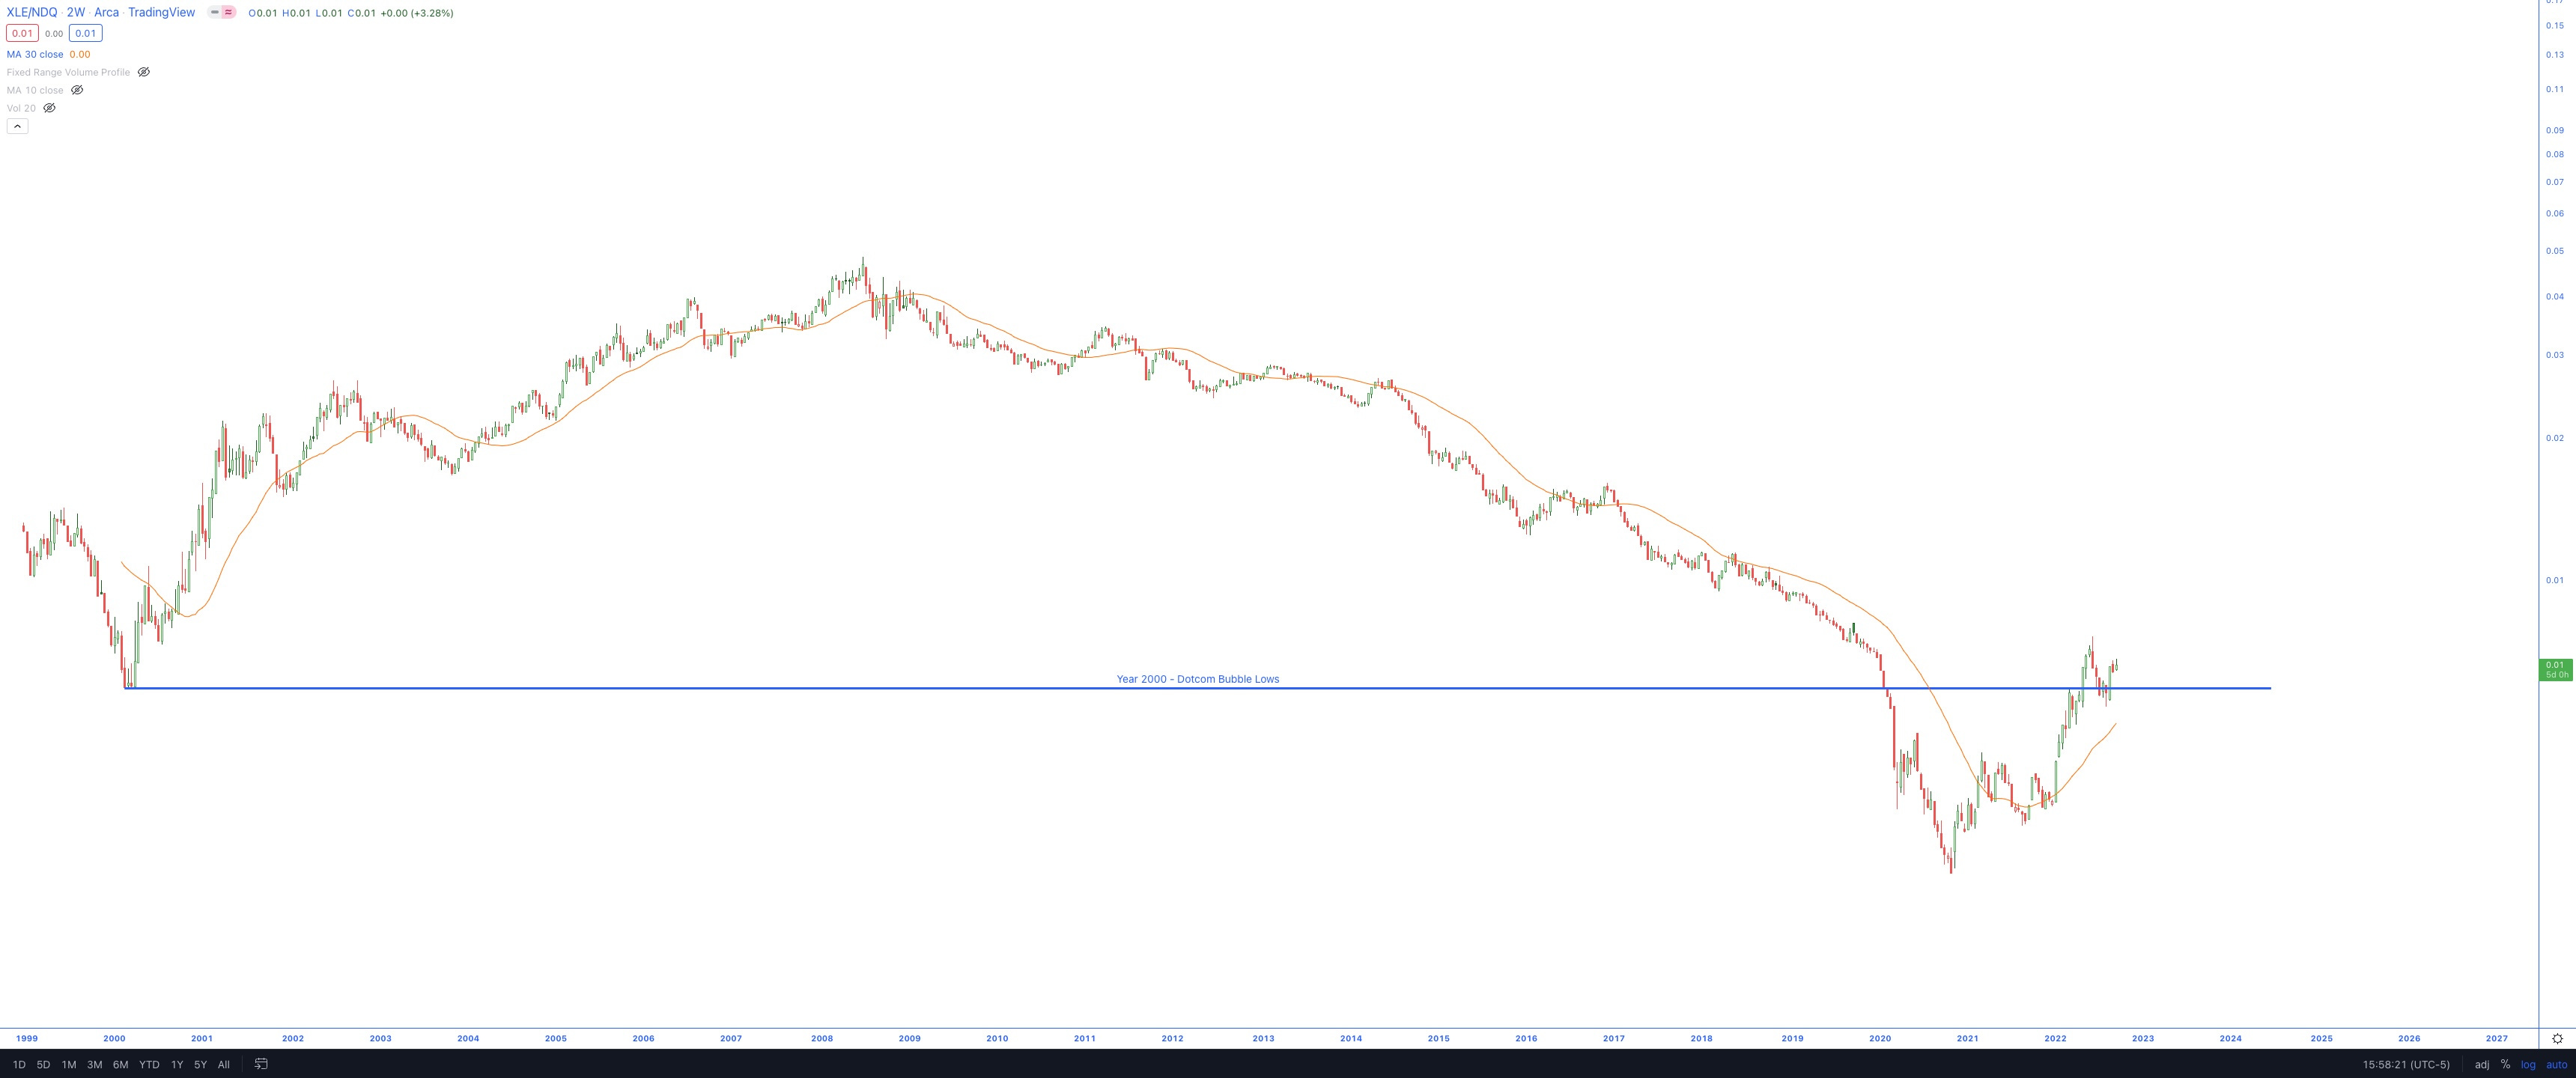
XLE - A reaccumulation pending completion?
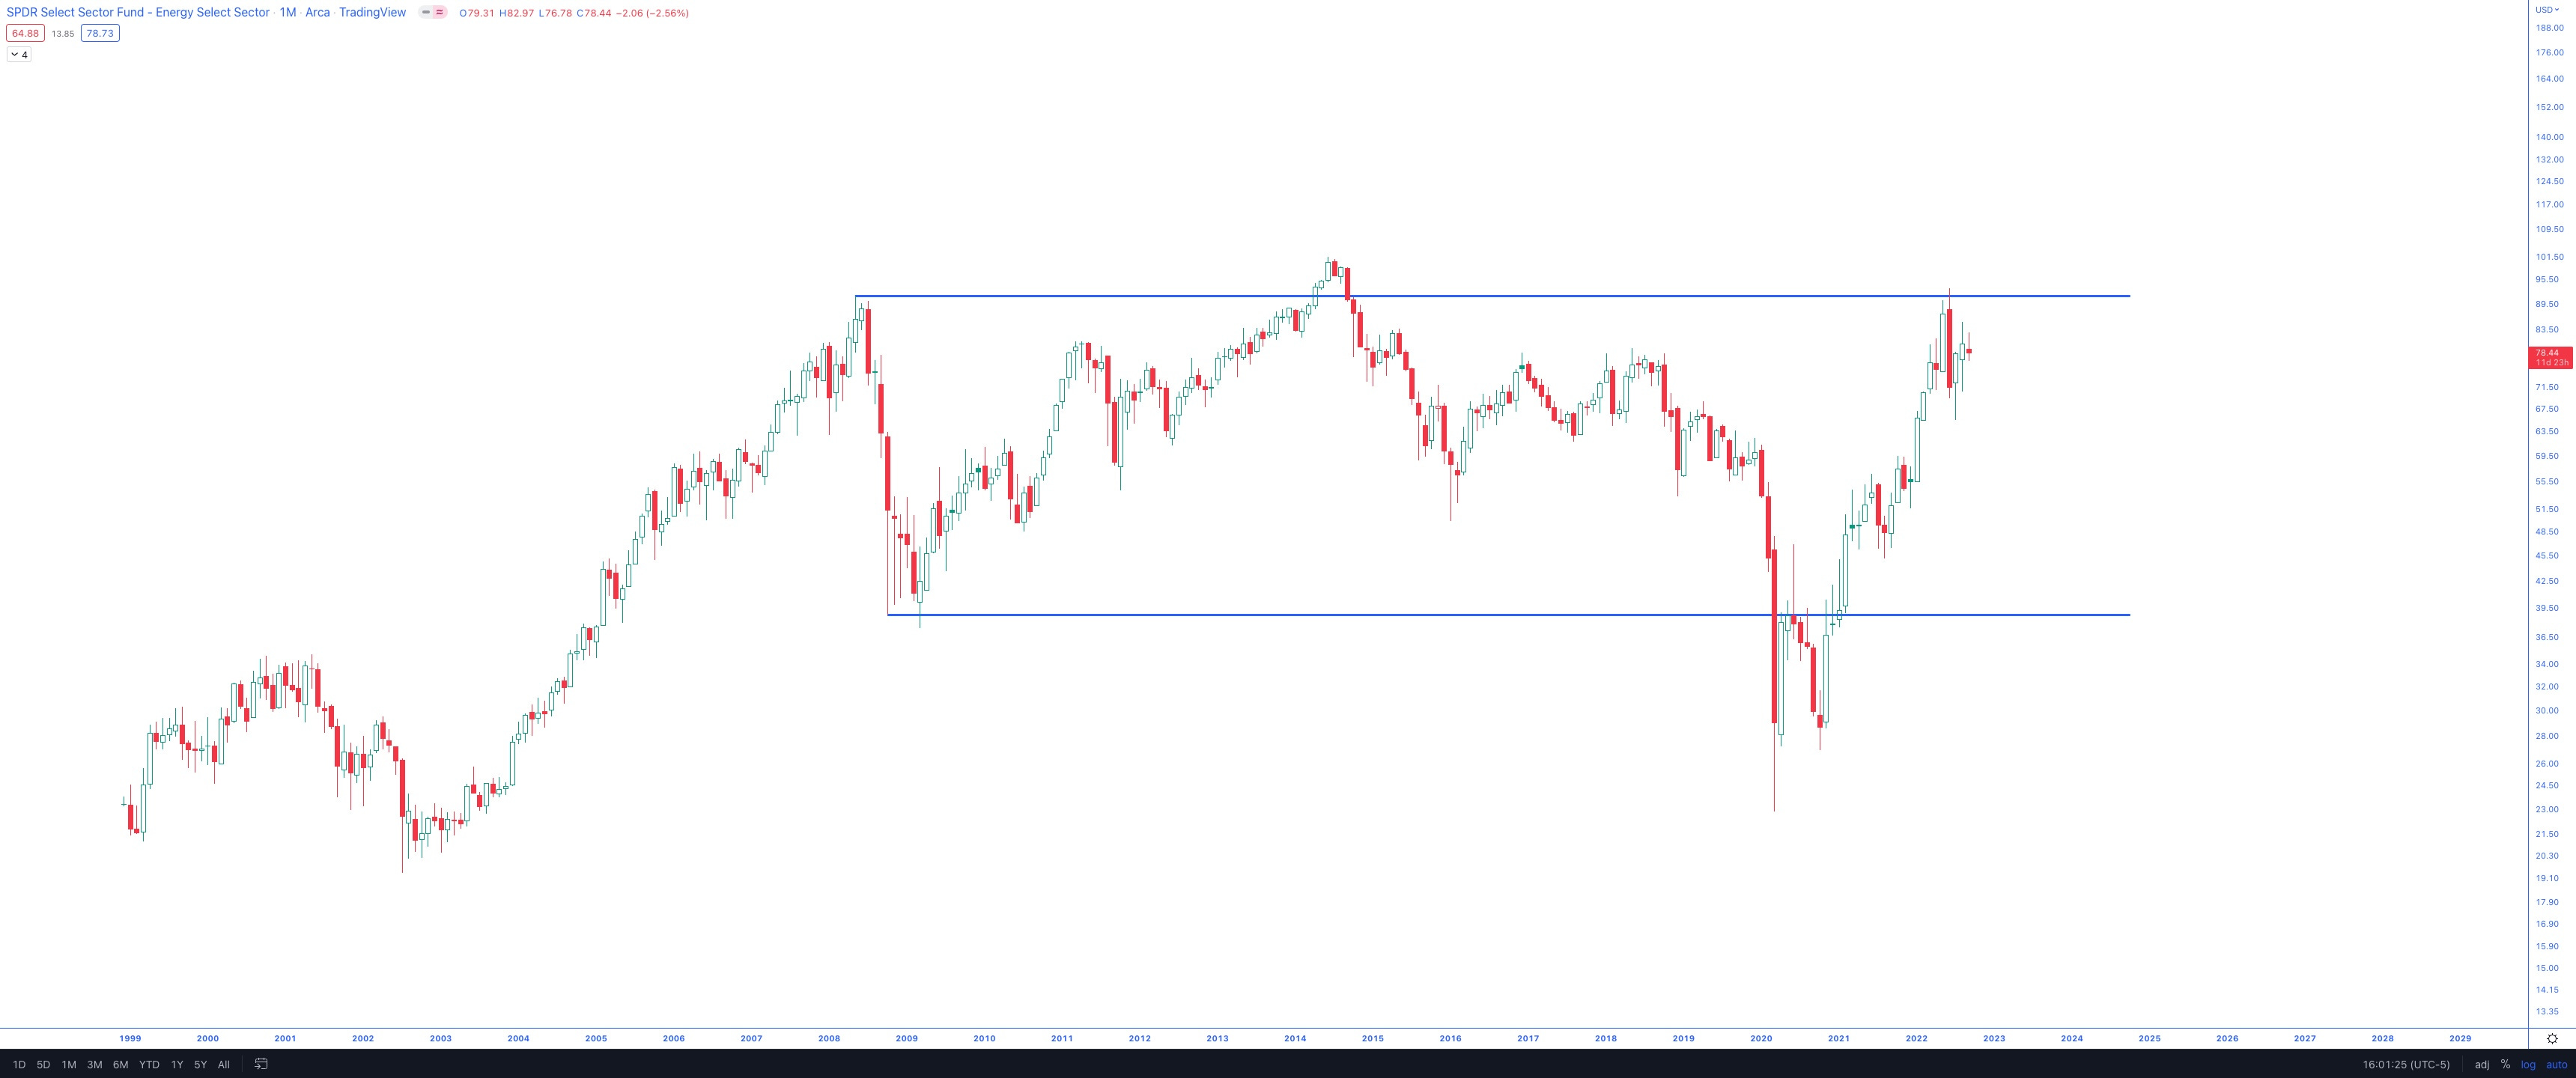
For the students of Wyckoff, the above chart might have a familiar look: Reaccumulation.
Framing Expectations
With the looming seasonality transition, XLE (Energy) is worth tracking as a potential leader in the next rally.
I accept that XLE might not be a guaranteed slam dunk play. I needn’t struggle for those answers yet. Instead, I need to watch how it responds— by itself & relative to SPX, during the remaining bearish seasonality (through September’s end).
When the time comes, the answers will be there. And that is how I have learned to approach markets—with patience. Not forcing my will upon the market with my presumed answers, but rather letting them come to me when the market is ready to hand them out.
And right now, I see the market starting to tip its hand. Is it a bluff? Maybe. But in time, we will know.
All I can do is take the clues, be ready, and position accordingly.
Have a great week,
Trace