

Market Outlook 18-Jun-2023
Market Outlook 18-Jun-2023
Unlocking Market Dynamics: A Deep Dive into SPY, Gold, Oil & Energy, and the Power of Predictive Indicators


Hello investors and traders,
First off, a happy Father's Day to all the dads! I hope your day is fantastic!
For this weekend, I've decided to make my update available to everyone, free of charge. Starting next week, I will revert to providing updates exclusive to our premium members.
In today's newsletter, I'll be discussing:
The SPY (S&P 500 ETF)
Potential opportunities in Oil & Energy
Opportunities in Gold
The performance of several crucial indicators that I've shared earlier this year
Major ETFs
Starting this week, I will concentrate on one of the four major indexes every week, and I aim to cover all four over a monthly rotation. The tentative sequence for review is as follows:
SPY (S&P 500 ETF)
QQQ (NASDAQ ETF)
IWM (Russell 2000 ETF)
DIA (Dow Jones ETF)
Please note, these detailed analyses will primarily be made available to our premium members.
SPY

Looking at the weekly chart, with an eye on the volume (price-adjusted), shows that there is one more volume-spike level to overcome: $448.92, which occurred during the Nov. 29th, ‘21 weekly candle.
I could argue that there is another volume spike at the Dec. 13th, ‘21 candle, however, that candle traded about 12% less volume, and falls into the cluster of volume levels traded throughout most of the last two years
A couple of other observations:
The 10-week SMA is now at the largest volume-spike level of the past two years (price-adjusted), and rising.
For the first time in two months, we see a candlestick leaving a small wick below and a larger one above the body. This was observed on the April 10th weekly candle, and it was followed by a six-week consolidation period before the next significant upward movement. Notably, the price never dropped below the 10-week SMA during this consolidation.
This month, the S&P 500 index (SPX) has increased by 5.5%. For context, remember that our monthly performance tracker (shared with premium members) shows the average June returns over the seven tracked study years to be +1.8%. So, we're currently well ahead of that average pace. As a result, I plan to maintain my two positions in SPY options (+142% & +76%, respectively), despite anticipating a period of market volatility ahead (explained further below).
There are still two weeks left in the month, and historical trends indicate a spike in market performance toward the end of June, typically up to the 4th of July area. After this, the market might enter a choppy, even bearish, phase for about a month, potentially reaching its low point in August.
Seasonality:

Oil & Energy
I'd like to quickly share the Oil pitchfork chart. I still need to do more programming to obtain current oil seasonality data, since the freely available information online doesn't take this into account.
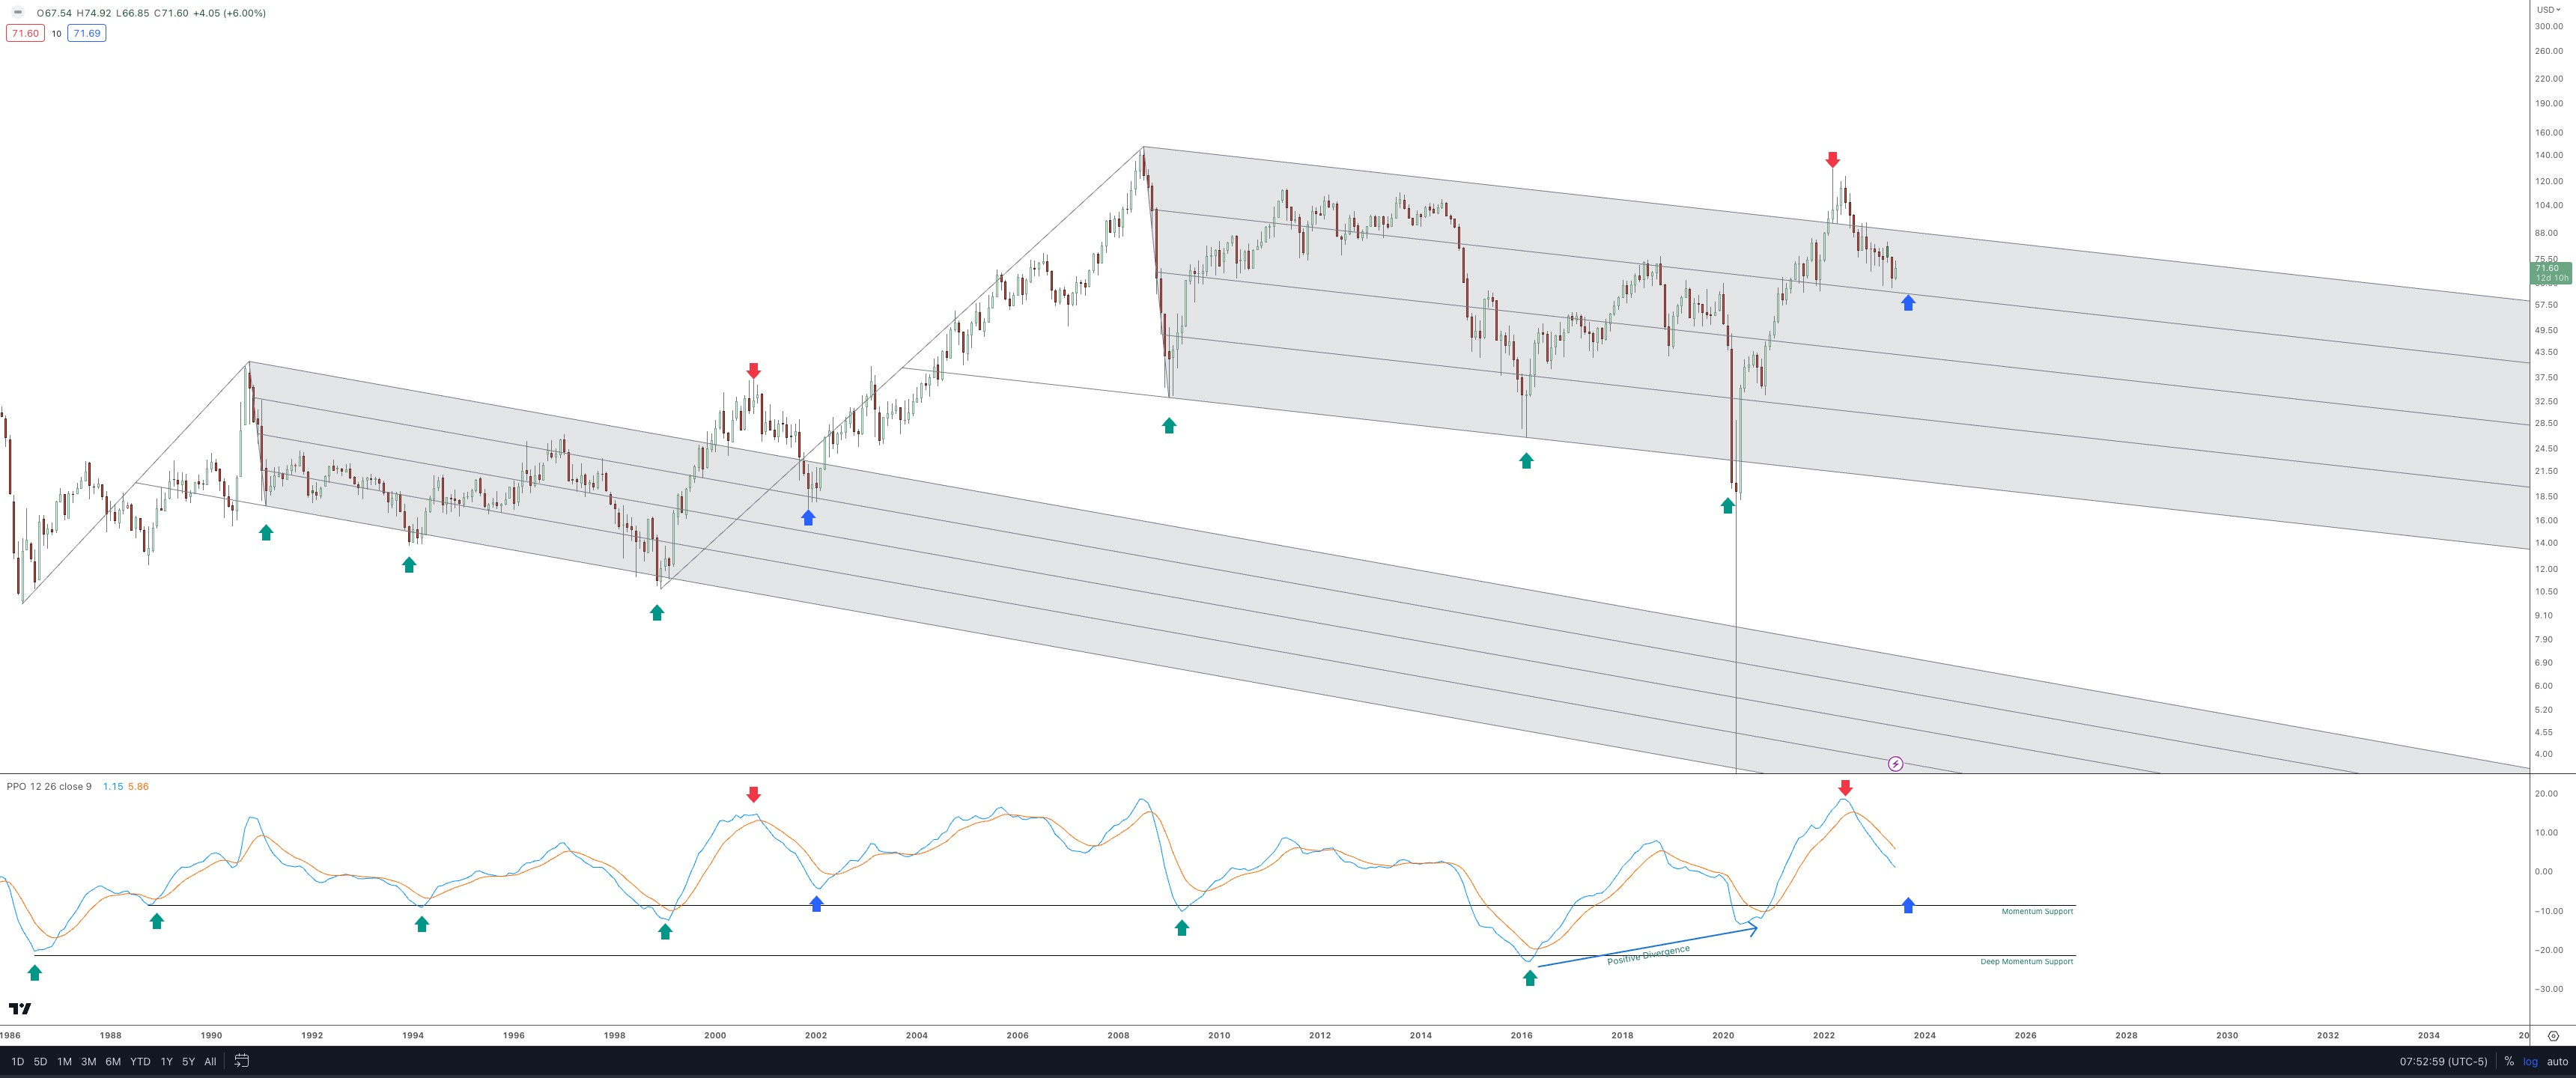
In the coming weeks, I anticipate there might be excellent opportunities for those bullish on Oil & Energy in the long term. The pattern is almost complete at the momentum pivot point.
Already, there's a long wick beneath the March candle, with a test in the May candle.
I suspect that West Texas Intermediate (WTI) crude oil is in the process of establishing a low in the current range.
I'll provide further updates on this once I've integrated a seasonality code into Tradingview.
Gold Opportunities
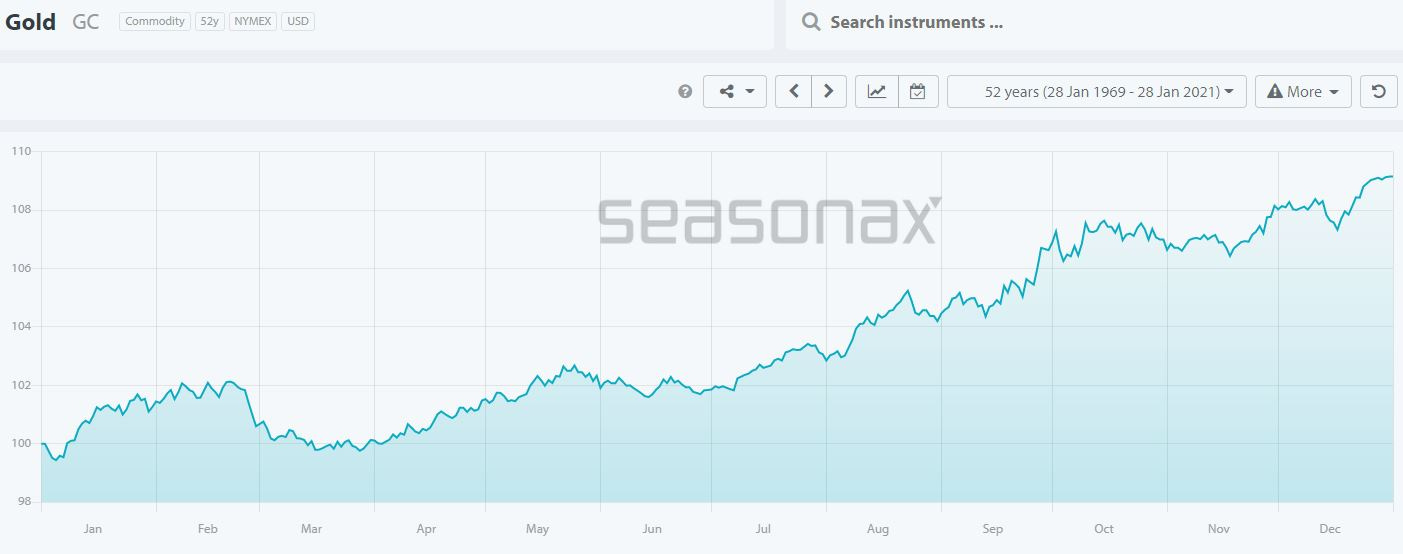
Recently, the seasonality trends in gold have been facing challenges, but a change is likely imminent.
The typical slowdown in June is nearing its end. According to the following chart, we are about to enter a period of increased activity from a seasonality standpoint.
Moreover, if we rely solely on historical price trends, it's promising to see that gold has successfully stayed above its 2011 buying climax level of $1,920 per ounce.
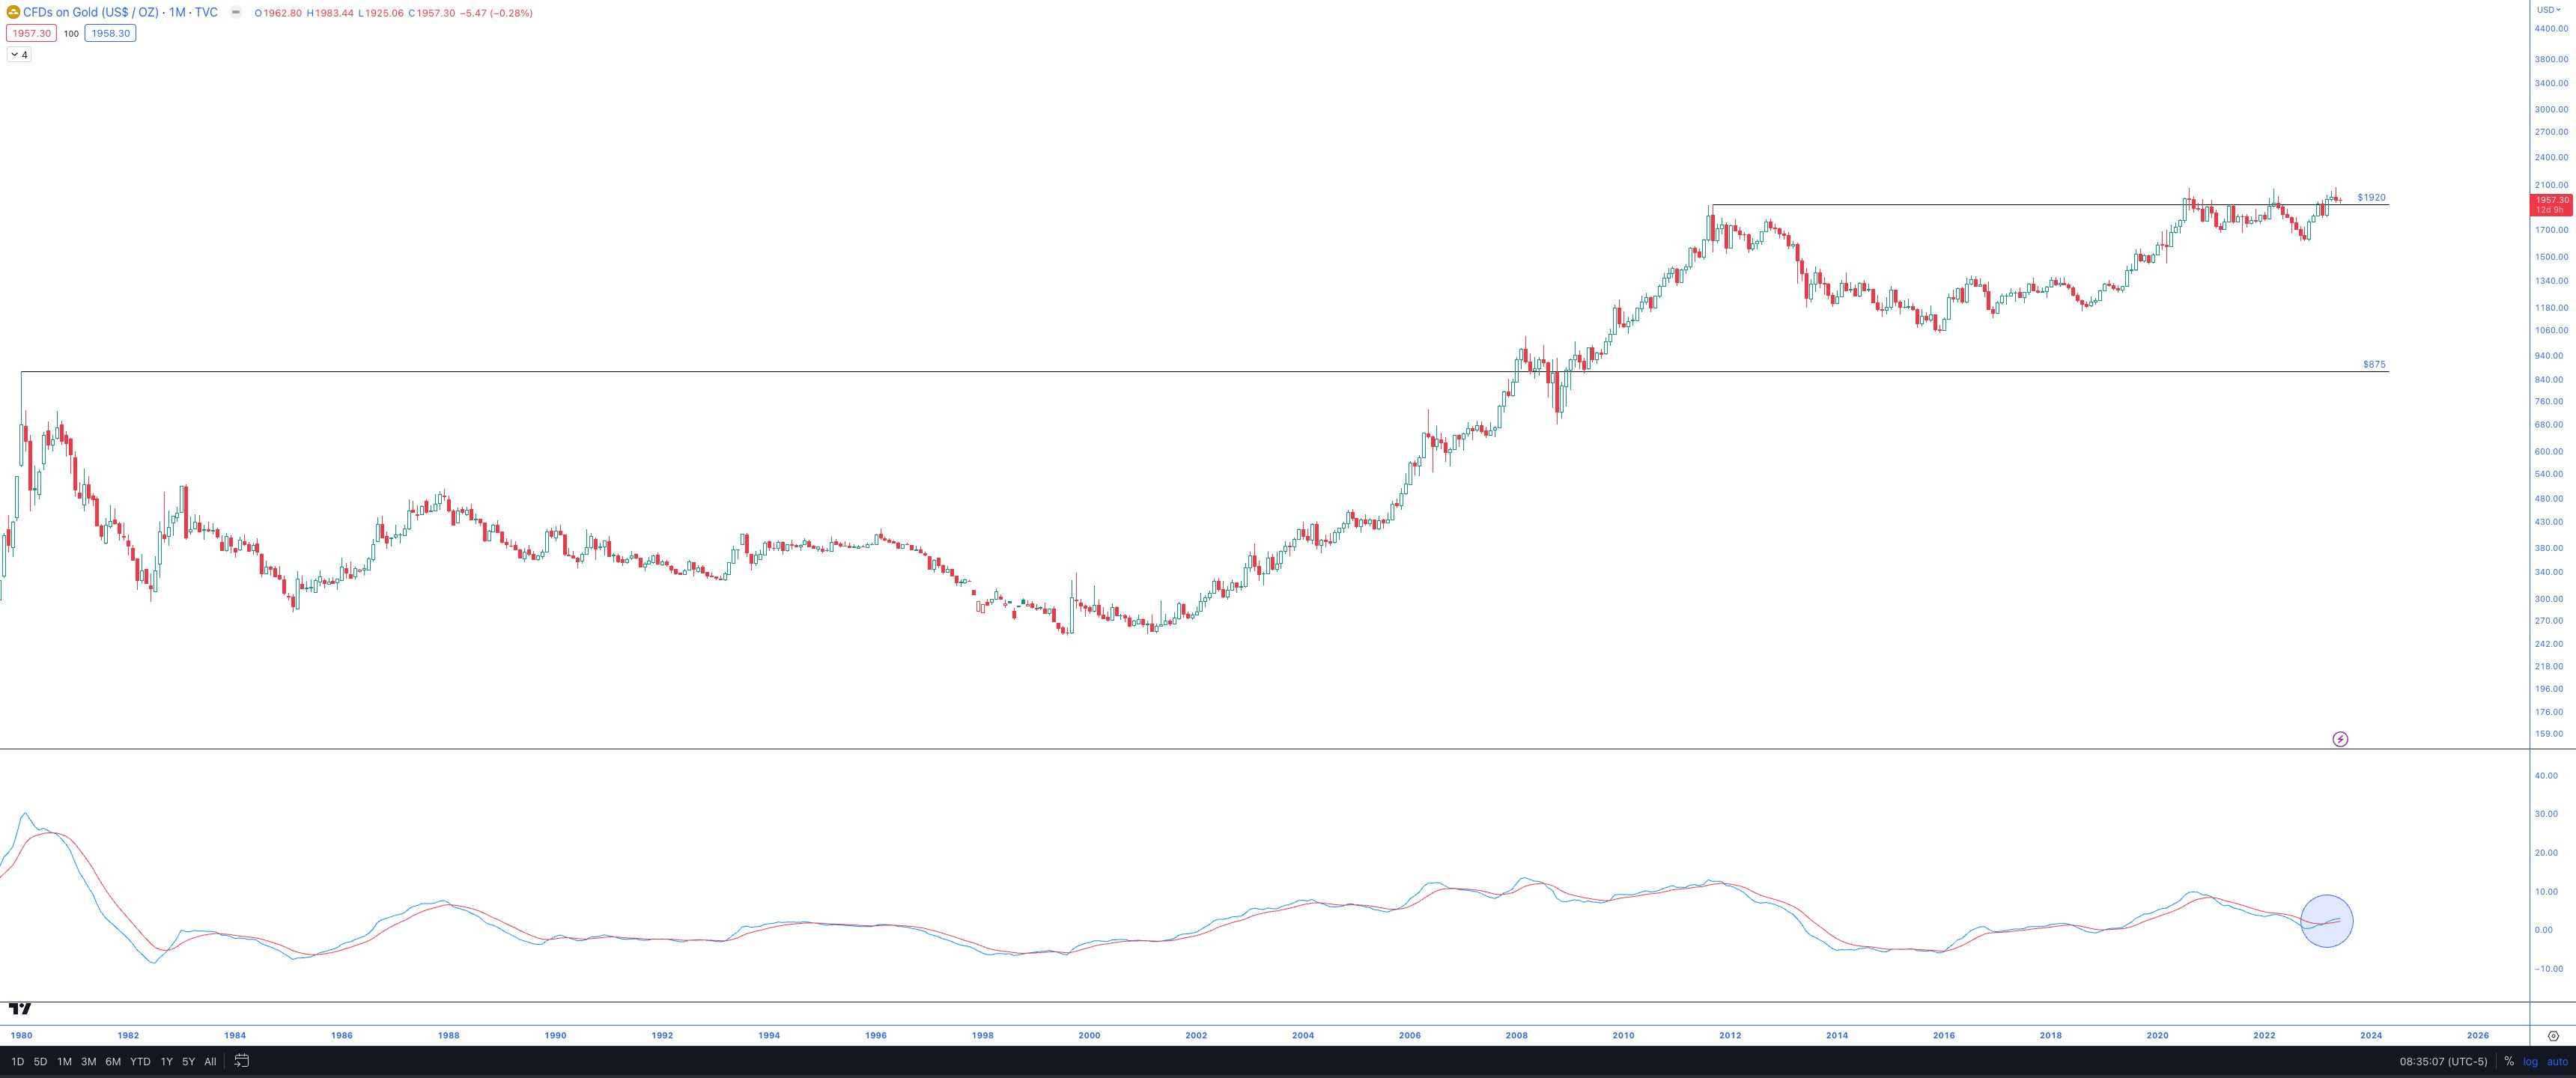
Adding to this bullish perspective, there's a recent momentum crossover, and it's originating from a relatively low point.
For these reasons, I'm keeping a close eye on both the gold and GLD (Gold ETF) charts, looking for strategic entry points.
Bullish Signals - Follow Through Since
This year, I've pointed out several bullish indicators that have forecasted the rise in S&P 500 (SPX) prices:
Breakaway Momentum & Capitulation (BAMC):
The BAMC signal was activated on Thursday, January 12th. From that point to now, over 155 days, it has generated a 10.7% gain. This is a decent result.
Zweig Breadth Thrust (ZBT):
The ZBT signal was triggered on March 31, and it has since delivered a gain of 7% over 77 days. Again, a good outcome.
Coppock Curve:
The Coppock Curve signal was activated at the close of March, concurrent with the ZBT. This too has resulted in a 7% gain over the last 77 days.
In April, after the third indicator triggered a bullish signal, I made the following comment:
Based on the historical accuracy of this signal, I am putting some serious weight on it, and with all of the other recent signals (ZBT, BAM, etc.) I am looking forward to the next leg of this rally continuing.
I will leave the BTC 3-day thrust for another time.
See the below links for more.
Breakaway Momentum & Capitulation:

Zweig Breadth Thrust:

Coppock Curve
Best Regards,
Trace