

Market Outlook 02-Jul-22
Market Outlook 02-Jul-22
Time to scan for strength, Bitcoin Lows

The first half of 2022 is in the books, and it wasn’t pretty. Only two sectors finished with positive returns. Two sectors had > 30% declines. Most were down 9% or more.
Here are the 2022 first half results, in order from best to worst:
Energy +24.5%
Utilities: +0.25%
Communication Services: -0.92%
Consumer Defensive: -6.9%
Industrials: -9.1%
Basic Materials: -15.3%
Healthcare: -15.0%
Financial Services: -15.5%
Real Estate: -19.3%
Consumer Cyclical: -32.0%
Technology: -33.6%
Bear markets can be tough and painful. But they can also be the best times to prepare for the next amazing market rallies. Every weekend I run scans to see where the strength is. For the first time in a long time (probably since March 2020), only a few industries showed up with the following criteria that I like:
Price rise > 20% in a 3-month period
Price rise > 30% in a 6-month period
Price rise > 50% in a 12-month period
The results are limited to:
Oil & Gas Drilling (Energy) (6-month scan)
Oil & Gas E&P (Energy) (6-month scan)
Coal (Basic Materials) (6 & 12-month scans)
A few weeks ago, the Energy sector had five industries showing up in the results. That sector is quickly falling out of favor, as it has joined most other market sectors in showing recent weakness.
The current search results are almost entirely blank. It feels like walking into an empty room.

Any sector is fair game. The tape will reveal the leading industries/sectors— it’s up to us to pay attention. This won’t last forever, and I plan to focus on emerging leaders during the next bullish rally.
With that said, I still like to look at the charts and categorize them into groups based on their recent action, current price relative to support/resistance, and long-term setups.
On a relative basis, here are the sectors that have my attention and are high on my radar at the moment:
Utilities
Energy
Financial Services
The Utilities sector is currently the strongest, based on the charts.
Utilities
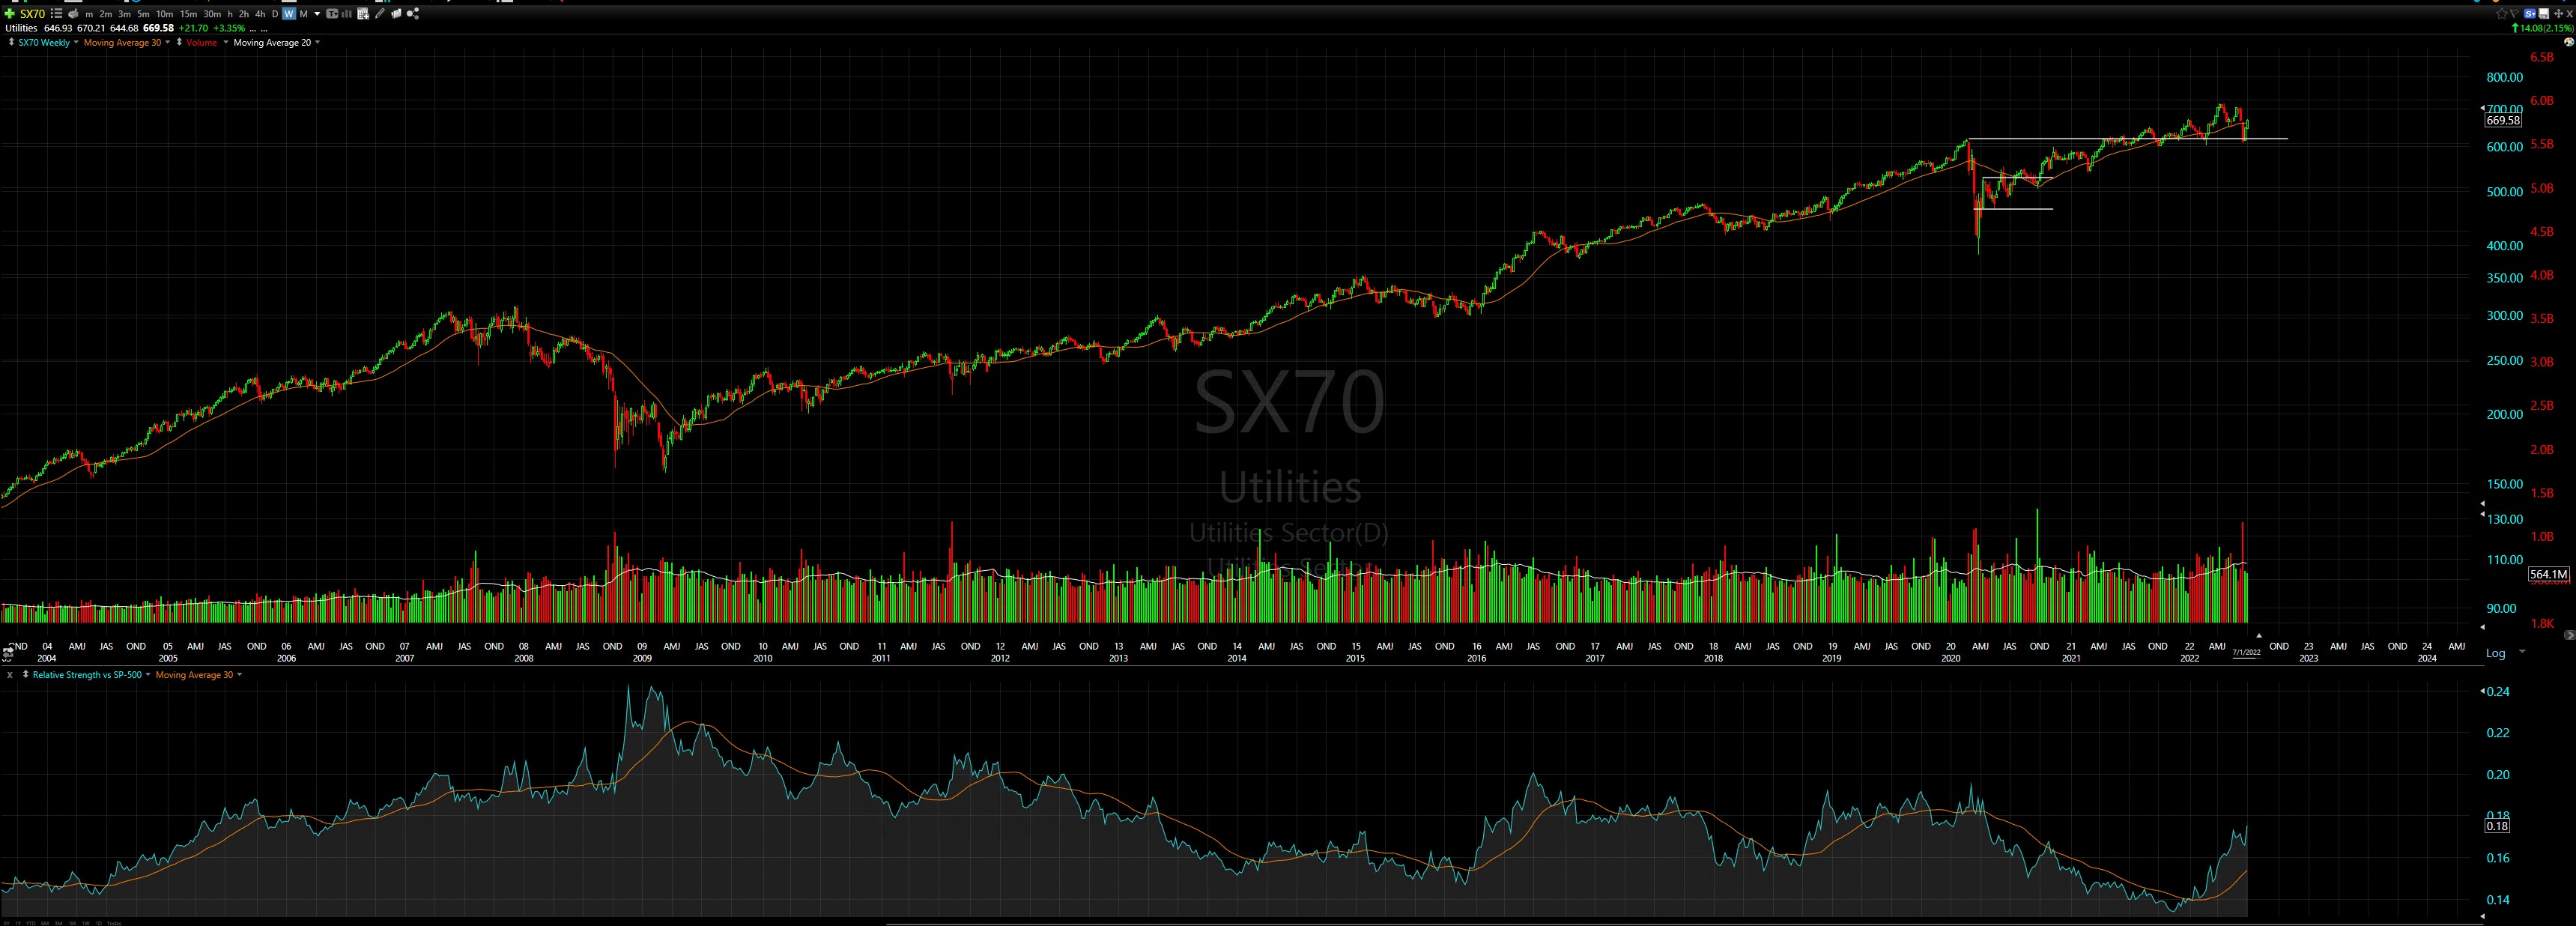
Note the relative strength— deep curl and thrust higher.
Price has tested and pivoted strongly off the pre-COVID highs twice in the first half of 2022.
This is the sector I’m currently looking to for the best setups.
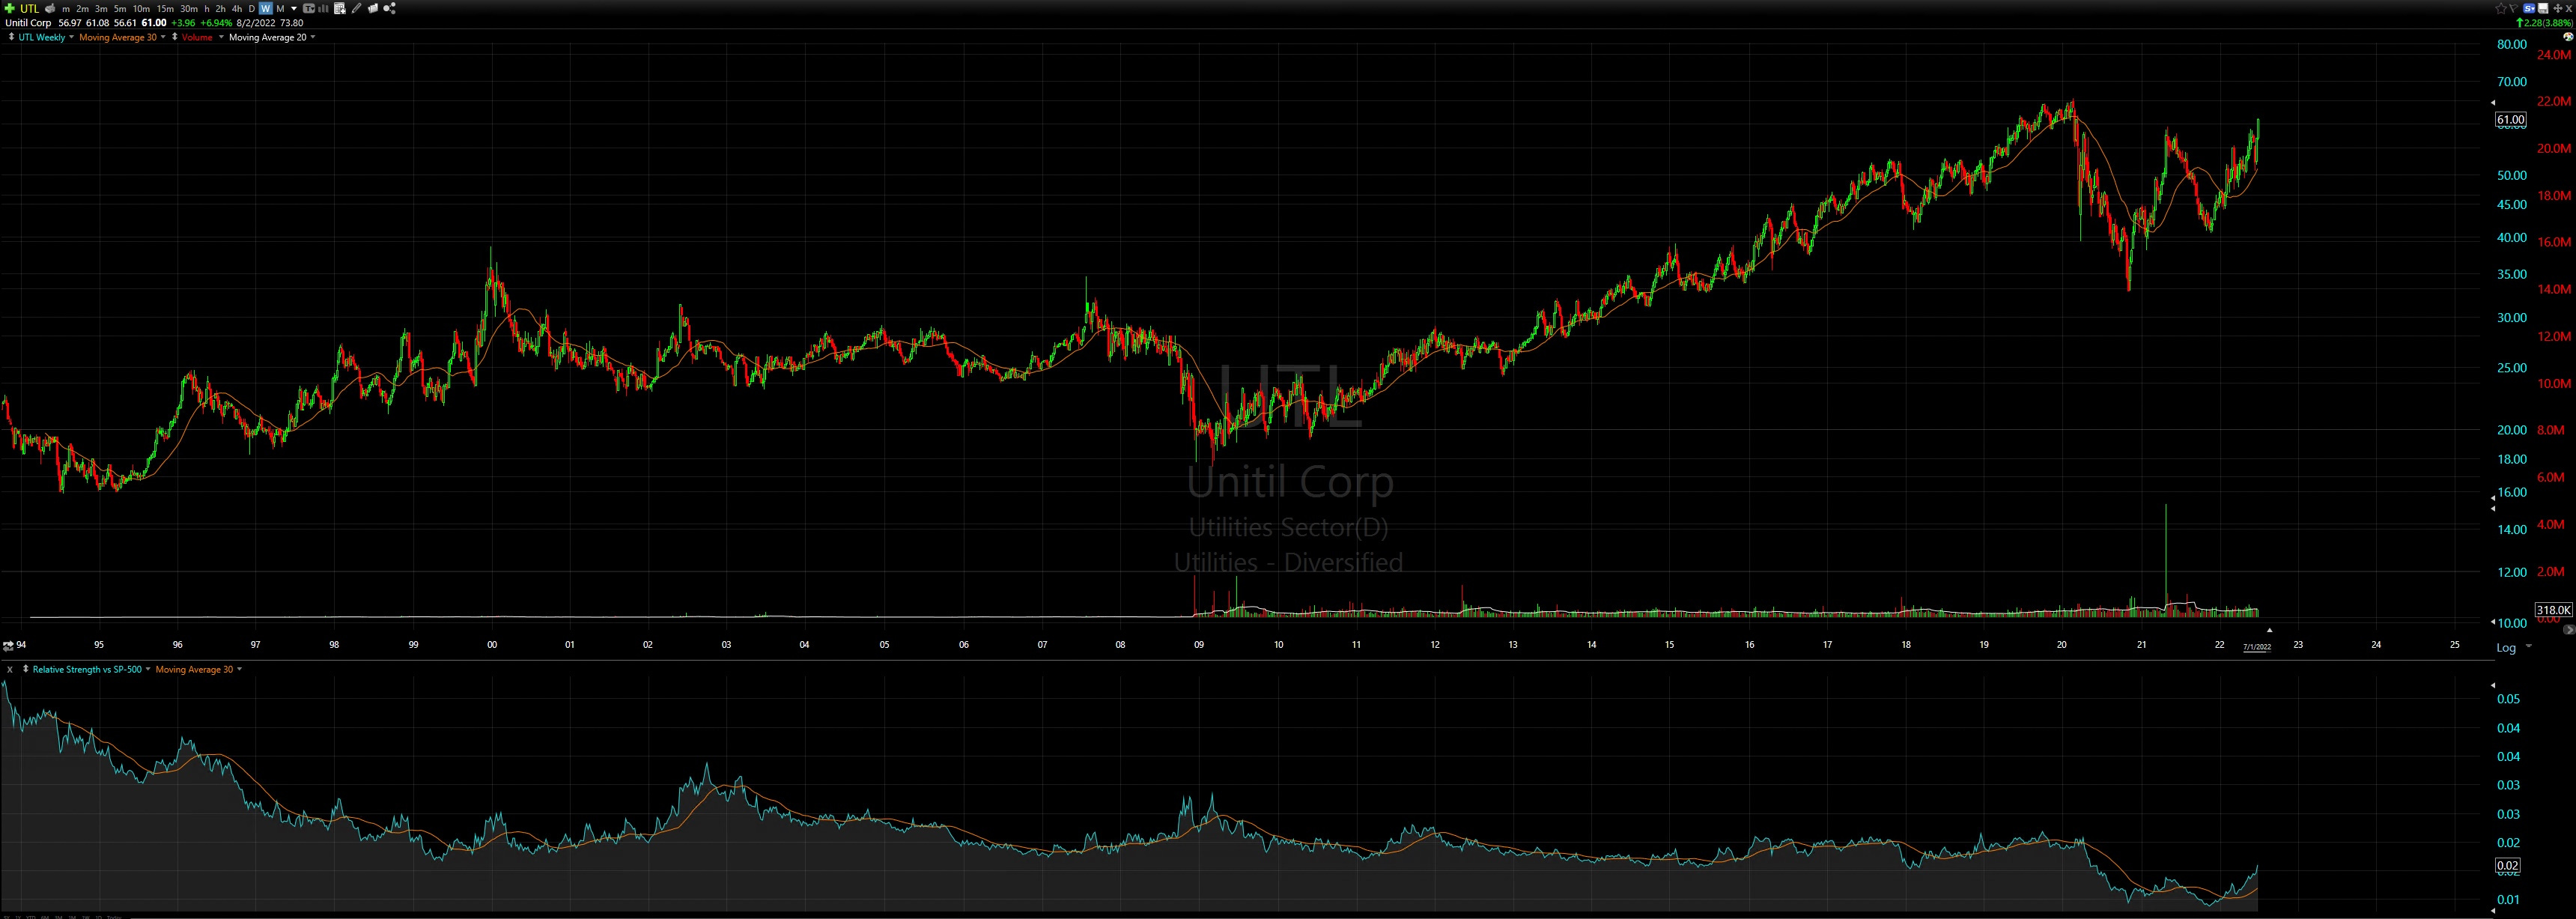
From the sector, I currently like this setup from UTL - Unitil Corp (Industry: Utilities - Diversified)
Energy
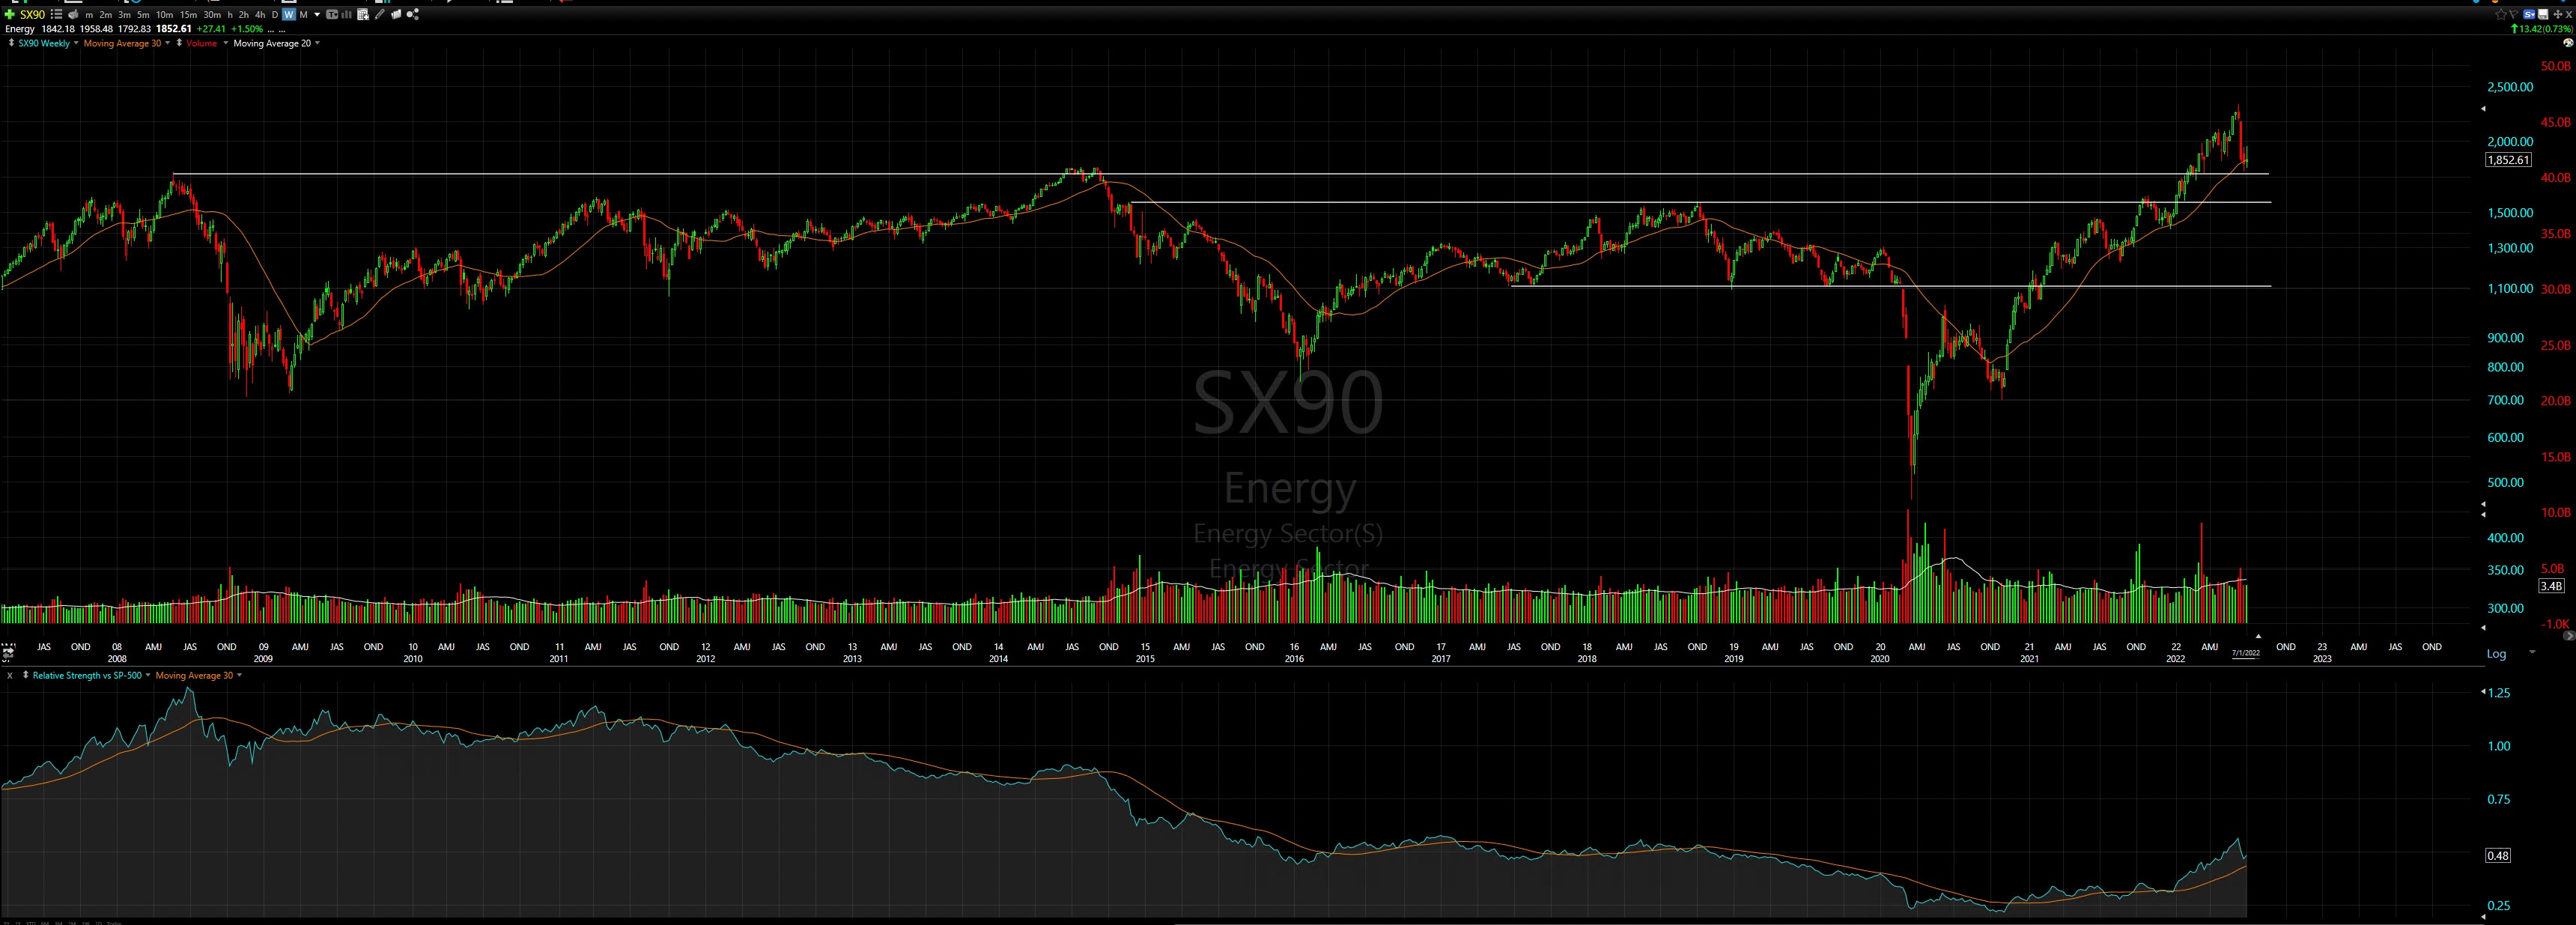
Energy shares a couple of the same characteristics as Utilities:
Deep relative strength curl
Test & bounce off previous significant resistance (2008 highs)
Time will tell, but perhaps the recent weakness in Energy was just a required test of those 2008 highs. The test is in— now it is up to the market to show how vital Energy is.
Financial Services
The Financial Services sector is exciting because of the potential. Just like I noticed and shared back in 2020 with the Basic Materials and Energy sectors, there is a good setup brewing in Financial Services for a lasting rally.
Investors who got in early on the Basic Materials and Energy sector moves were rewarded handsomely.
Here is the Financial Services sector chart:
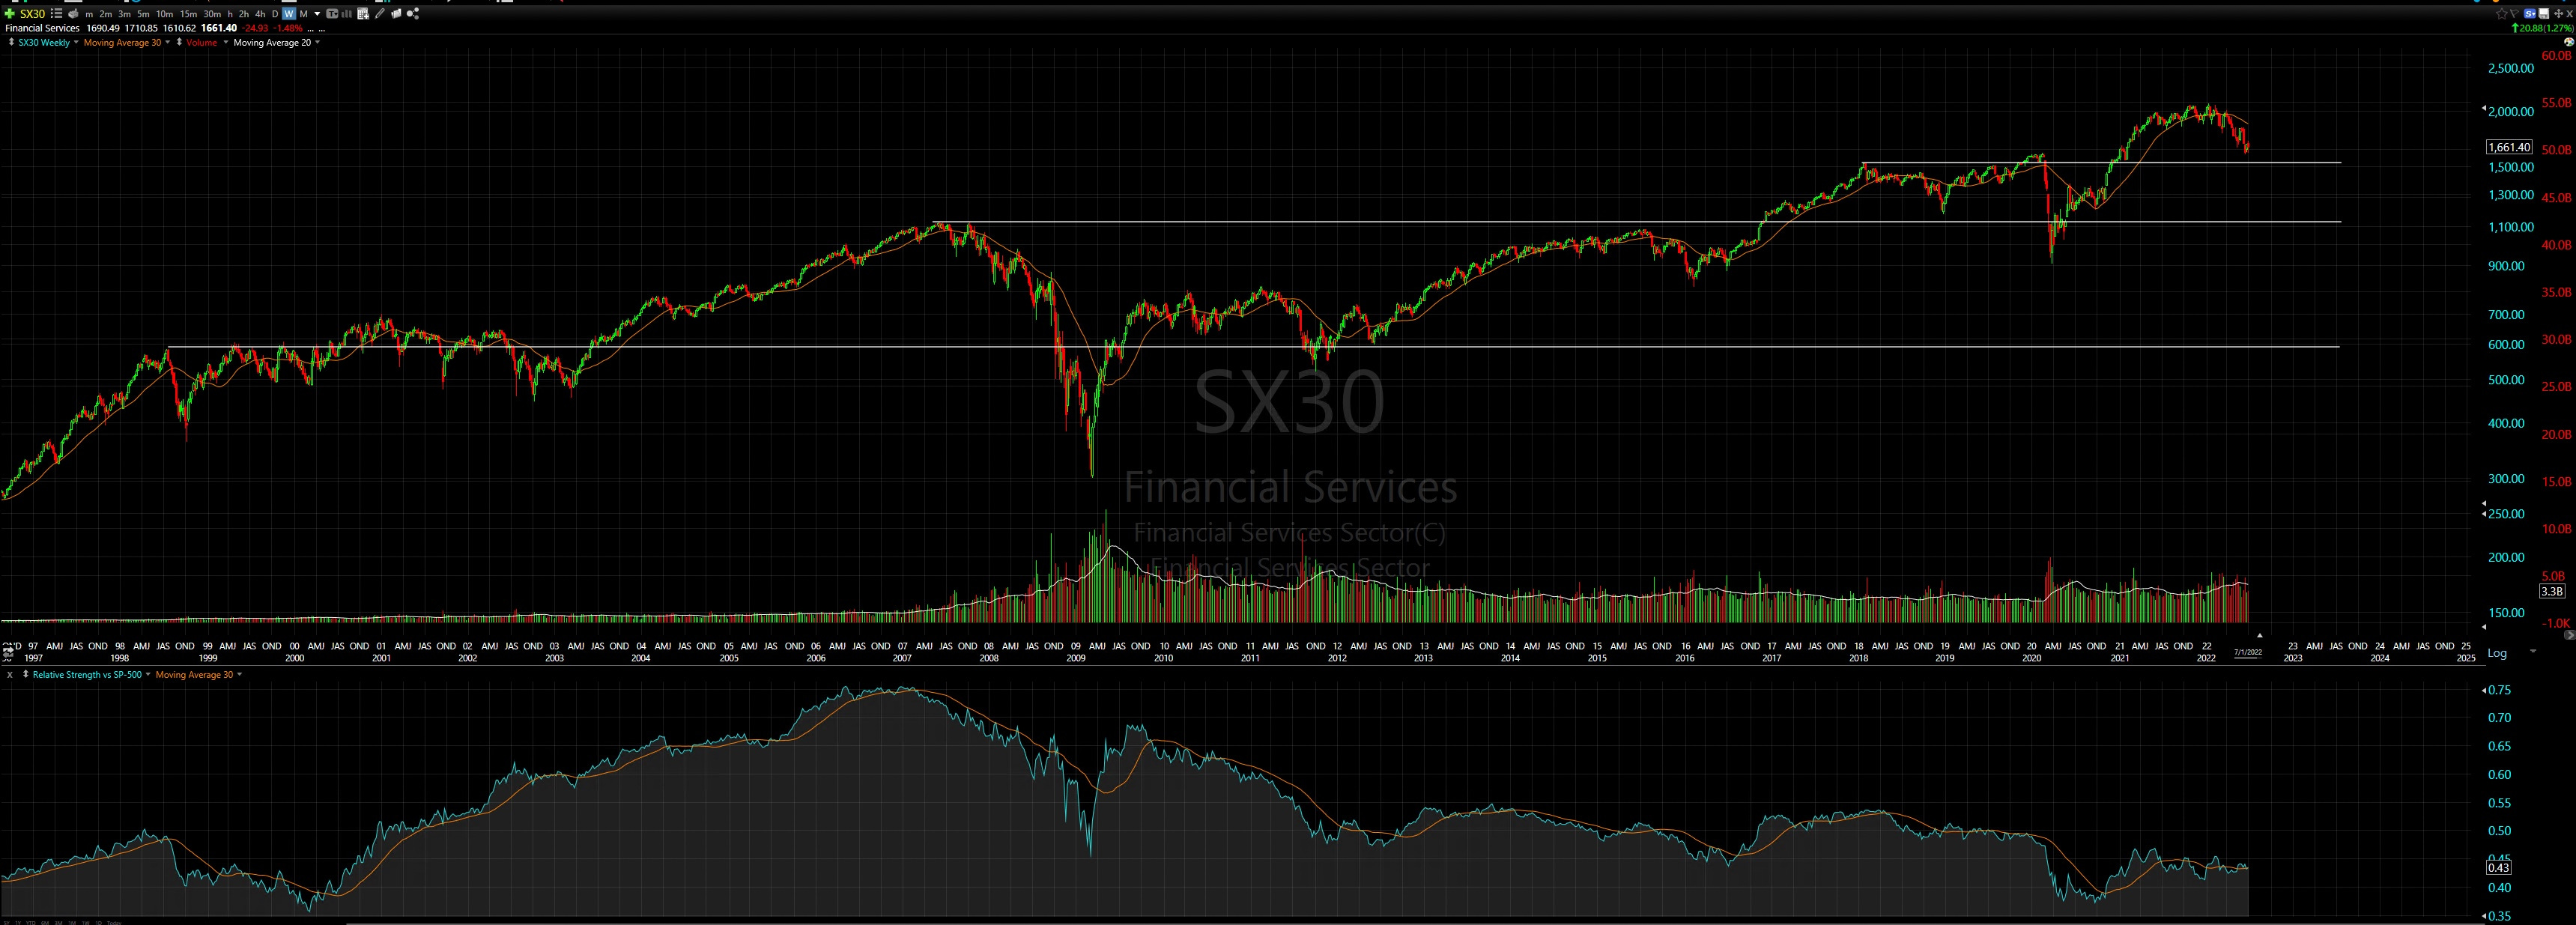
I like how this is slowly approaching the Jan. ‘18 highs
A smooth landing that “wears them out” could yield an excellent basing action, setting up promising upside counts.
The relative strength vs. SPX is showing deep levels still, and there is plenty of room for upside.
I will watch this sector very closely in the coming weeks/months — it could be the next Basic Materials or Energy sector. Perhaps a story for the 2nd half of 2022 through 2024?
Any setup that yields potential for a 12-24 period is always something I like to get involved with.
Bitcoin
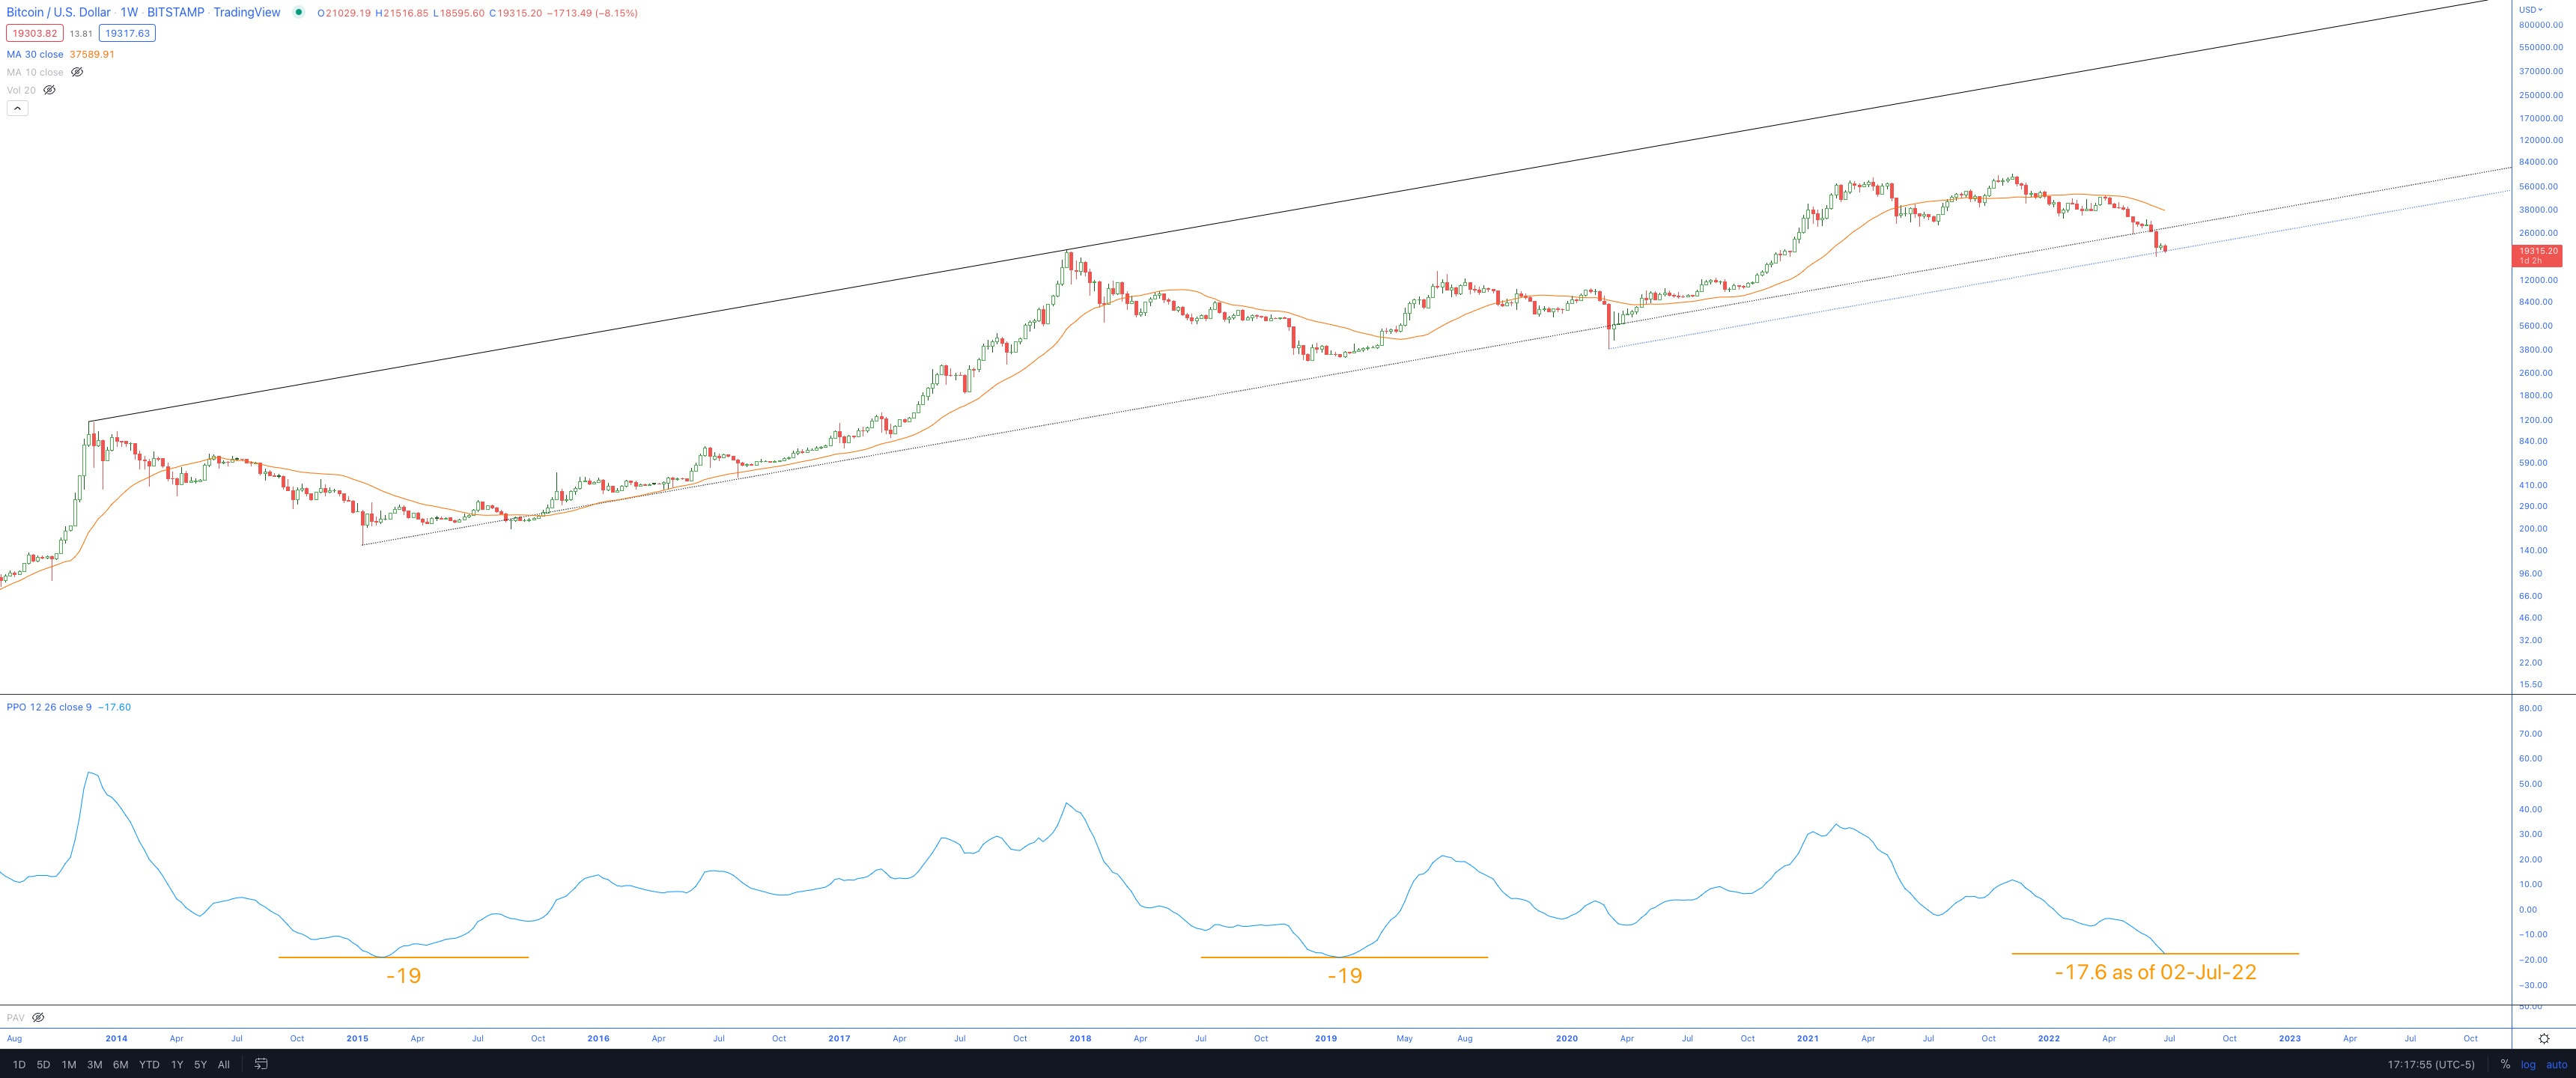
I believe BTC is closer to a low than most people think. There’s a solid case to be made that the 18-Jun-22 lows are it for this bear cycle.
Nothing is guaranteed, and one should always keep an open mind. Markets have tendencies to overshoot in both directions.
Should the $17,600 level fail to hold, the market may try to test the $13,800 area quickly. Not only would this provide the market with the typical >80% drawdown from ATH, but it would also be testing a critical level from the 2017-2019 basing period.
It is easier to see the potential for this on the 6-month chart:
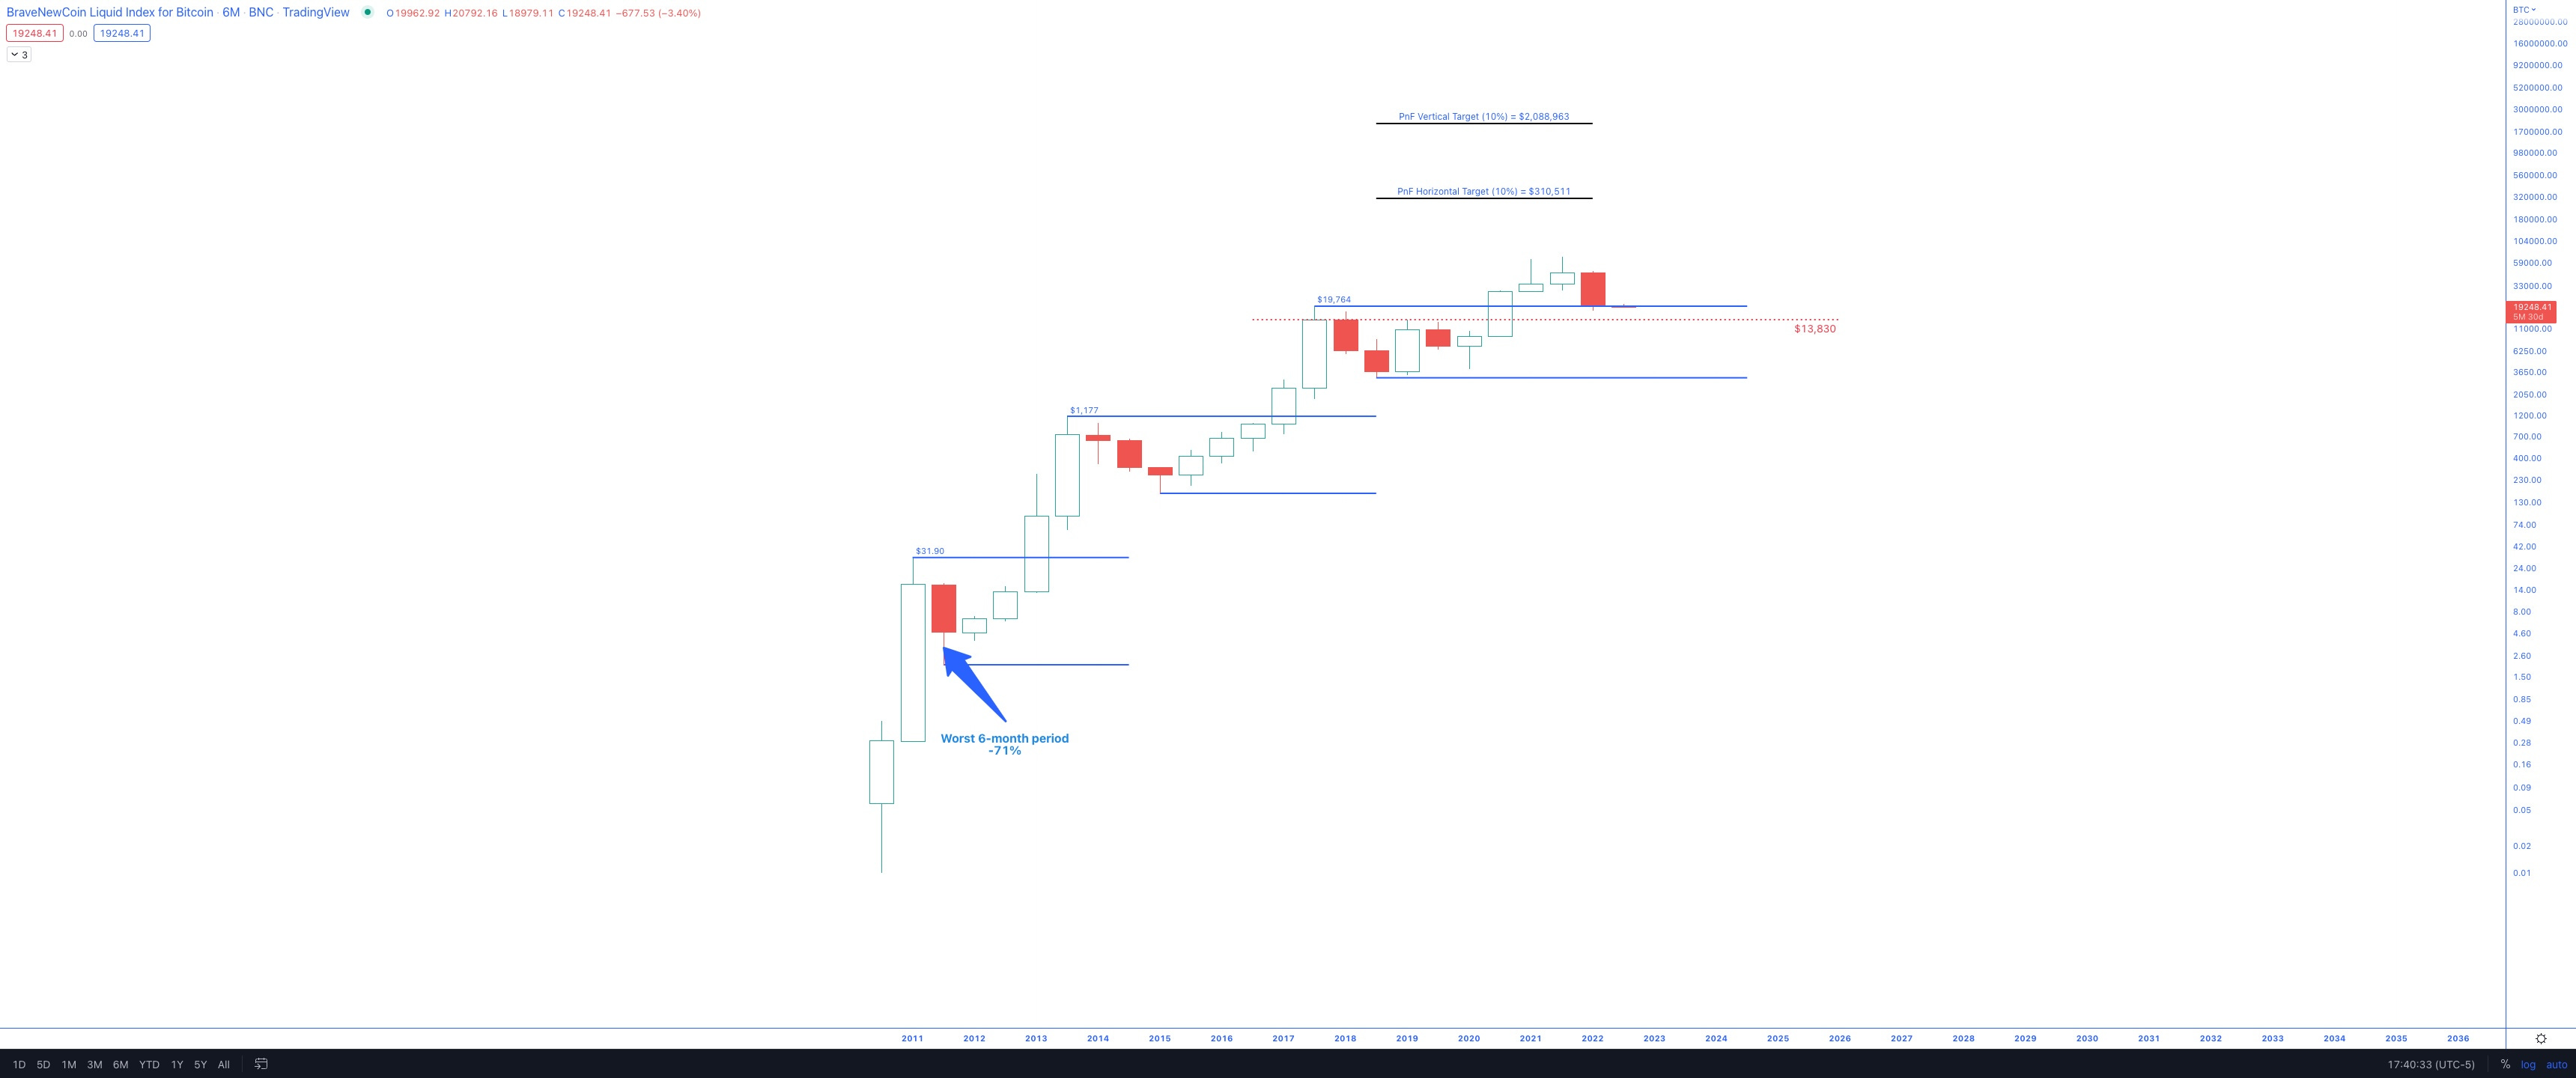
The first half of 2022 was rough on BTC; in fact, only one prior 6-month period performed worse: The 2nd half of 2011 (-71%).
Biggest Drawdowns from ATH:
2011: -94%
2013-2015: -86%
2017-2018: -84%
2021-present: -74%
A pullback to $13,830 would bring the current drawdown to -80%. The market might want this before releasing BTC. Worse drawdowns have happened, and I am open to the possibility.
I am not calling for $13,830 (yet), but I am identifying it as a target should $17,600 break. There is a good chance the lows are in, and now Bitcoin needs to base and build the cause for the next move.
Basing Period
History shows there could be a 3-6 month basing period. And it would be good for Bitcoin’s longer-term technical prospects.
As I pointed out last week:
Thirty-eight (38) weeks of basing followed the 2015 lows. Once price escaped from the base, there was no further testing required.
The 2018 lows had a shorter, seventeen (17) weeks of upward grind before price escaped. A test (March ‘20) was required sixty-six (66) weeks after the 2018 lows.
For anyone celebrating, I hope you have a happy, healthy & safe 4th of July!
Trace