When I take a new position, I like to size up the potential returns using Point and Figure counting & the resulting targets. How much gas is in the tank?
I’ll use the ARCH position (initiated on August 2) as an example below.
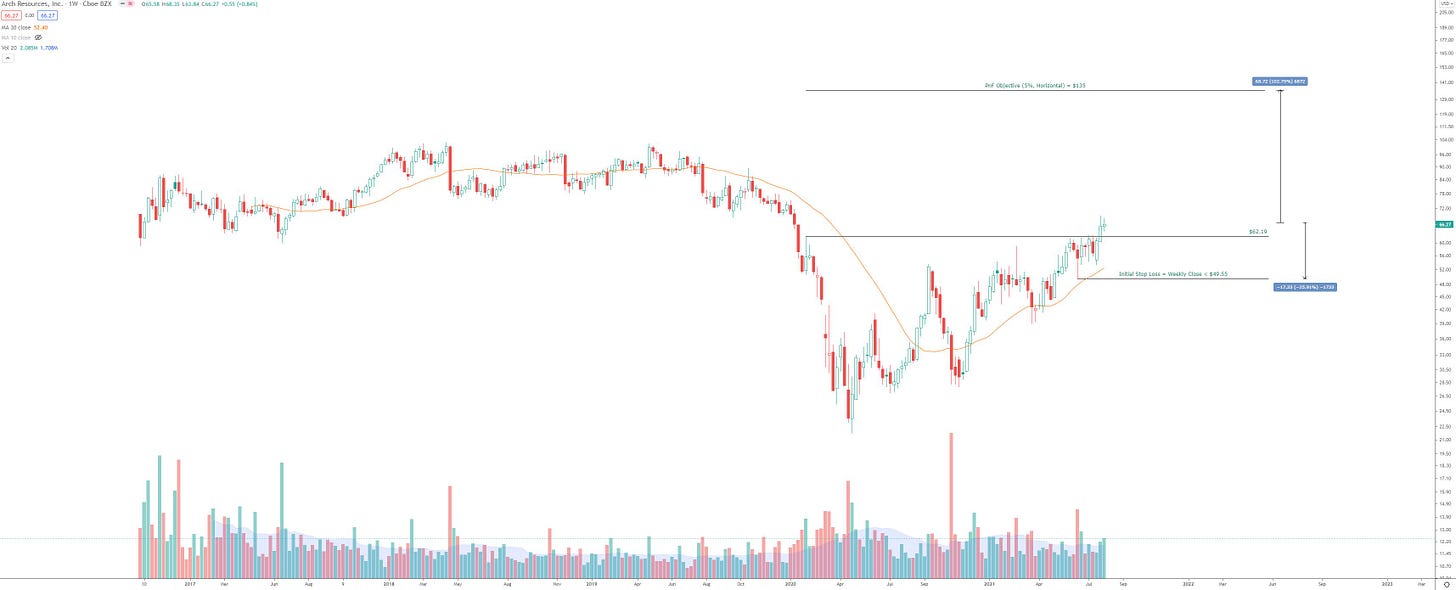
Here is the weekly chart:
From the entry point of $66.88 to the target of $135.60, there is a potential return of 102%. I set my initial stop-loss level at $49.55, which would result in a 26% drop.
So what I’m looking at from a reward to risk perspective in this scenario is an approximate double on the position or an approximate loss of 25%.
As a rule of thumb, I usually target the reward/risk ratio 3x or more.
So, in this case with ARCH, the reward/risk ratio here is 102%/26% or 3.9x.
Or calculated another way (135.6-66.88)/(66.88-49.55) = 3.9
That is above my pre-determined criteria of 3x, so I went forward with the position.
Over time, I’ll adjust the stop-loss higher, which should only help the reward/risk.


