

Bitcoin Update 07-May-22
Bitcoin Update 07-May-22
Inflation Rate, Price Objectives, & Chart

A quick update on Bitcoin.
With each passing week, the long-term entry point in bitcoin becomes more and more attractive. Please see below for my thoughts.
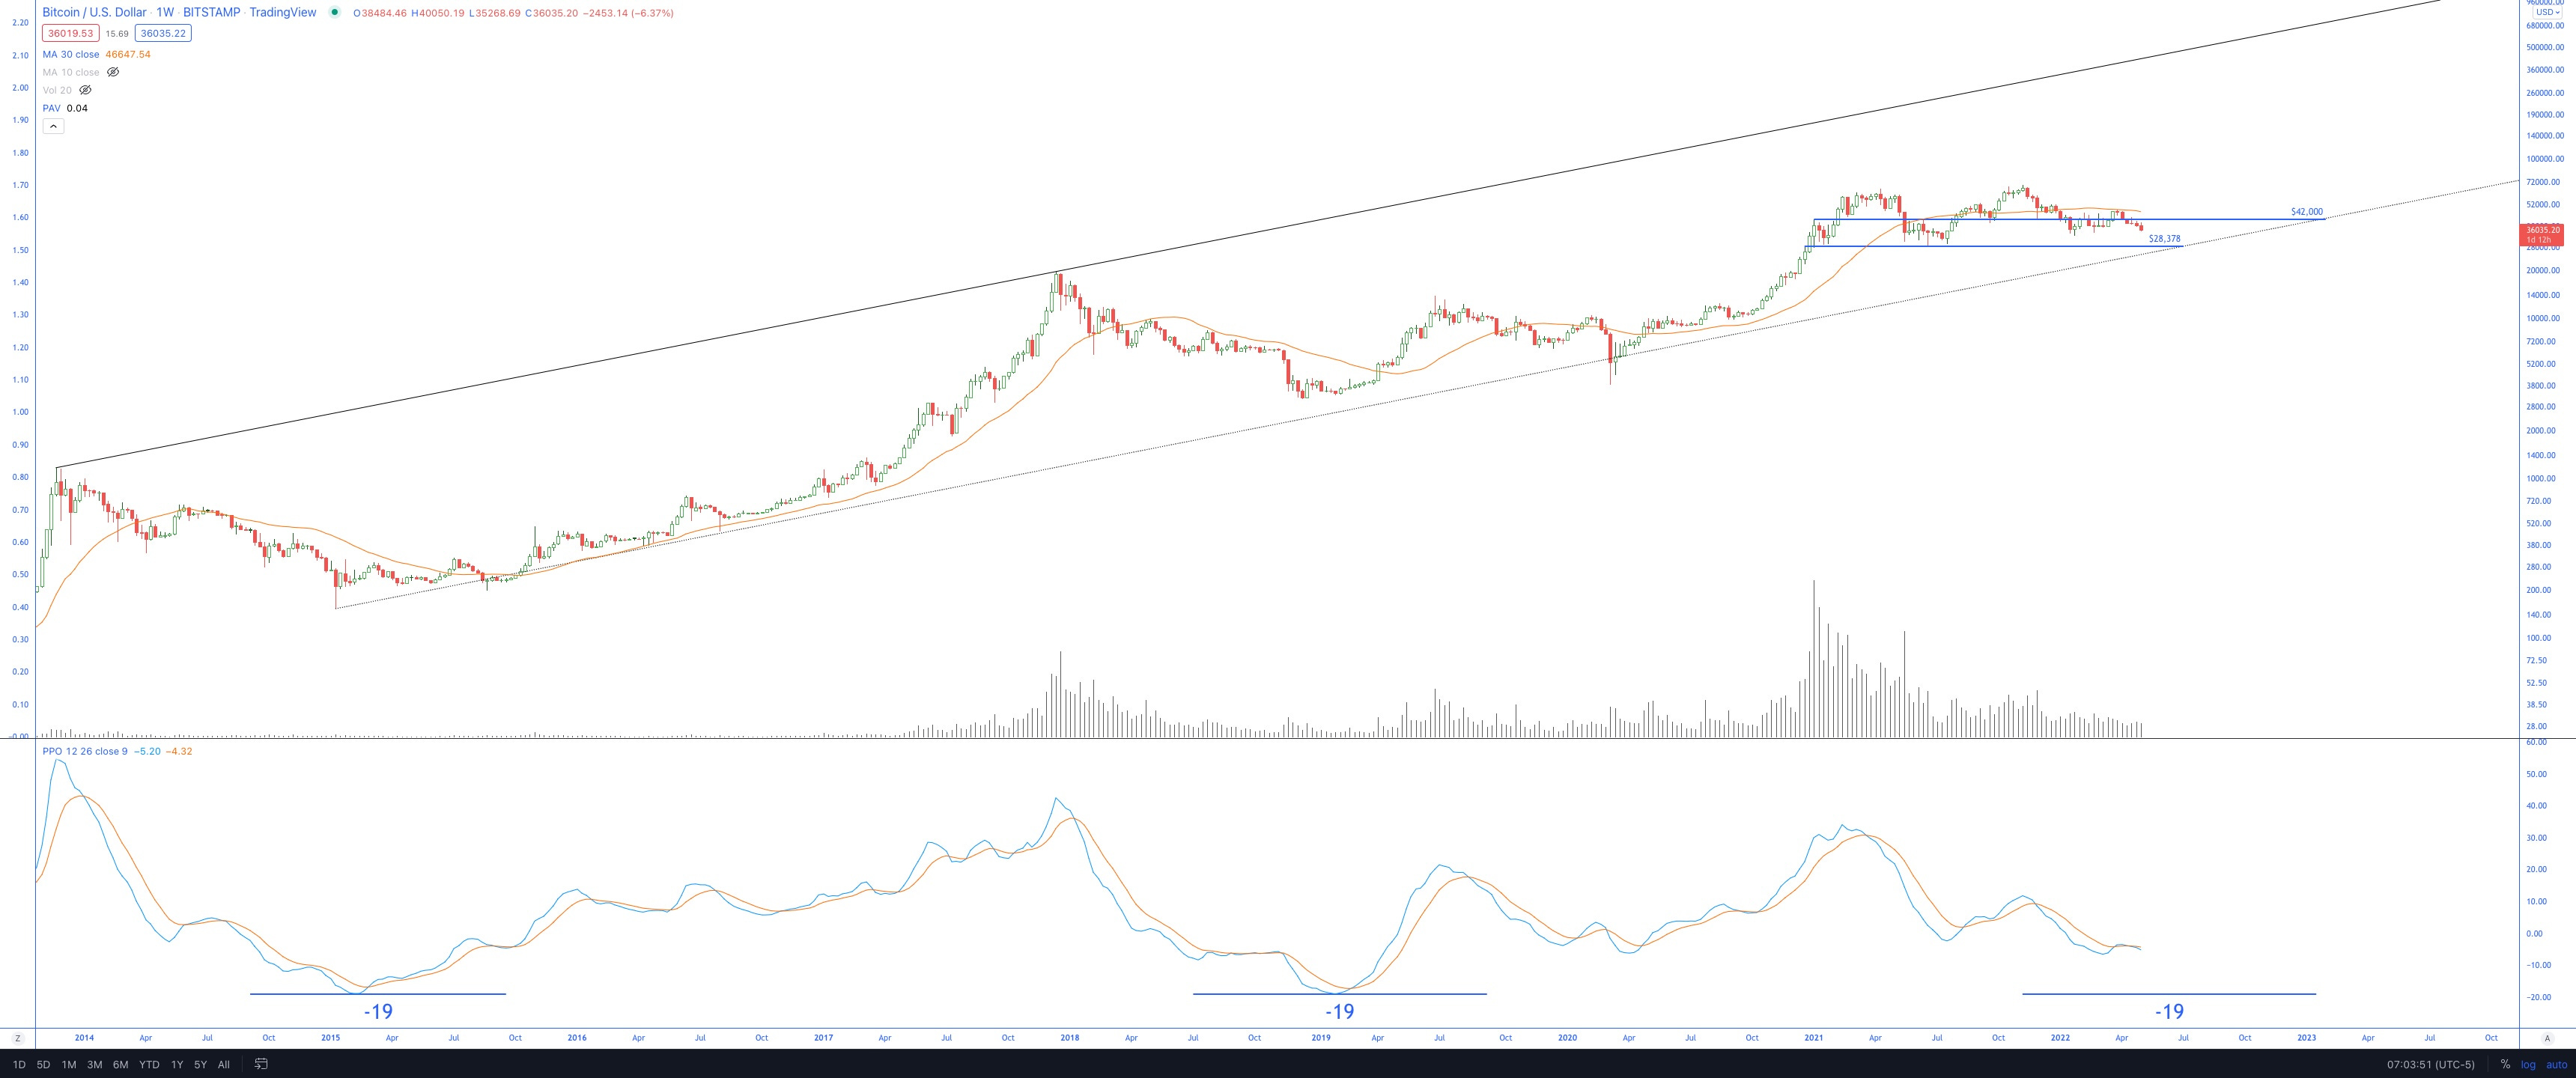
Bitcoin has struggled to get back above the volume spike level at $42,000.
Underneath the $42,000 level, BTC is susceptible to bear raids.
The momentum indicator shows there is still room for further declines until it reaches the support levels from 2015 and 2019.
From what I can see in the charts, it could set up a tremendous long-side opportunity if BTC were to flush down to the $28k area.
The weekly momentum (PPO: 12, 26) would likely reset down & near to the -19 level at those levels.
The long-term channel demand line would come into play.
The support present in Jan. ‘21 and Summer ‘21 would come into play.
The distribution targets scattered in that area would be fulfilled, often a signal that the distribution energy is consumed.
In January, I shared distribution counts of sub-$30k.
Last week I shared another distribution target of $25,382.
For a confirmed long-term bullish thesis, I want to see:
Diminishing declines as the long-term demand line approaches to price. Aka shortening of the downward thrust.
The candles should start to contract as prices approach the $25-$30k area.
Volume: If the volume were to be light relative to the Jan. ‘21 and Summer ‘21 clusters, it would be another positive sign to me that the bulls are absorbing supply.

Funnymentals
I do not like to trade off fundamentals, but there comes the point where I can’t ignore some things. I will always trust the charts because they tell what the market is actually doing and not what it should be doing. In the end, the tape is the ultimate judge.
With that said, I’m going to add some fundamentals here only because I feel it is noteworthy:
This week, the bitcoin network mined through the halfway point of the current epoch. The inflation rate of Bitcoin is at 1.8%. It will drop to 1% after the next halving, less than two years away.
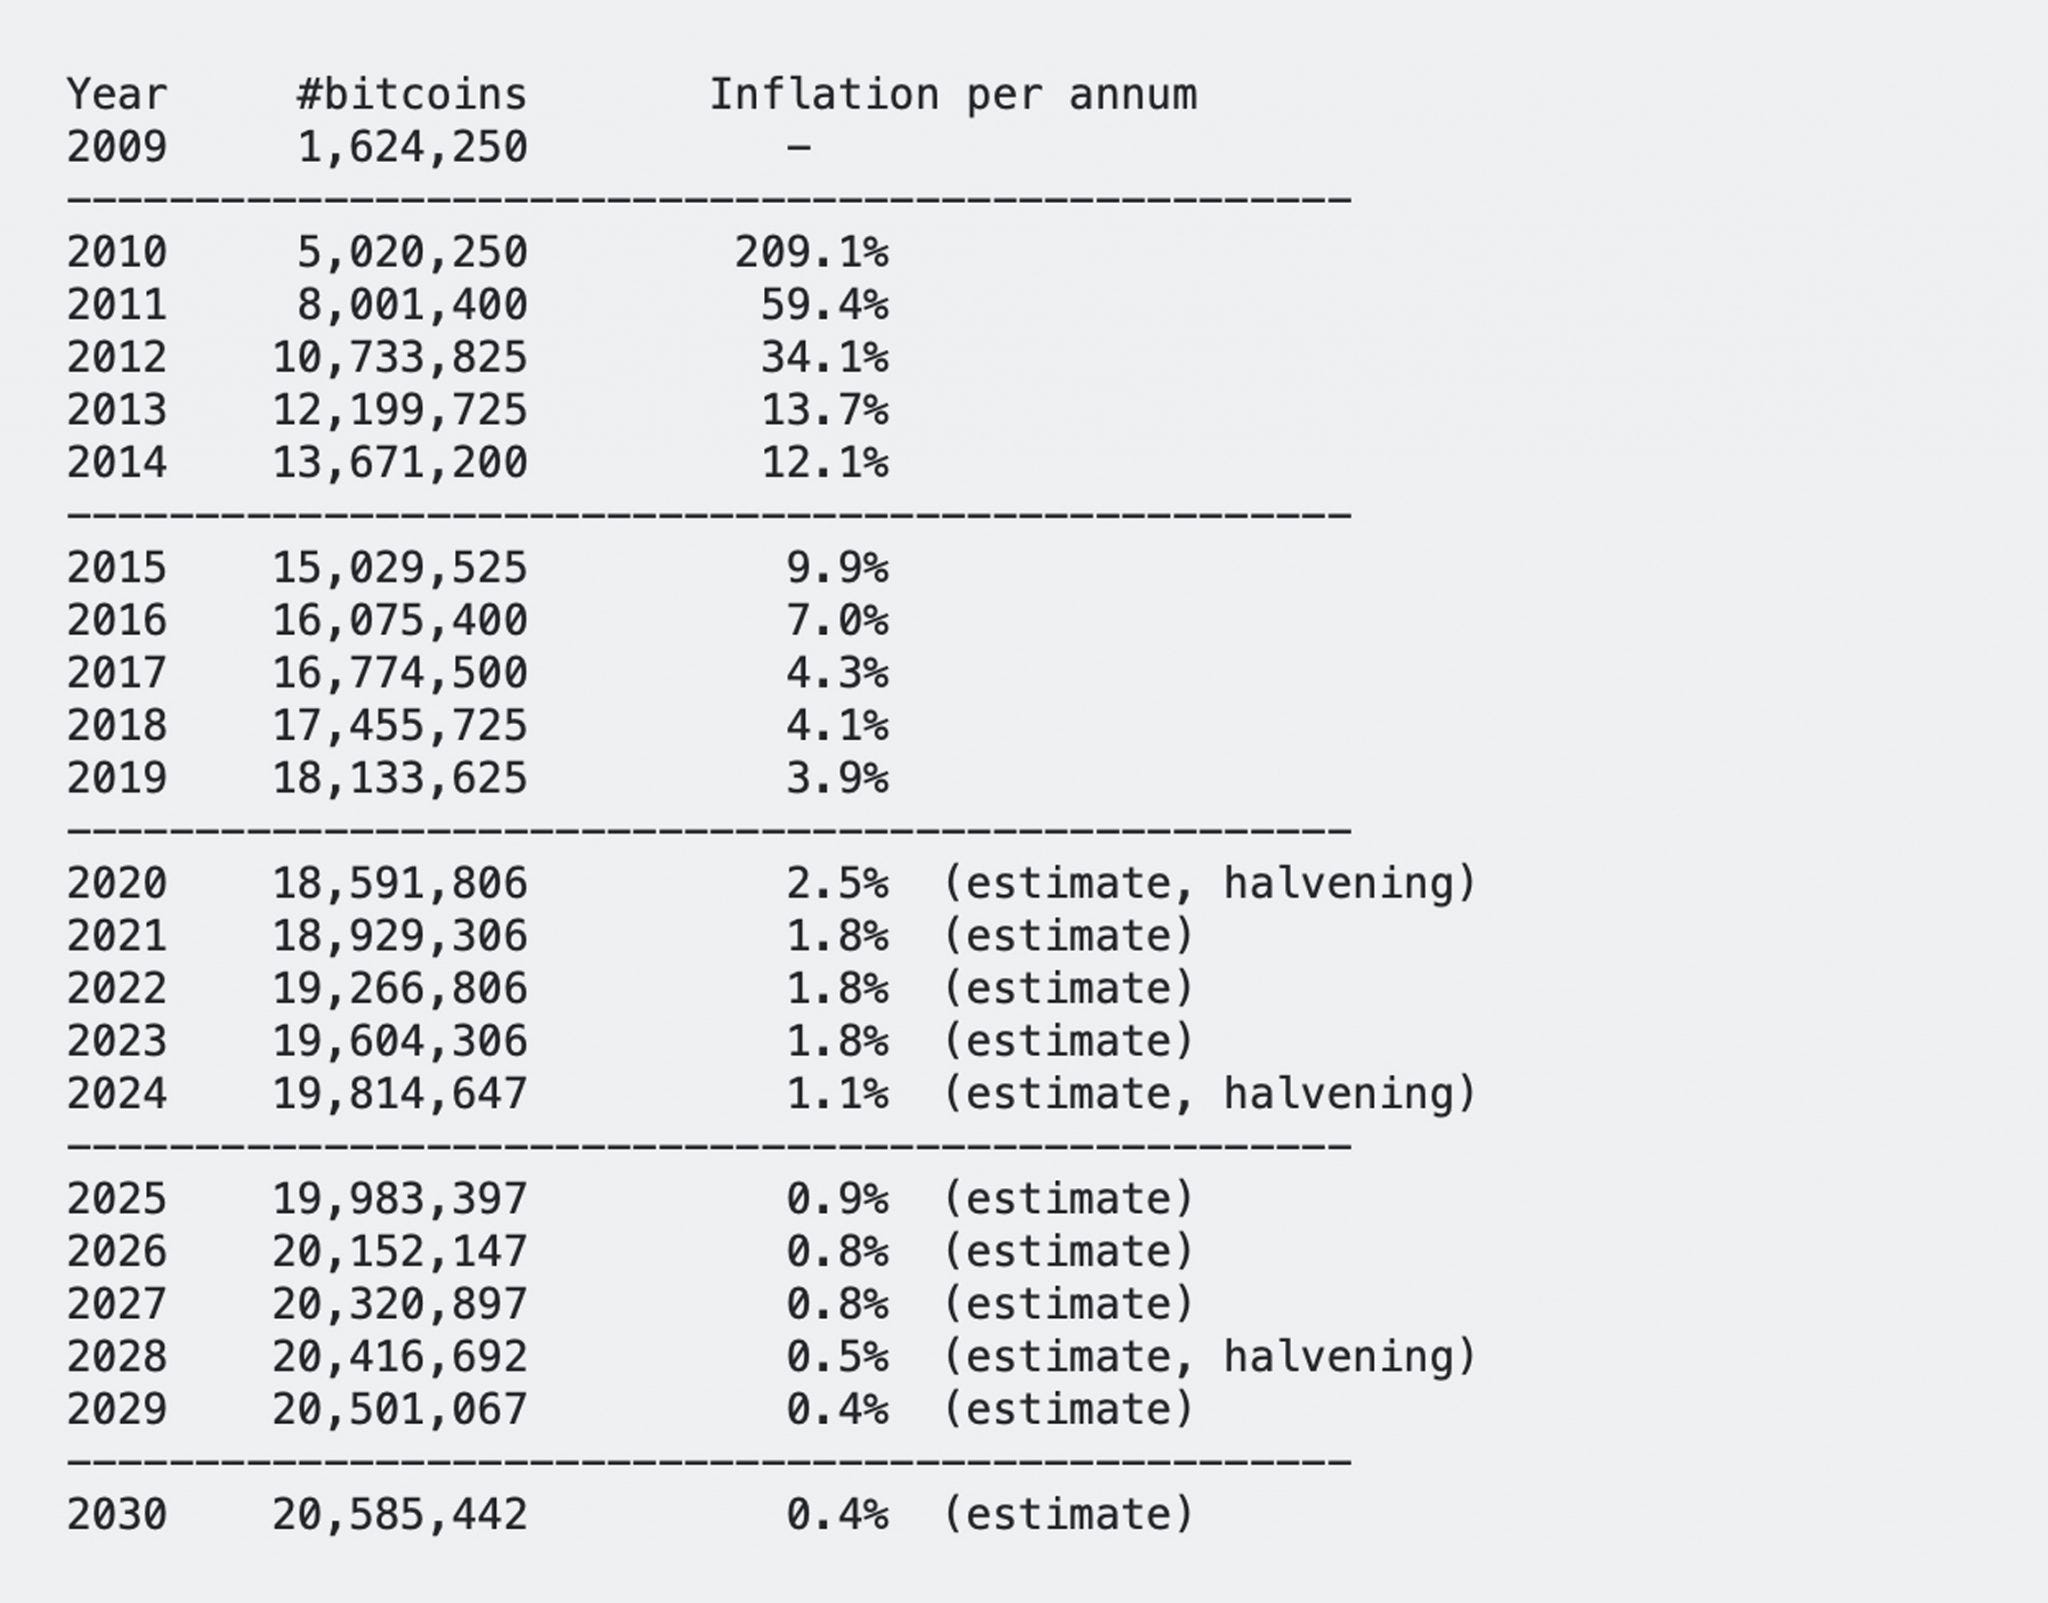
Source: Bitcoin.com
Compare this to fiat currencies, which we all know are inflated away at the will of central authorities.
Some recommended reads: “The Fiat Standard” and “When Money Dies.”
The current inflation rate is estimated to be above 10%, according to Truflation:
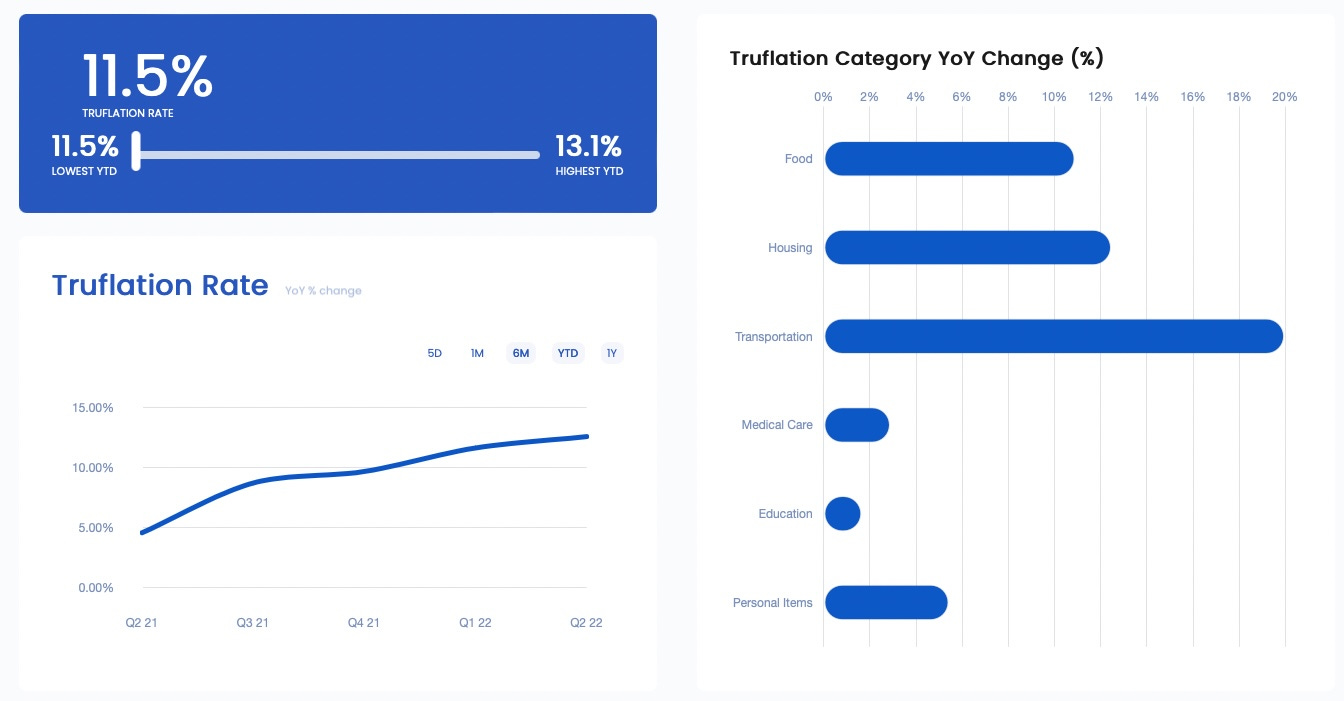
These inflation prints are not sustainable levels. There are plenty of historical examples of currencies dying under these conditions. Eventually, something will give, and history has proven time and time again that the hardest money wins.
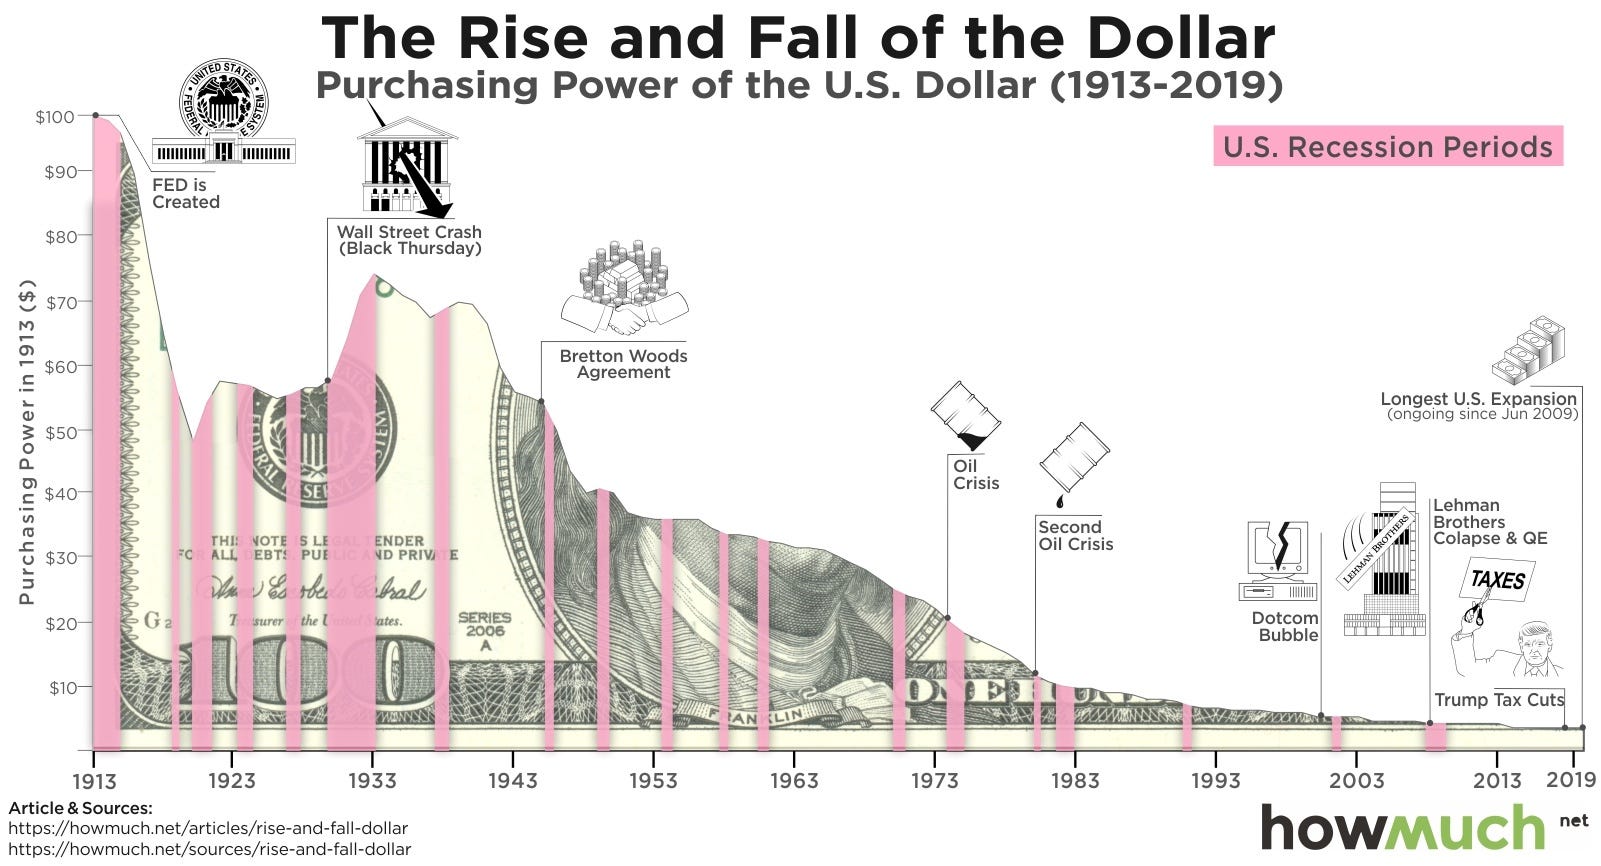
The above image is a few years old, but it gets the point across.
I am not saying the USD will cease to exist; however, it will continue to collapse in value given enough time relative to harder money. The Fed tends to print more and more money each year.
This is why I believe bitcoin is inevitable, and it will outlive most, if not all, current central banks and their respective currencies.
But again, I believe it is essential to separate opinions from trading and investing habits. That is why I follow the charts and respect when the bears are in control. With that said, I believe the time for long-term entries in Bitcoin is coming soon and getting more attractive by the week. I’m looking for the items noted above in the charts.
All the best,
Trace