
Bitcoin Outlook 10-3-21
Bitcoin Outlook 10-3-21
Whales, Accumulation, and Campaigns. Buckle Up.

Good afternoon Bitcoiners!
Today I wanted to share my views on Bitcoin, where I think it’s headed, and what would stop me out if the market proves me wrong.
First, I will start with a weekly chart and a tweet sent out yesterday.
Bitcoin Weekly Candle Chart: 2014, 2018 vs. 2021
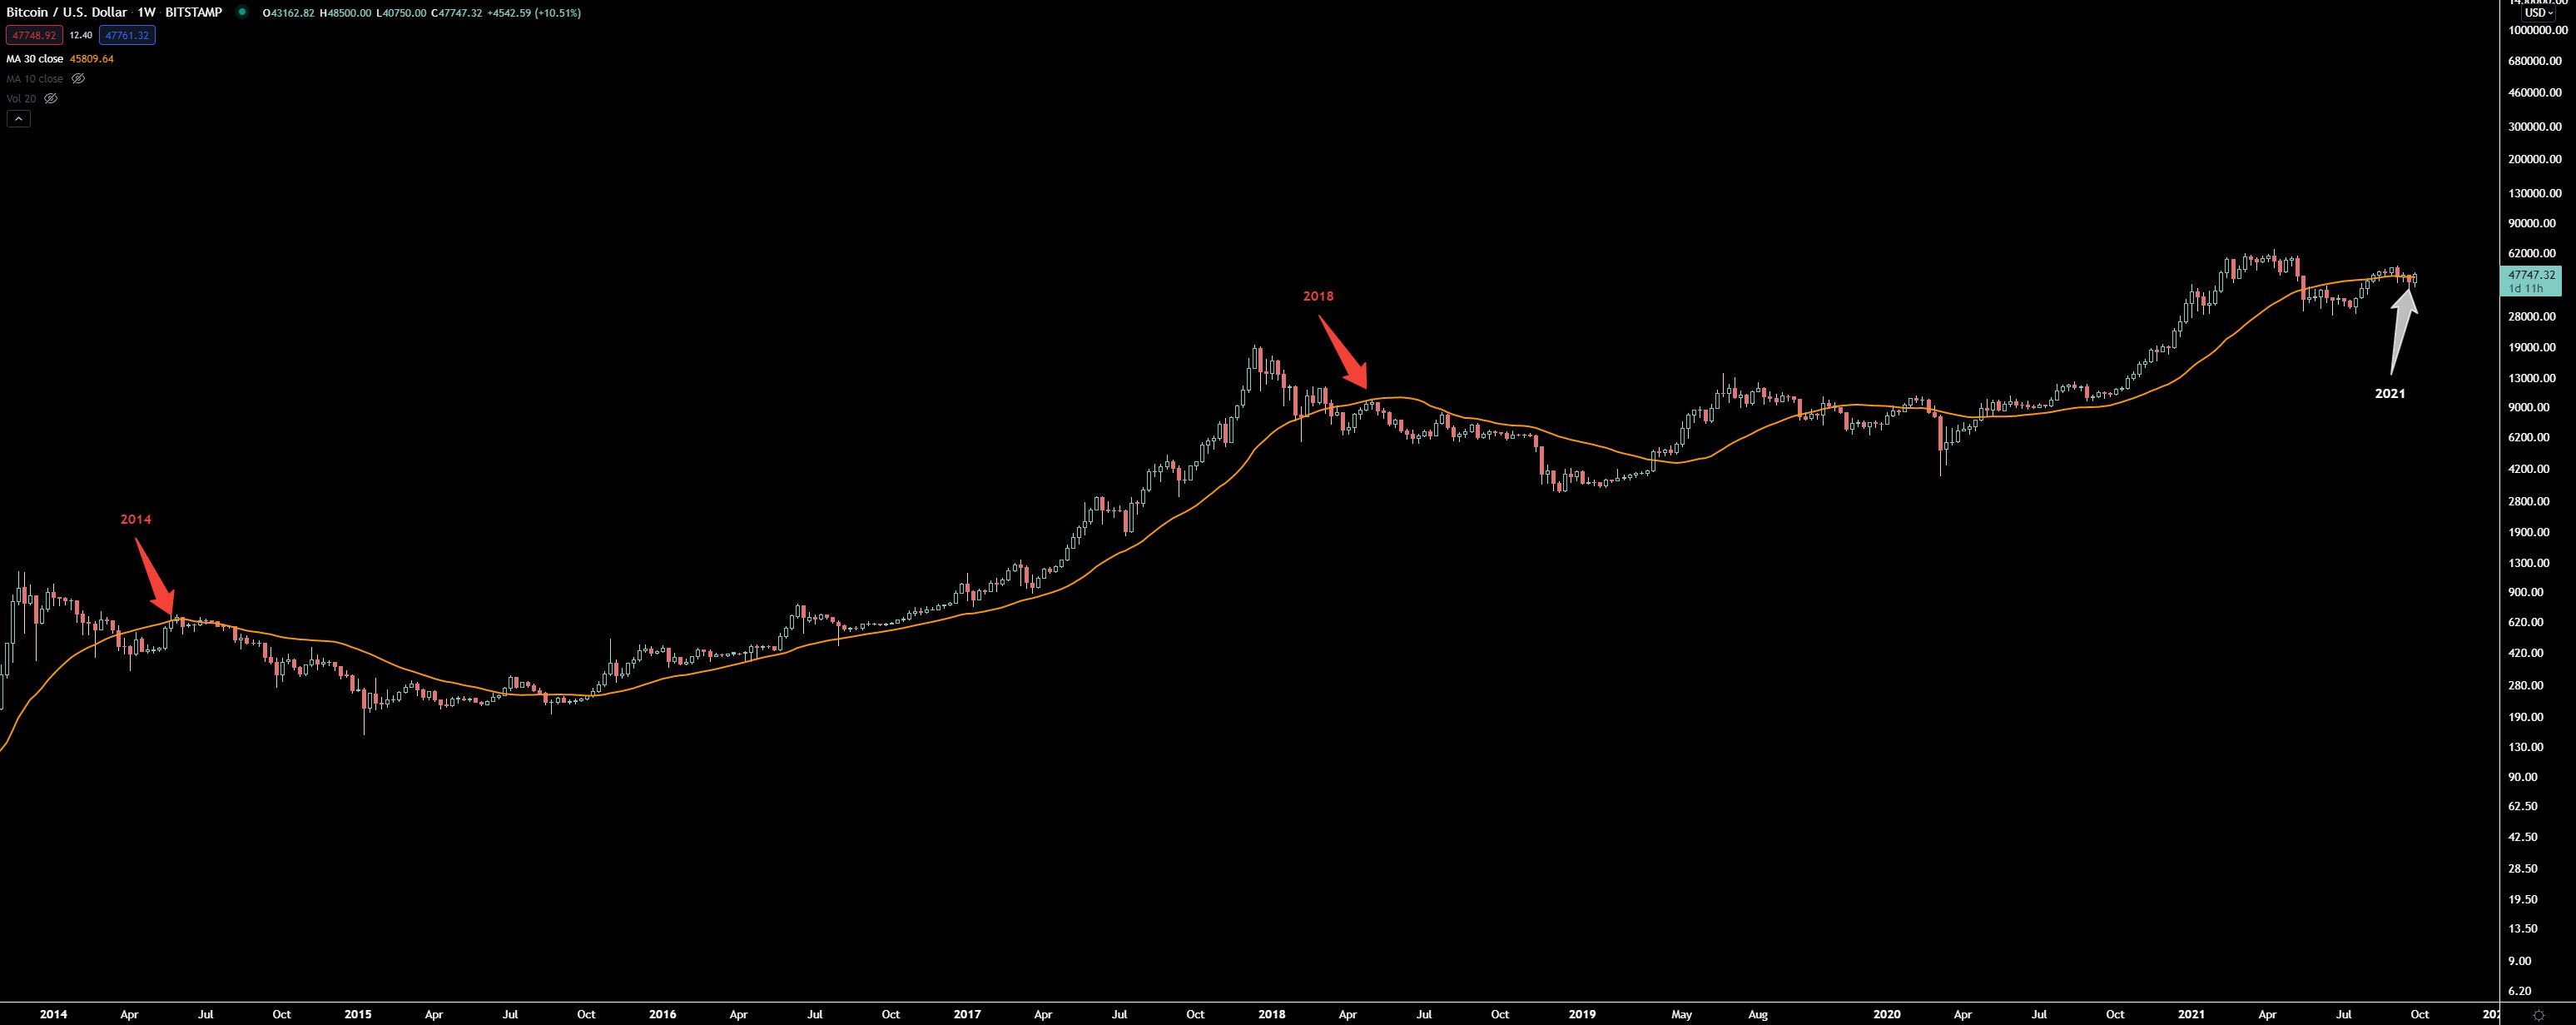
I have been very bullish on Bitcoin. I don’t believe it’s a secret if you go through my Twitter posts. Just yesterday, I tweeted a thread: “#Bitcoin: Think 2021 is like 2014 and 2018 Bear Markets? Think again.”
Here are some key takeaways from what I found during my comparisons to 2014 & 2018 bear markets:
The BTC/SPY ratio has foretold the 2014 & 2018 bear markets for bitcoin. The same signals that were present then are not showing up now.

The 30-week SMA has failed to hold the ratio down. With this week’s (pending) close, the ratio will close above the critical moving average for the third time after the market put in the “top.”

This close above the 30-week SMA NEVER happened in 2014 or 2018.
2014 & 2018:


The momentum (via PPO – bottom of the chart) has failed to put in a bearish crossover as the bulls send prices higher.


Many bears are comparing the 2021 Bitcoin price action to that of 2014 and 2018.
The BTC/SPY ratio chart suggests this time is already different.
I suspect many bears will be in for a rough period ahead, and many no-coiners will be left on the sidelines as Bitcoin enters the next bull run.
This short and sidelined money will only add fuel to the fire as the price ascension gets underway.
Things are about to get crazy, and the market sentiment is nowhere near the euphoric levels of prior cycles.
Buckle up, I say.
From the beginning of my CFF portfolio (started June 2020), I added to Bitcoin at the first buy signal that triggered for me, which happened to occur only one month after beginning the portfolio.
At the time, I shared my views with my followers and a “conservative” count at $89k:

Since then, I’ve added four times as the price continued rising. This persistence to add Bitcoin is because the chart has shown one of the most bullish setups I’ve ever seen.
It wasn’t an accident that I’ve added to Bitcoin four additional times - I truly believed that it represented one of the best reward/risk setups I’ve ever seen, and I can’t emphasize that enough. And I continue to have a bullish outlook as of today.
However, price is king, and it is the ultimate judge of what is true.
I have seen many bullish on-chain analyses lately; specifically, the whales are loading up. The on-chain study is a fascinating aspect of technical analysis.
An excellent & exciting thread on this topic:


Even with bullishness under the hood, none of it matters if it can’t materialize into price appreciation. Price is the truth. And that is all that matters to me.
I had this to say last week:
I believe charts are the truth (price) and opinions (social media, TV, headlines) are noise.
Talk is cheap. But when the market speaks, it behooves us to listen.
The ability to stay as objective as possible and leave emotions out of market decisions is likely to be the most significant difference between the professionals and the amateurs.
Simply put, if the price were to drop below last week’s low from here, I would have to respect the strength of the bears and admit the bullish weakness.
I intend to close my trading longs in the portfolio if Bitcoin were to close below that $39,500 low wick from last week (weekly closing basis).
Hopefully, it doesn’t come to that, but I want to be clear on my plans.
Whales, Accumulation, and Campaigns:
When looking at price through the lens of Point and Figure charts, It does make sense that the whales and Dylan’s “Long Term Holders” have been loading up their wallets.
Perhaps the most significant benefit to Point and Figure charts is the ability to calculate the potential upside move after an accumulation has taken place. In Bitcoin’s case, the charts strongly suggest that there is enough unrealized energy via accumulation to support a robust and lasting move.
Last weekend, I sent out a quiz that asked to calculate the price objective of a Bitcoin Point and Figure chart:
The winning answer of $331,396.14 was rewarded with 100,000 satoshis. Please go back through the Resources and learn to count these targets.
I think you will find it very helpful in your market endeavors. I may be sending future quizzes out with similar rewards, so why not learn something new and potentially get rewarded at the same time.

In the above chart, the 20 columns in the count were from the 2018-2020 price action. The resulting target of $331k has already been established for well over a year, where I believe the whales loaded up.
Dylan’s great thread refers to more recent long-term holder action, which I view as a reaccumulation, and their footprint is revealed at the top right cluster of Xs and Os from 2021.
Using PnF, we can count the target from said reaccumulation:
I will use the 11 columns from the furthest O on the left to the current column on the right.
The conservative anchor would be the lowest O in the count, which comes in four times at 30,493.82.
And of course, the reversal and box size values remain the same at 3 & 8%, respectively.
The resulting reaccumulation count: $386,541
The reaccumulation count is close to the primary 2018-2020 accumulation count of $331,396, which often signals the market is ready for the next leg.
Why did the Bitcoin price chop around for 11 columns instead of 9? Well, if Bitcoin had started its move higher from a 9 column reaccumulation, the count would have been $243,586 - about $100k below the primary accumulation count.
It’s not necessary to get a matching count. Still, I believe the whales (Wyckoff’s Composite Operators) simultaneously accumulate and test the market, absorbing every last share (or, in this case, coin) before the markup period begins.
I’d recommend going through the calculation exercise above, especially if you study or want to understand market campaigns better. You can then test this on most stocks/cryptos to see what I mean.
Seasonality:
Earlier on Twitter, I mentioned Bitcoin’s seasonality, and Oct. 1 - Dec. 31 has been a very bullish period for Bitcoin in years past. Here is what I found (link to the Twitter thread here):
Bitcoin finished the bearish month of Sept., only down 7%. Historically September averages -8% returns. Bitcoin now enters the 2nd most bullish quarter of the year (Oct 1 - Dec 31).
The most bullish quarter is from April 1 - June 30, with +69% average returns.

The period bitcoin is about to enter comes in as a highly bullish period, at +65% average returns.
When considering the bullish only years (9 out of 11), the returns from Oct 1. - Dec 31 are a staggering +101%
However, when filtering for the prior two-cycle tops only (2013, 2017), things get crazy. The average returns from Oct 1 - Dec 31 are +206%


Long term trend:
Just keep it simple:
Buckle up, my friends. There is gas in the tank for $300k+, and I even have PnF counts over $2 million. That is not a typo. But as always, risk management is of paramount importance, and I know where the market could prove me wrong and my stop level. To borrow from the great “Pit Bull” by Marty Schwartz:
Honor Thy Stop:
One of the great tools of trading is the stop, the point at which you divorce yourself from your emotions and ego and admit that you’re wrong.
Don’t let your emotions cloud your judgment. When the markets speak, it behooves us to listen. The market is the ultimate referee between bulls and bears in the never-ending battle. But until the market proves us wrong, enjoy the epic ride. It’s poised to be a great one.
All the best,
Trace