

Bitcoin & Ethereum Update
Bitcoin & Ethereum Update
2/15/21 - Charts & Targets


I have a lot to say about recent developments in the Bitcoin space, (Tesla, Miami, NY Mellon Bank, etc.) but I’m going to be sticking to charts for now. As always, I believe the tape speaks for itself. So without further ado, here are the charts.
BTC & ETH:
Here is the ETH/BTC ratio:
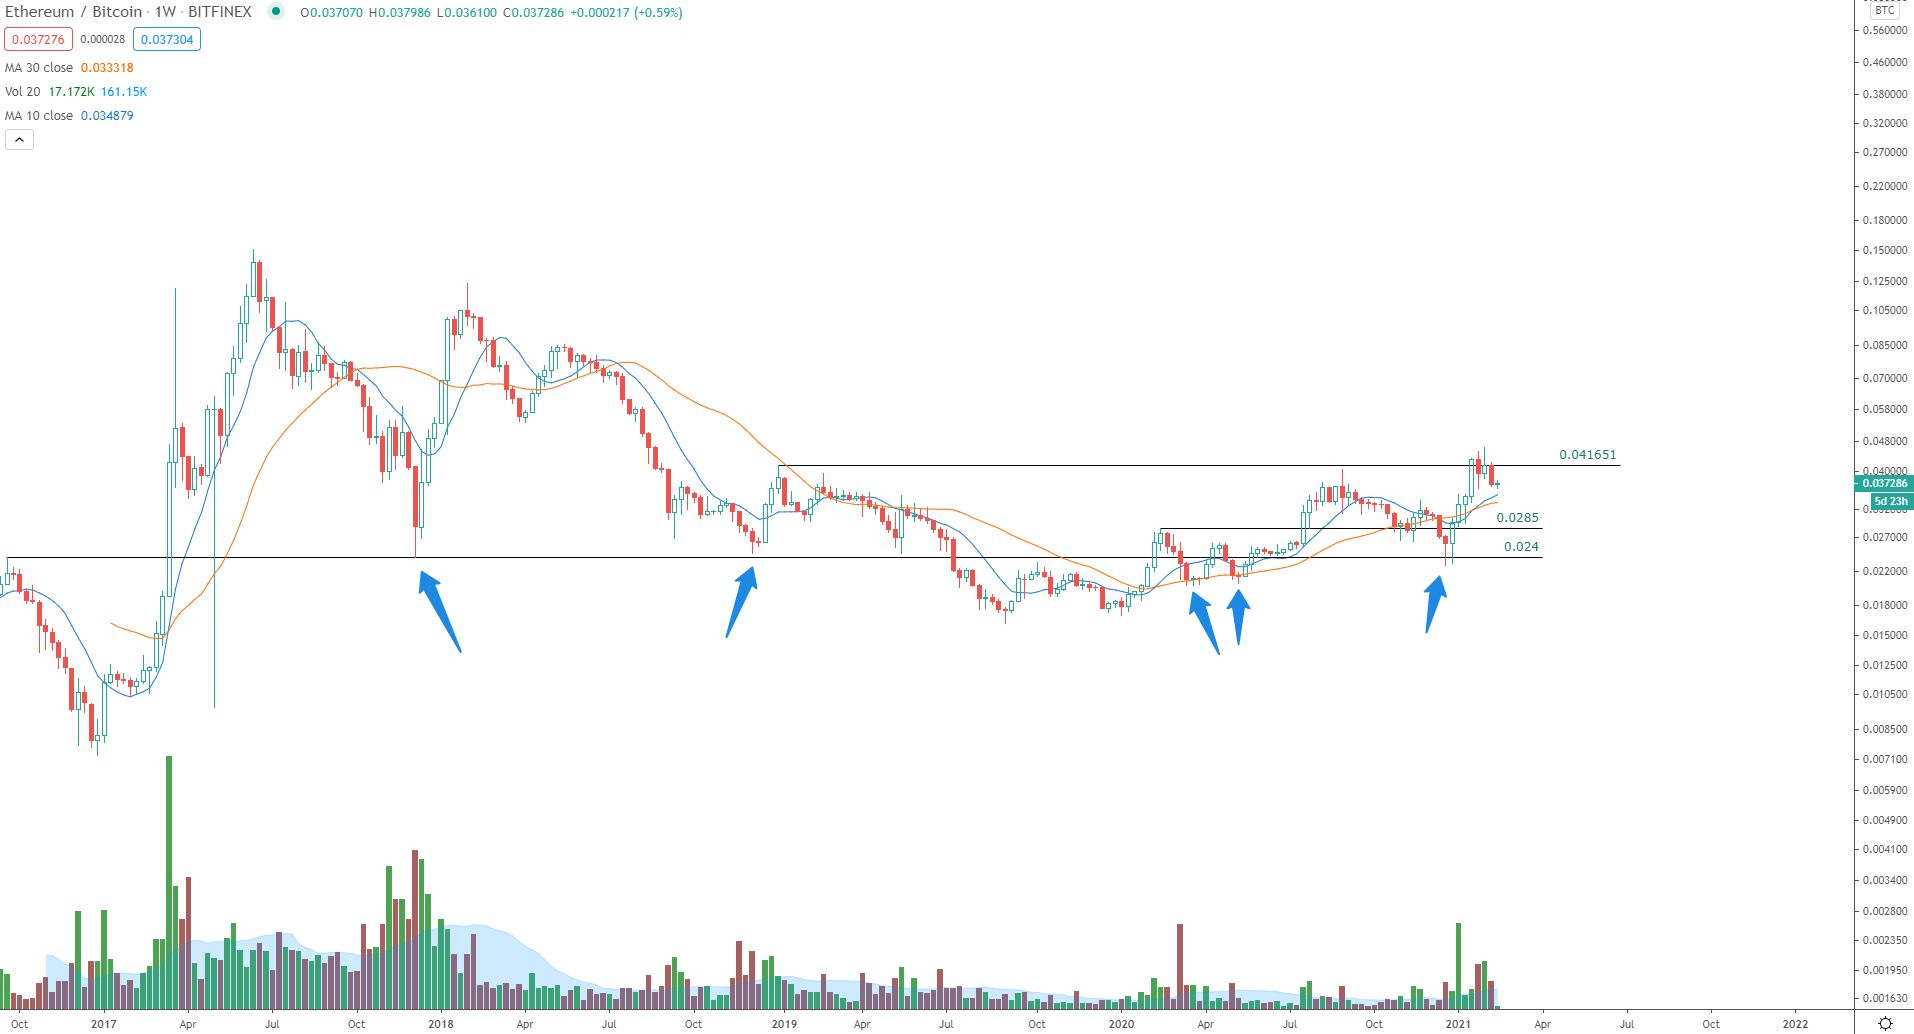
The ratio is pulling back into the prior trading range, but this time the rising 10 & 30-week sma’s are just underneath. With the shakeout earlier in the year, this ratio could be setting up for a solid move higher
I’d like to get rotated back into more ETH, but first what I’m looking for is a solid bounce from this current area (0.037). If I see that the ratio can use this area as support, and put in a move back towards that 0.040 level, it might be time to pull the trigger
Shallow pullbacks late in trading ranges are often times the sign of Phase D ending (late stages of consolidatoin), and the markup phase is to follow. Mr. Wyckoff often times sought out the setups that were entering the markup period (Phase E), which is one of the most rewarding periods to be in the position.
Here are the candle charts of each:
Bitcoin:
Three targets noted on the chart:
Vertical Target 1: $165,780. This target was generated using the 8% chart, vertical counting method, with close-only chart settings.
Horizontal Target: $310,511. This target was generated using the 10% chart, horizontal counting method, with high-low chart settings.
Vertical Target 2: $2,101,445. This target was generated using the 8% chart, vertical counting method, with close-only chart settings.
All targets are noted on the chart, and all are active with the recent move higher into the high $40k area. This is setting up for an incredible move, and Bitcoin remains a super winner in the portfolio. While I could see the first two targets coming into play this cycle, the $2 million target just seems too far away this time. If this were to happen, I suspect it wouldn’t be for another cycle or two after many months of reaccumulation.
As it stands now, the $310,511 target would be an approximate 6.5x move from current prices.
Here is the 8% Point and Figure Chart used for the vertical counting methods
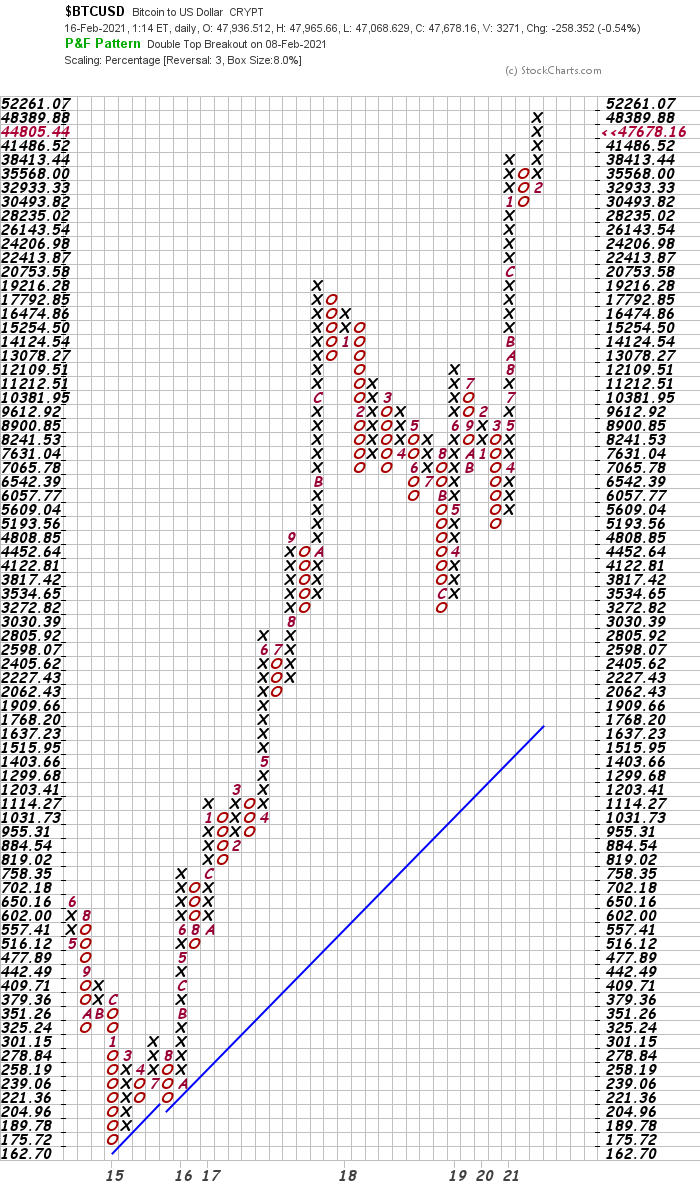
You should be able to generate this same chart for free at stockcharts.com (Using the Daily time period, Close Only method with 3-box reversal and Box Size = 8%)
The two vertical thrusts used are the long columns of ‘Xs’. (2019 and 2020)
Ethereum:
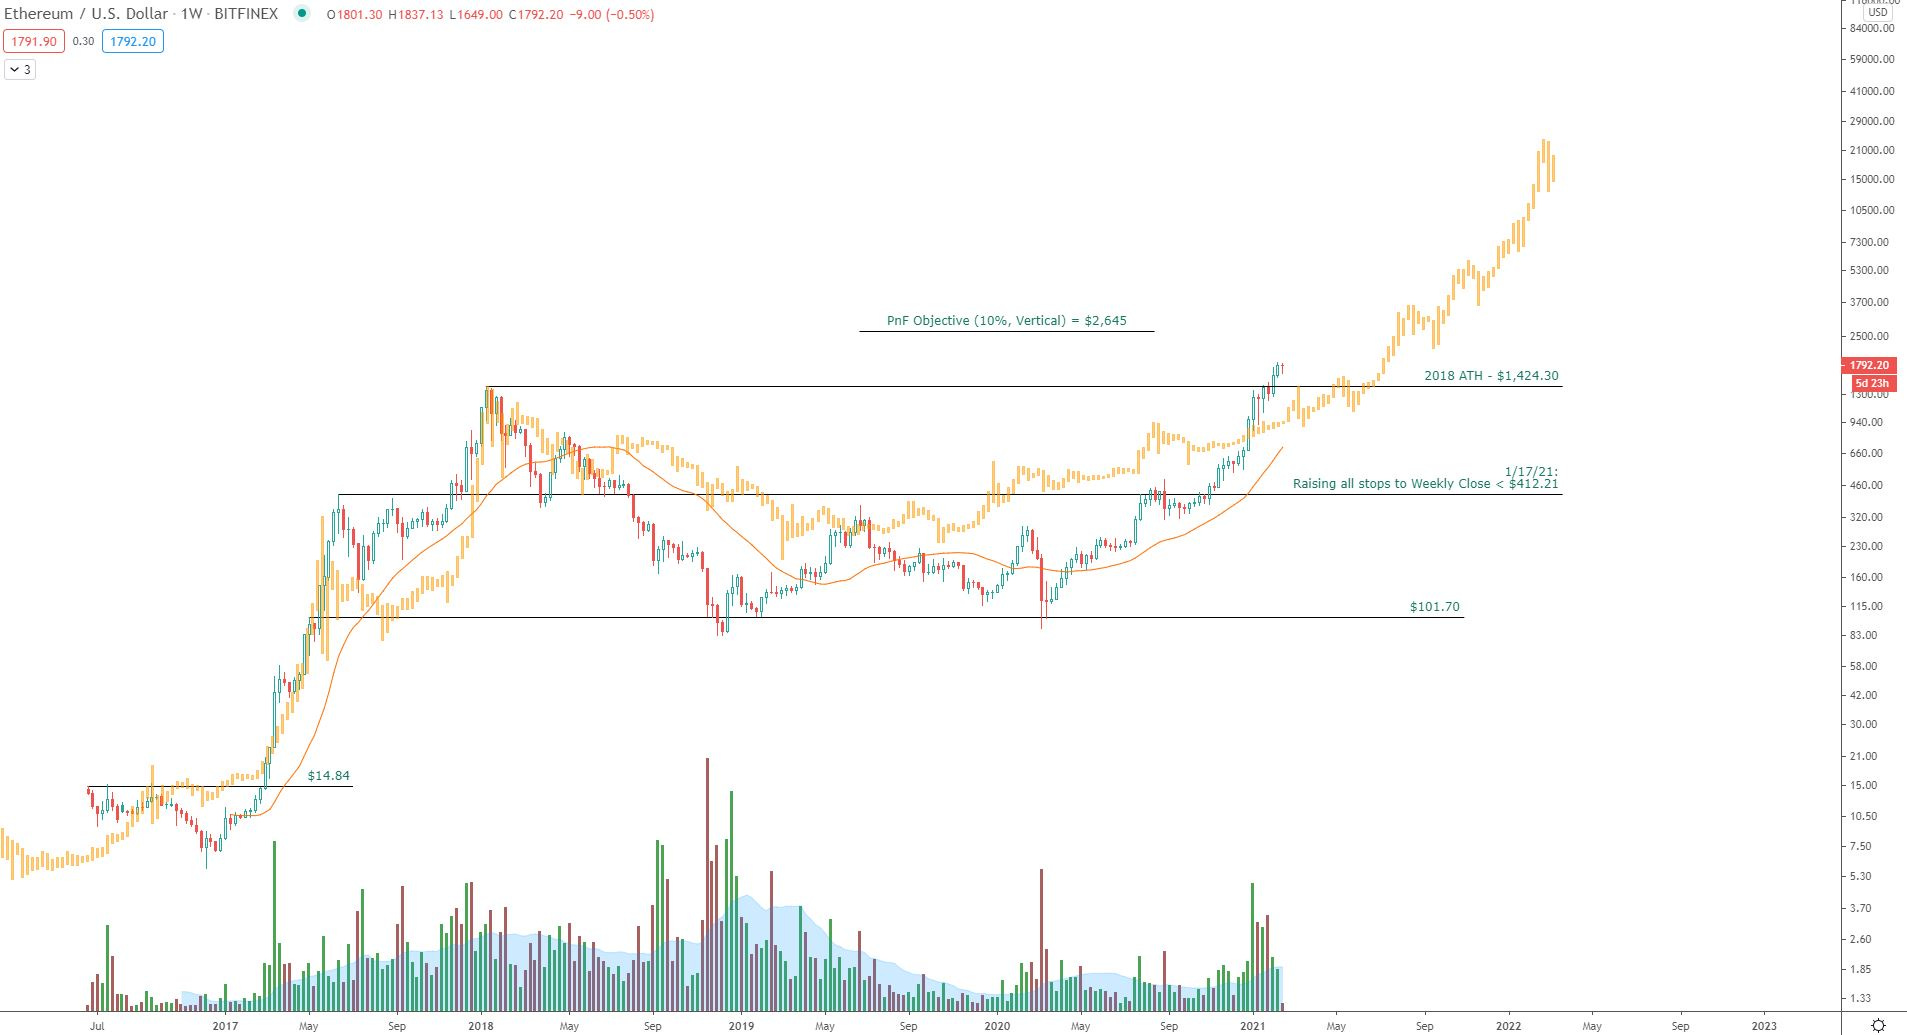
I’ve overlaid the Bitcoin chart in orange. I’ve lined up the peaks from the BTC 2013-2017 rally to the last ETH 2016-2018 rally
You can see the price movements are very similar! This analog suggests the current rally in ETH is about half way done, and the potential log scale move could see prices landing around $20k
This would be more than a 10x move from where prices are trading now
These are exciting times. Bitcoin and Ethereum appear to both be in their respective markup phases. Upside targets are high. Pullbacks should get bought up. It should show up on the tape via the candle expansions & contractions and volume. That’s what I’ll be focusing on.
Headlines bullish and bearish variety are flowing in. The FUD is high. Many doubters and altcoin pump & dumpers out there. With so much noise everywhere, I plan to stay the course until the tape stops me out.
Have a great week,
Trace