

Bitcoin & Ethereum - Next Target Range
Bitcoin & Ethereum - Next Target Range
What the Hourly PnF Charts Are Showing

Good morning,
As you might be aware, the Bitcoin rally from October ‘20 -Feb ‘21 resulted in a 450% rise in ~130 days. A gain like this, for any market, needs time to settle down. Profits need to be taken. New hands need to enter, and weak hands get shaken out. Human emotions and psychological effects from fear & greed find their way into every market. Headlines of the FUD, bubble, tulips variety always seem to find their way into any stock that has such a dramatic rise. All of this gets factored into the tape, and it doesn’t lie. It is my humble opinion that you can ignore all the noise and strictly focus on the price - because that is all that matters. If the news is indeed terrible, the tape will show it and vice versa.
As a result, what the tape shows is that Bitcoin and Ethereum have consolidated very nicely over the last 2-3 months. They digested gains, headlines, FUD, etc. They have built the cause for the next move. It is my goal to measure the potential effect, as I will attempt to show below.
With the recent breaks to the upside, the charts are setting up for a decent leg up for each, in my opinion. Ethereum just broke to new all-time highs recently. Bitcoin, which already accomplished this feat in December, isn’t far behind establishing new all-time highs.
Using the ATR% charts of each, I can see the volatility (shown at the bottom).
The Jan-Apr ‘21 chop averaged somewhere between 2-3% ATR on the 60-minute candle charts for both coins.
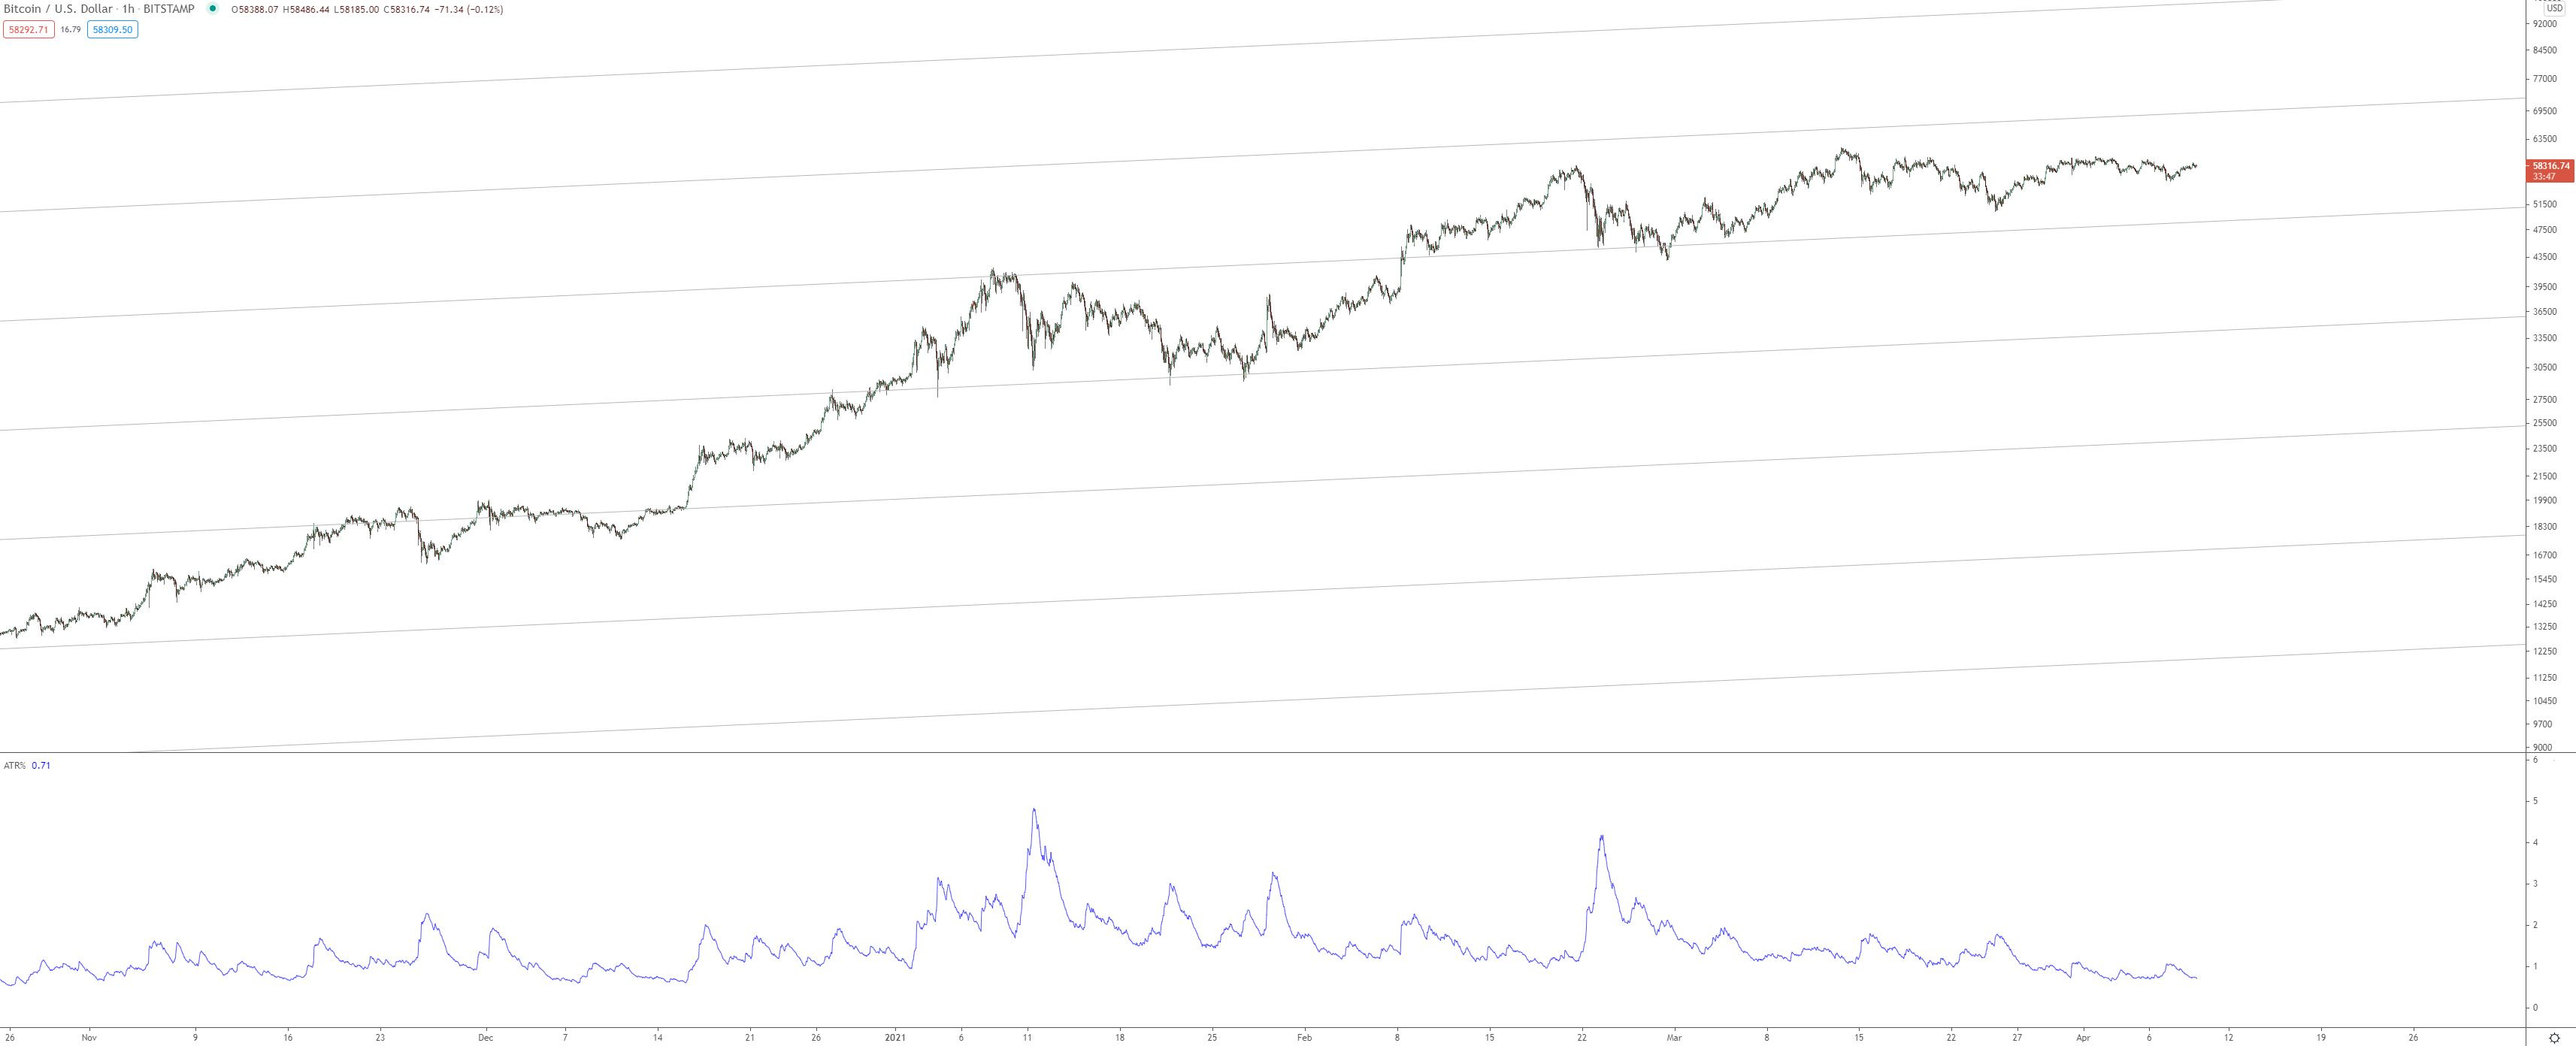
Bitcoin targets (via 60-minute PnF)

Using the point and figure counting methods on a 2% box size chart, I have highlighted the two areas from the recent consolidation period.
The blue consolidation area, which represents the Jan ‘21 re-accumulation, yields a PnF objective of $92,498.
The green consolidation area, which represents the Feb-Apr ‘21 re-accumulation, yields a PnF objective of $94,348
These counts are very close. In fact, they are separated by 1-box on the 2% chart. If price were able to achieve the lower of these targets, it would represent a 53% gain from current prices, as I type this.
Ethereum
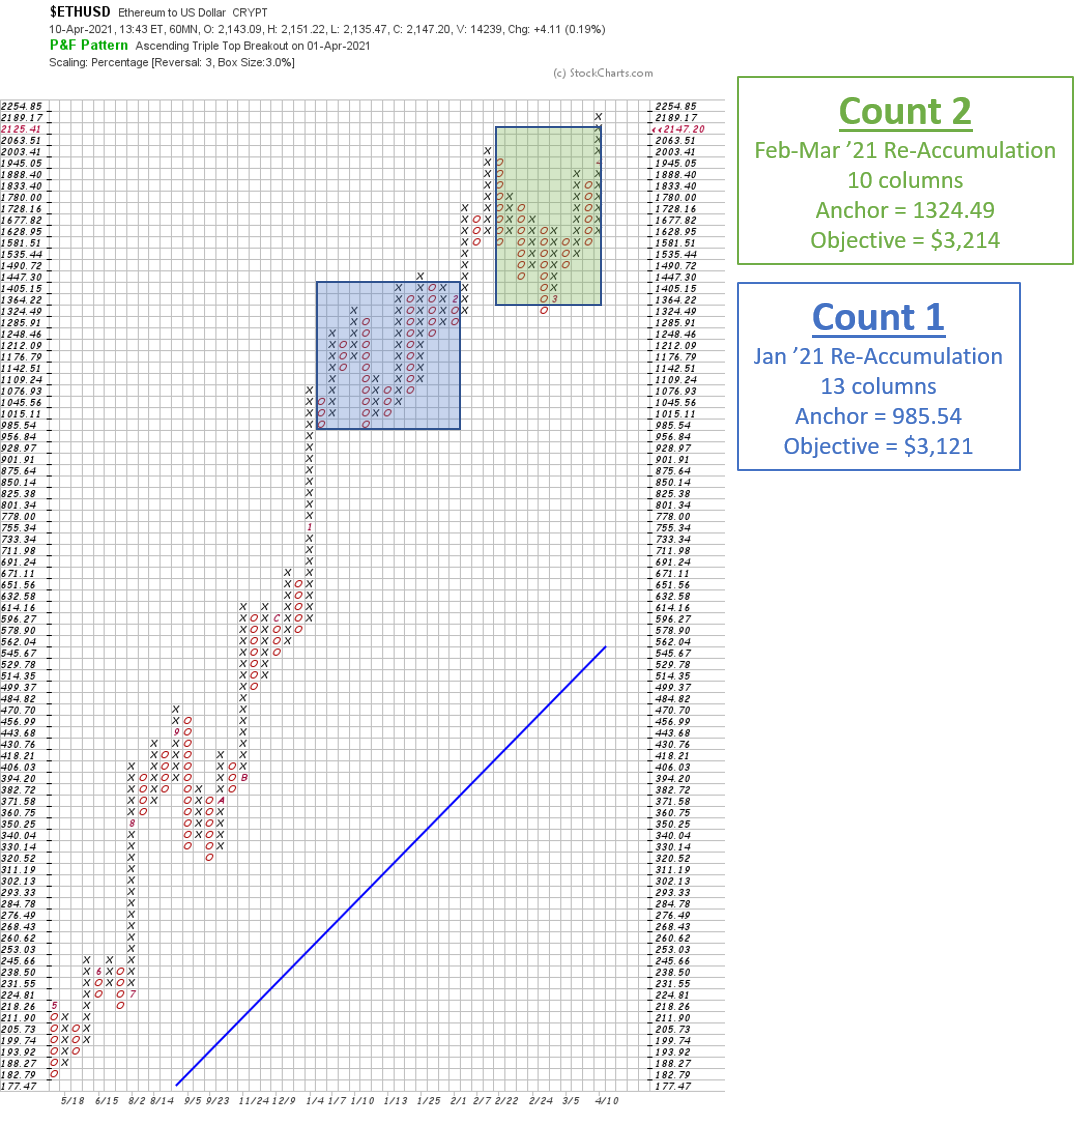
Using the same logic from above, I have charted the 3% PnF for Ethereum.
The results are very similar:
Blue area yields $3,121
Green area yields $3,214
These are also separated by 1-box on the 3% chart. If price were able to achieve the lower of these targets, it would represent a 48% gain from current prices, as I type this.
These don’t represent what I believe to be the topping points of this bull cycle. The daily PnF charts yield higher targets, but I wanted to get a little more tactical and look at the hourly charts to see where the next landing spot might be for these. I am long Bitcoin and Ethereum in the Charts for Freedom Portfolio, and I hold Bitcoin Options contracts. Due to the time-sensitivity of the options, I want to get as tactical as possible.
I hope you enjoyed this post. If so, please hit the subscribe button below.
Thank you,
Trace