

Bitcoin and Altcoin Positions & Charts
Bitcoin and Altcoin Positions & Charts
A look at my positions and various charts with targets


Good afternoon, I wanted to get a post out with updates on some of the crypto trades I posted back in June/July and other crypto charts I have been following in general. I think it’s a good idea to track the overall crypto market with Bitcoin to get a better sense of the bull market the space is experiencing.
So first, the most important chart, Bitcoin. In my opinion, without a bull market in Bitcoin, the vast majority of altcoins are suspect, and I would be very cautious on the space.
So here are the charts of BTC relative to various benchmarks (SPY, QQQ, Gold).
Note: for more historical data points, I am using the $BLX ticker on TradingView (BraveNewCoin Liquid Index For Bitcoin)
Here is the BTC/USD chart:
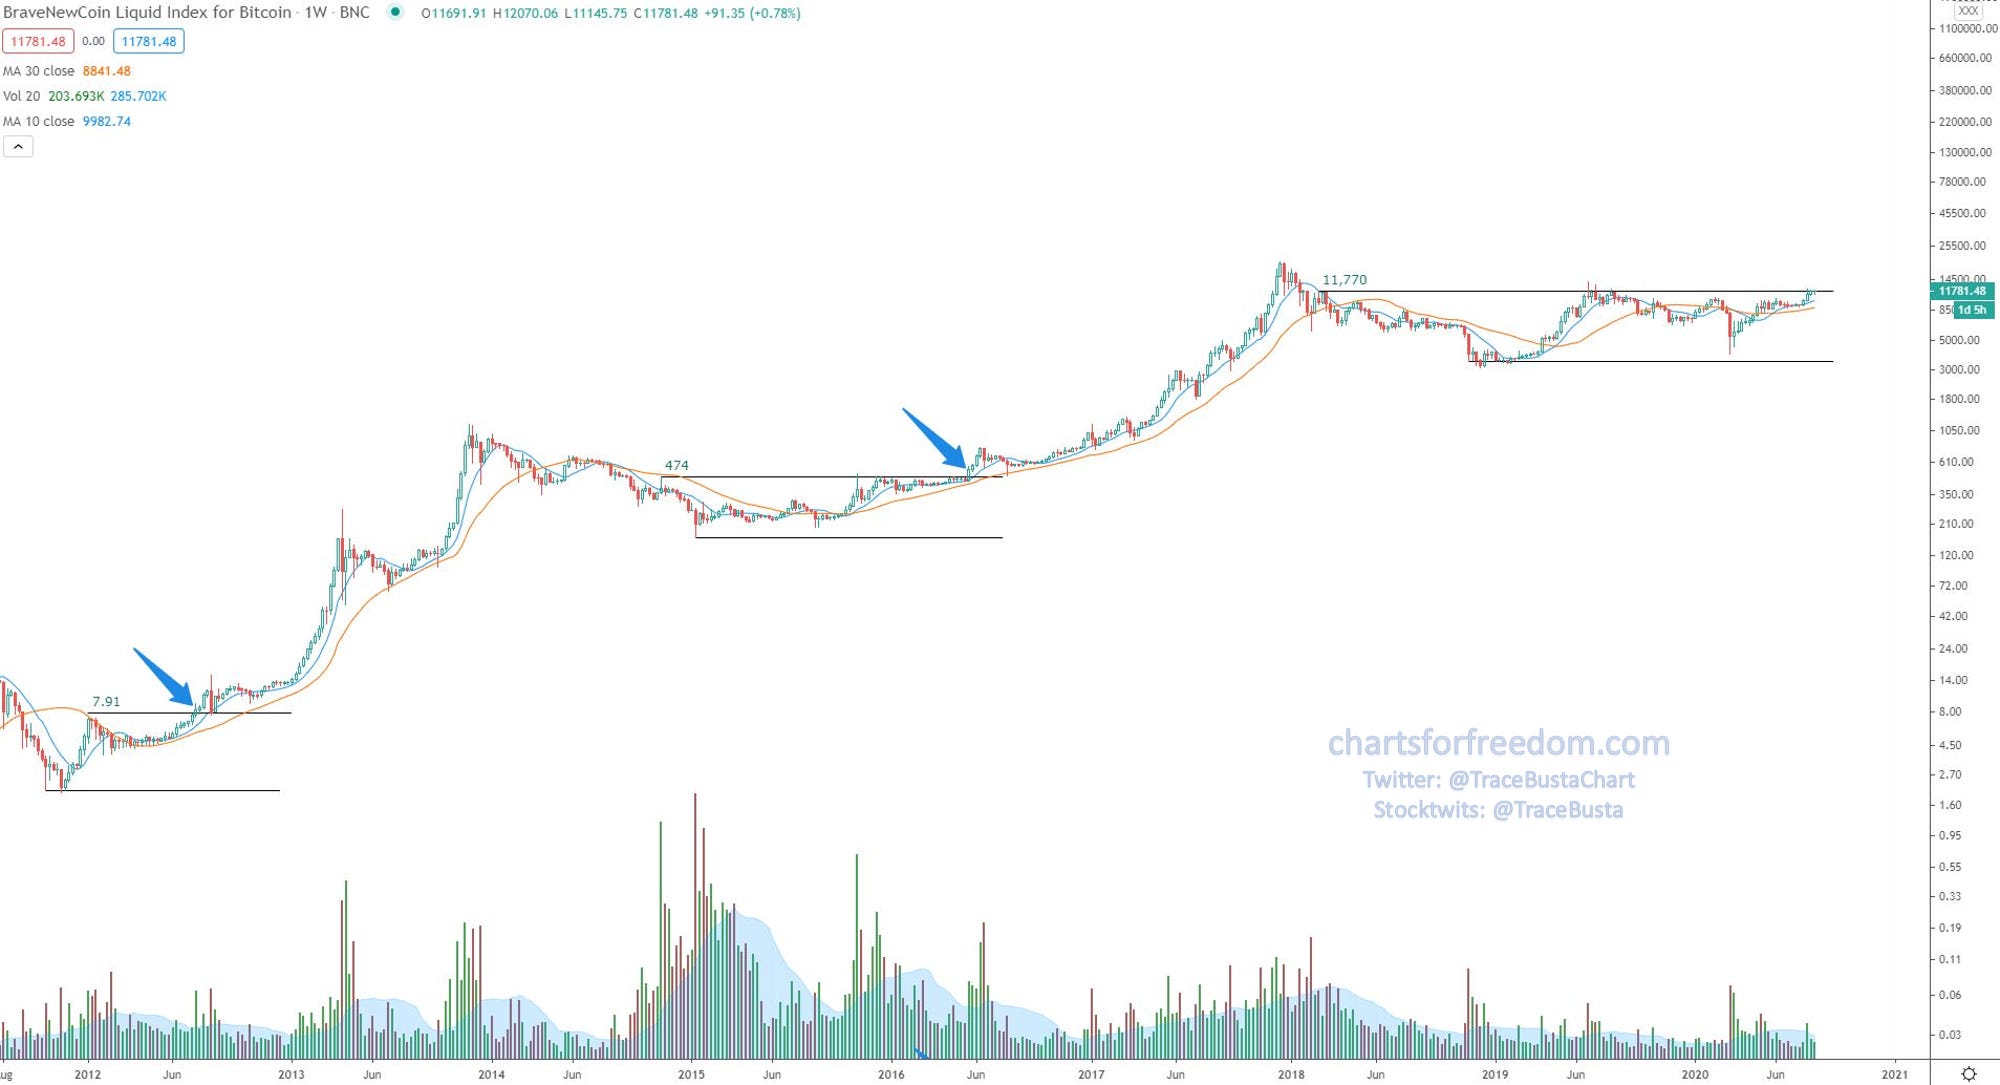
It hasn’t cleared the key resistance level of $11,770 on a weekly basis, but it is very close to it!
Here is the BTC/SPY chart:
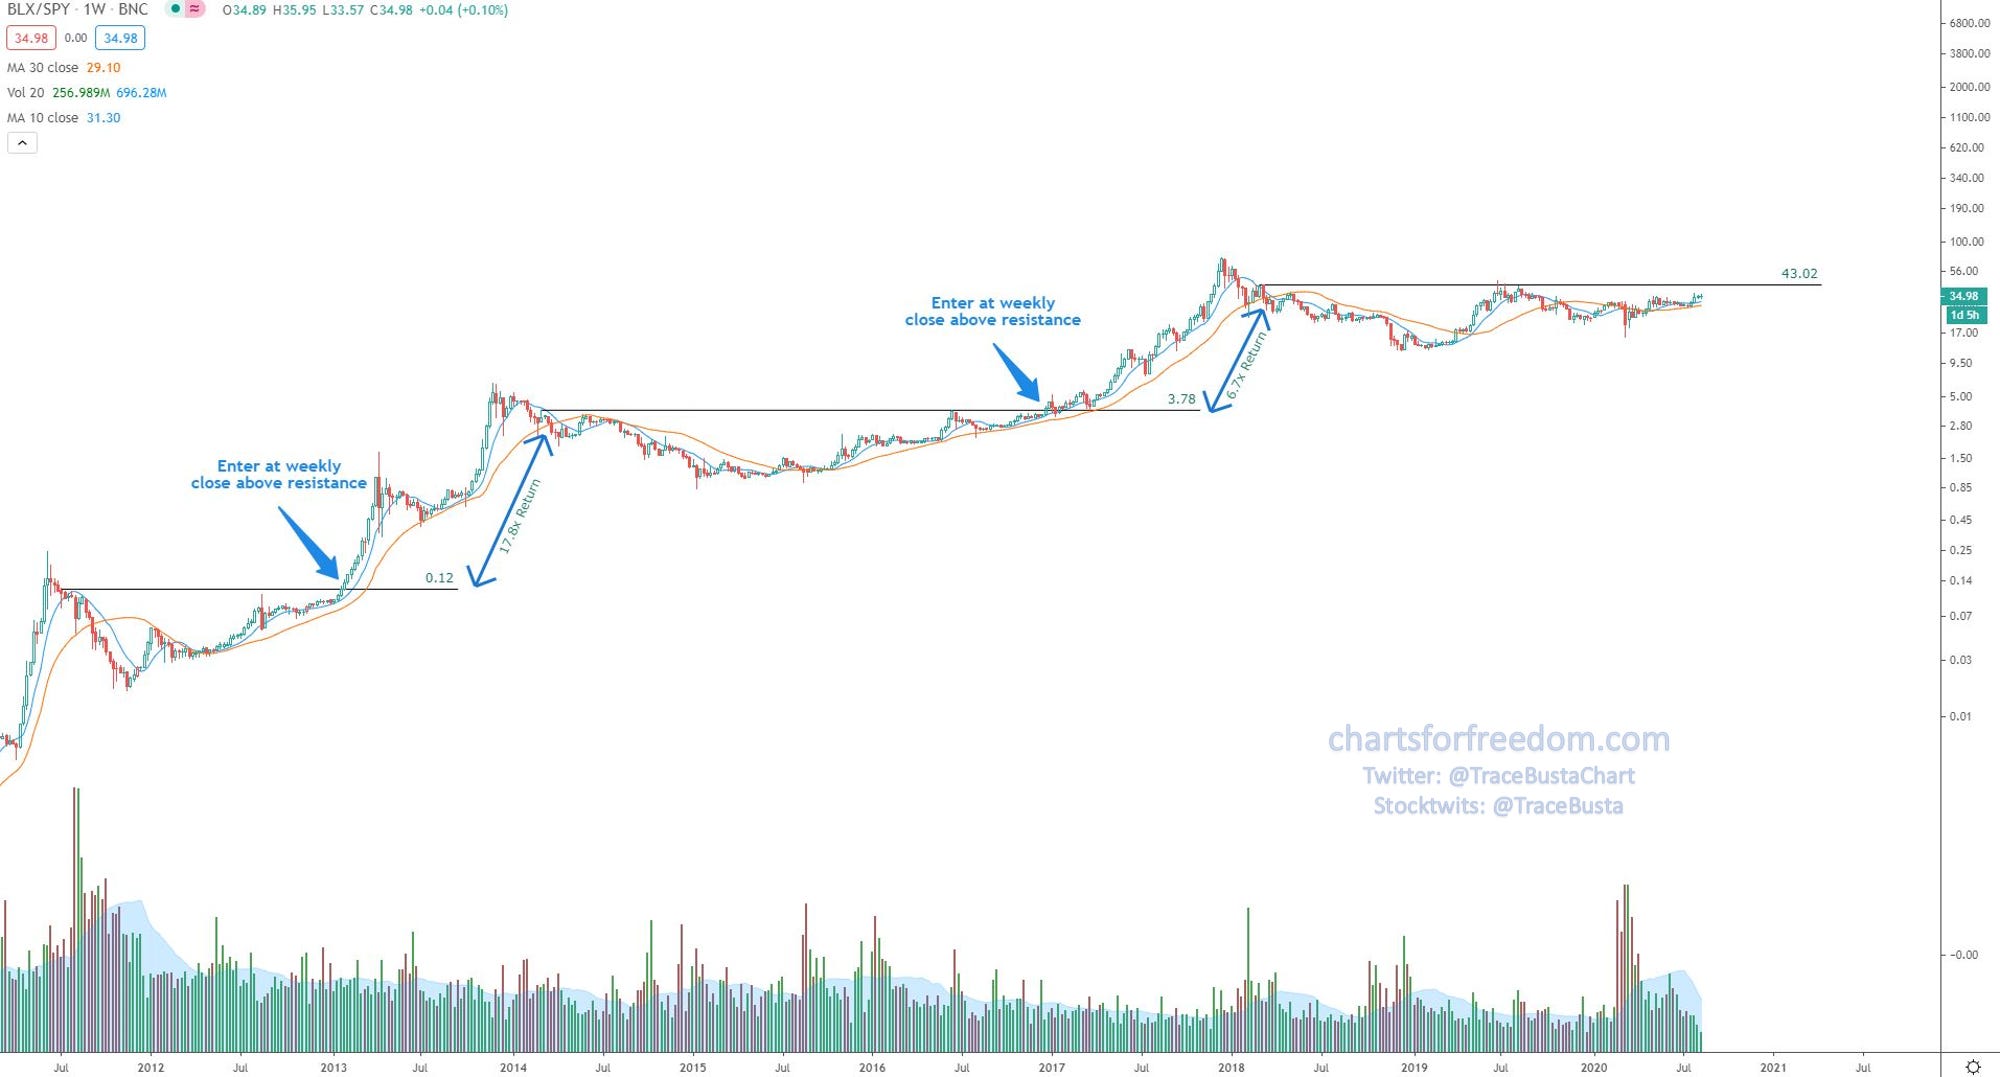
I would expect things to get very accelerated once it clears past the 43.02 ratio level
Here is the BTC/QQQ chart:
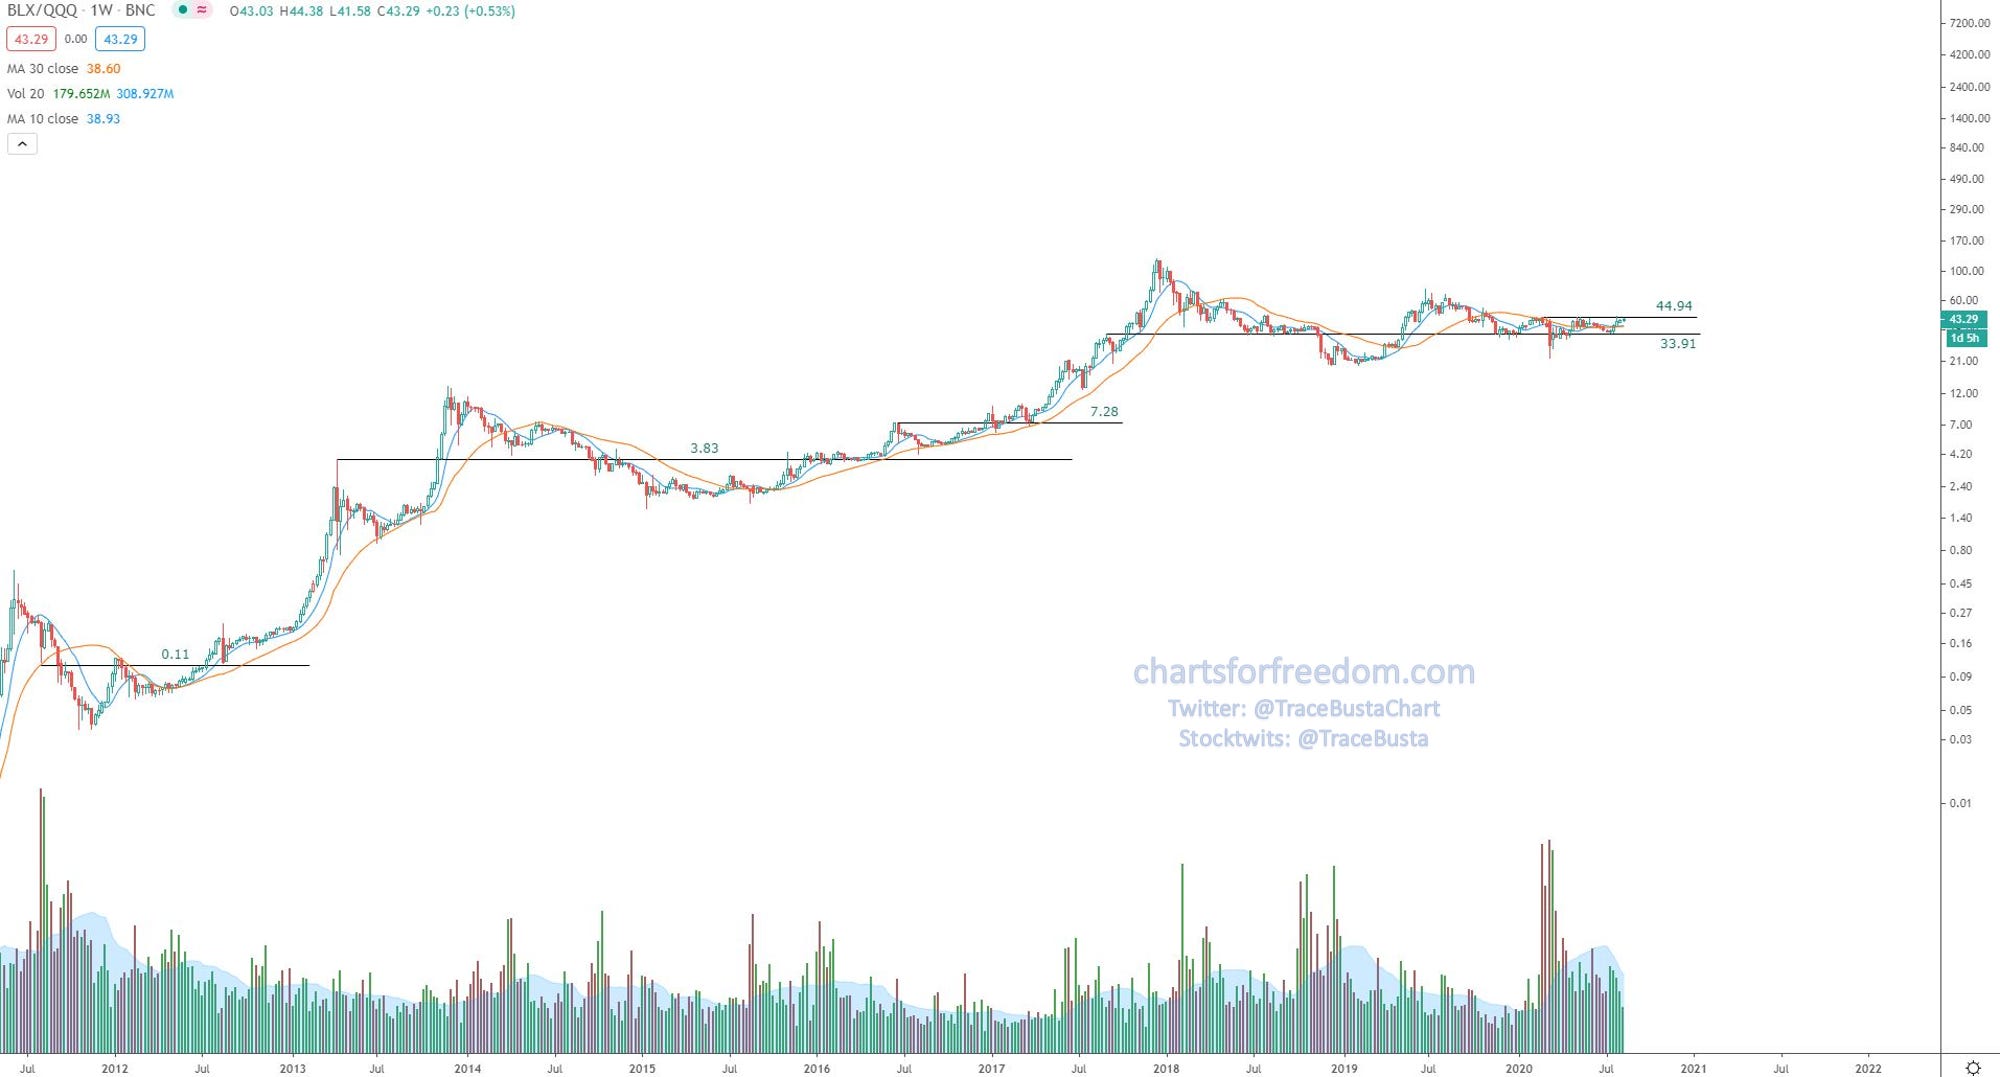
It is hard to see, but BTC is now showing an uptrend vs. QQQ when using the 10 & 30 week sma’s as the metric. The ratio is above a rising 10-wk sma, which is above a rising 30-wk sma.
Similar to the BTC/SPY ratio, things should start to accelerate and get that parabolic look to them once the 45 level is cleared.
Here is the BTC/GOLD chart:
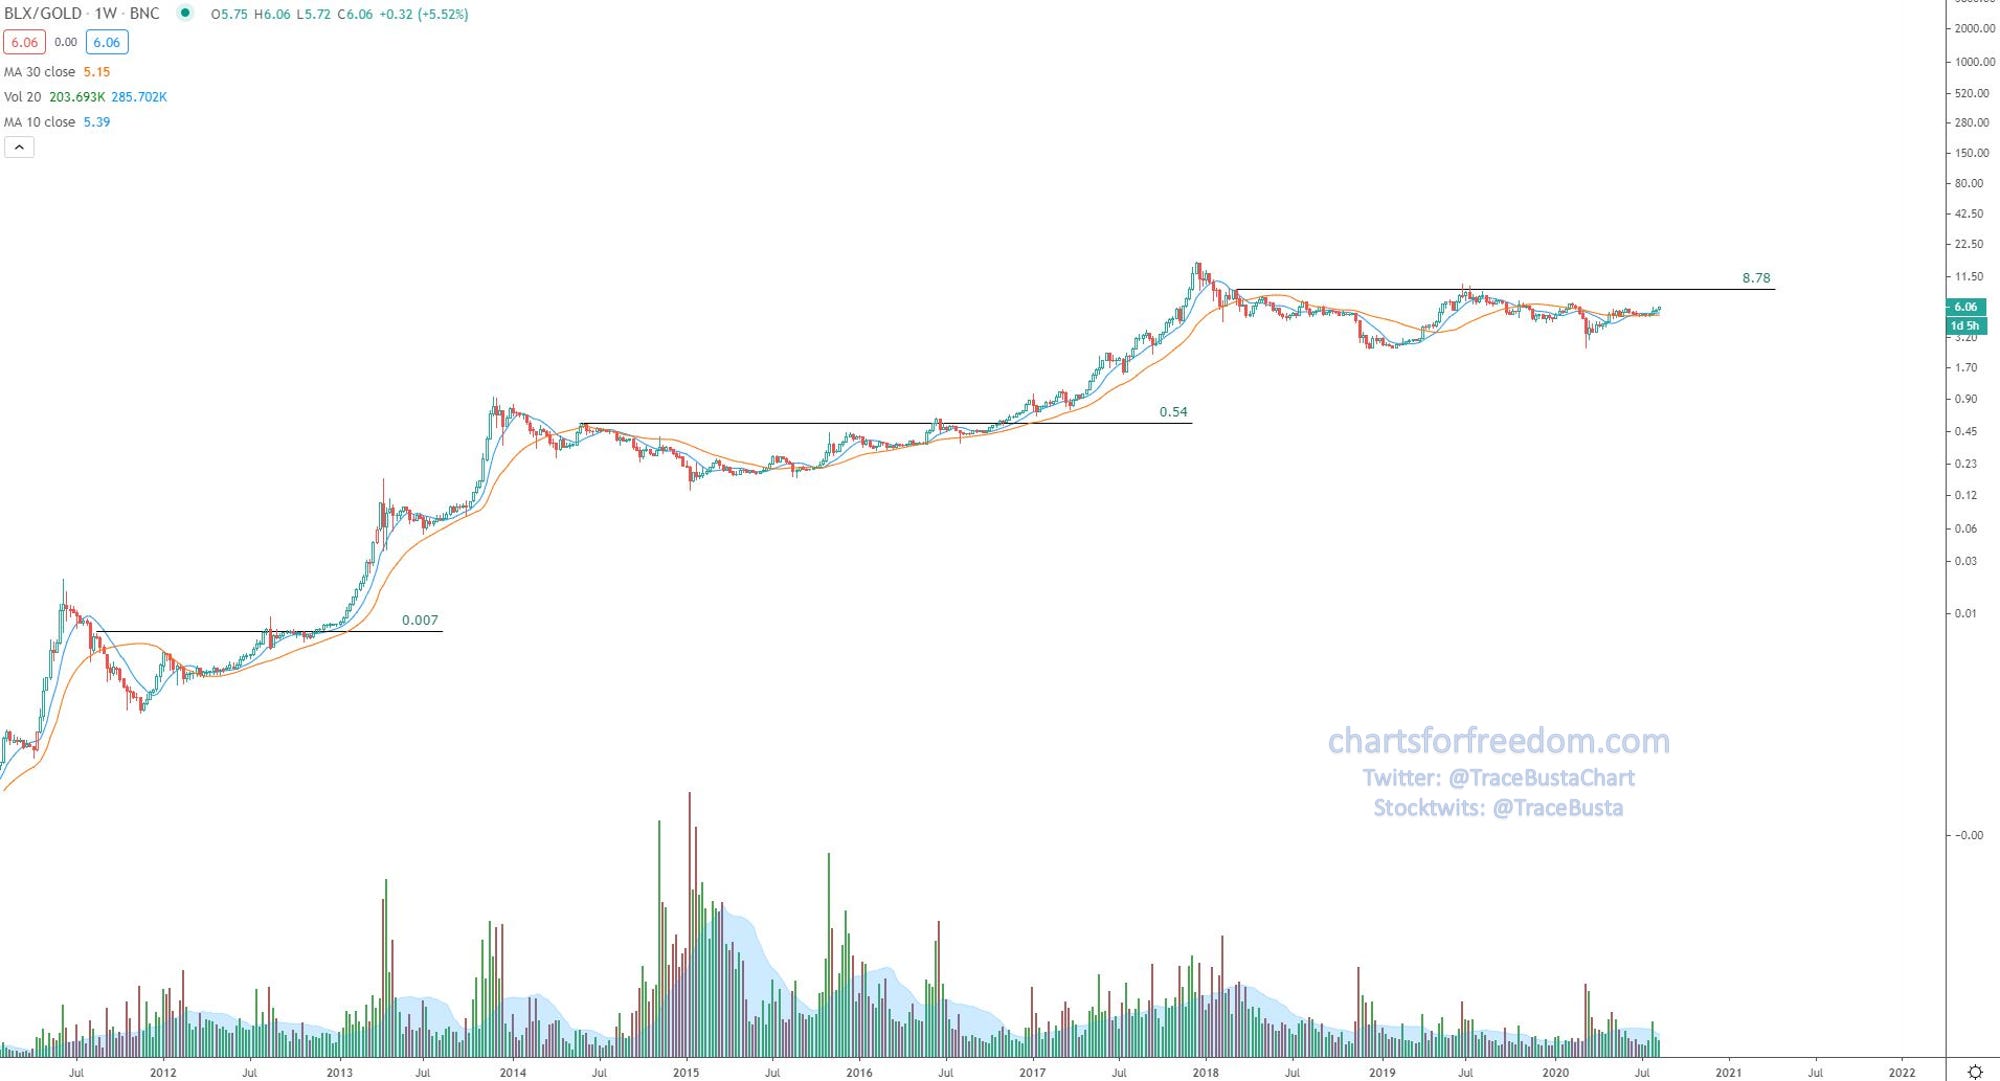
This has a bit to go before it reaches the 8.78 resistance level, but the chart below shows a different perspective (PnF) with a nice breakout signal and objective 45° bullish trend.
And here is a BTC/GOLD ratio chart, represented in PnF, showing a clear bearish trend ending, and a new bullish trend starting:
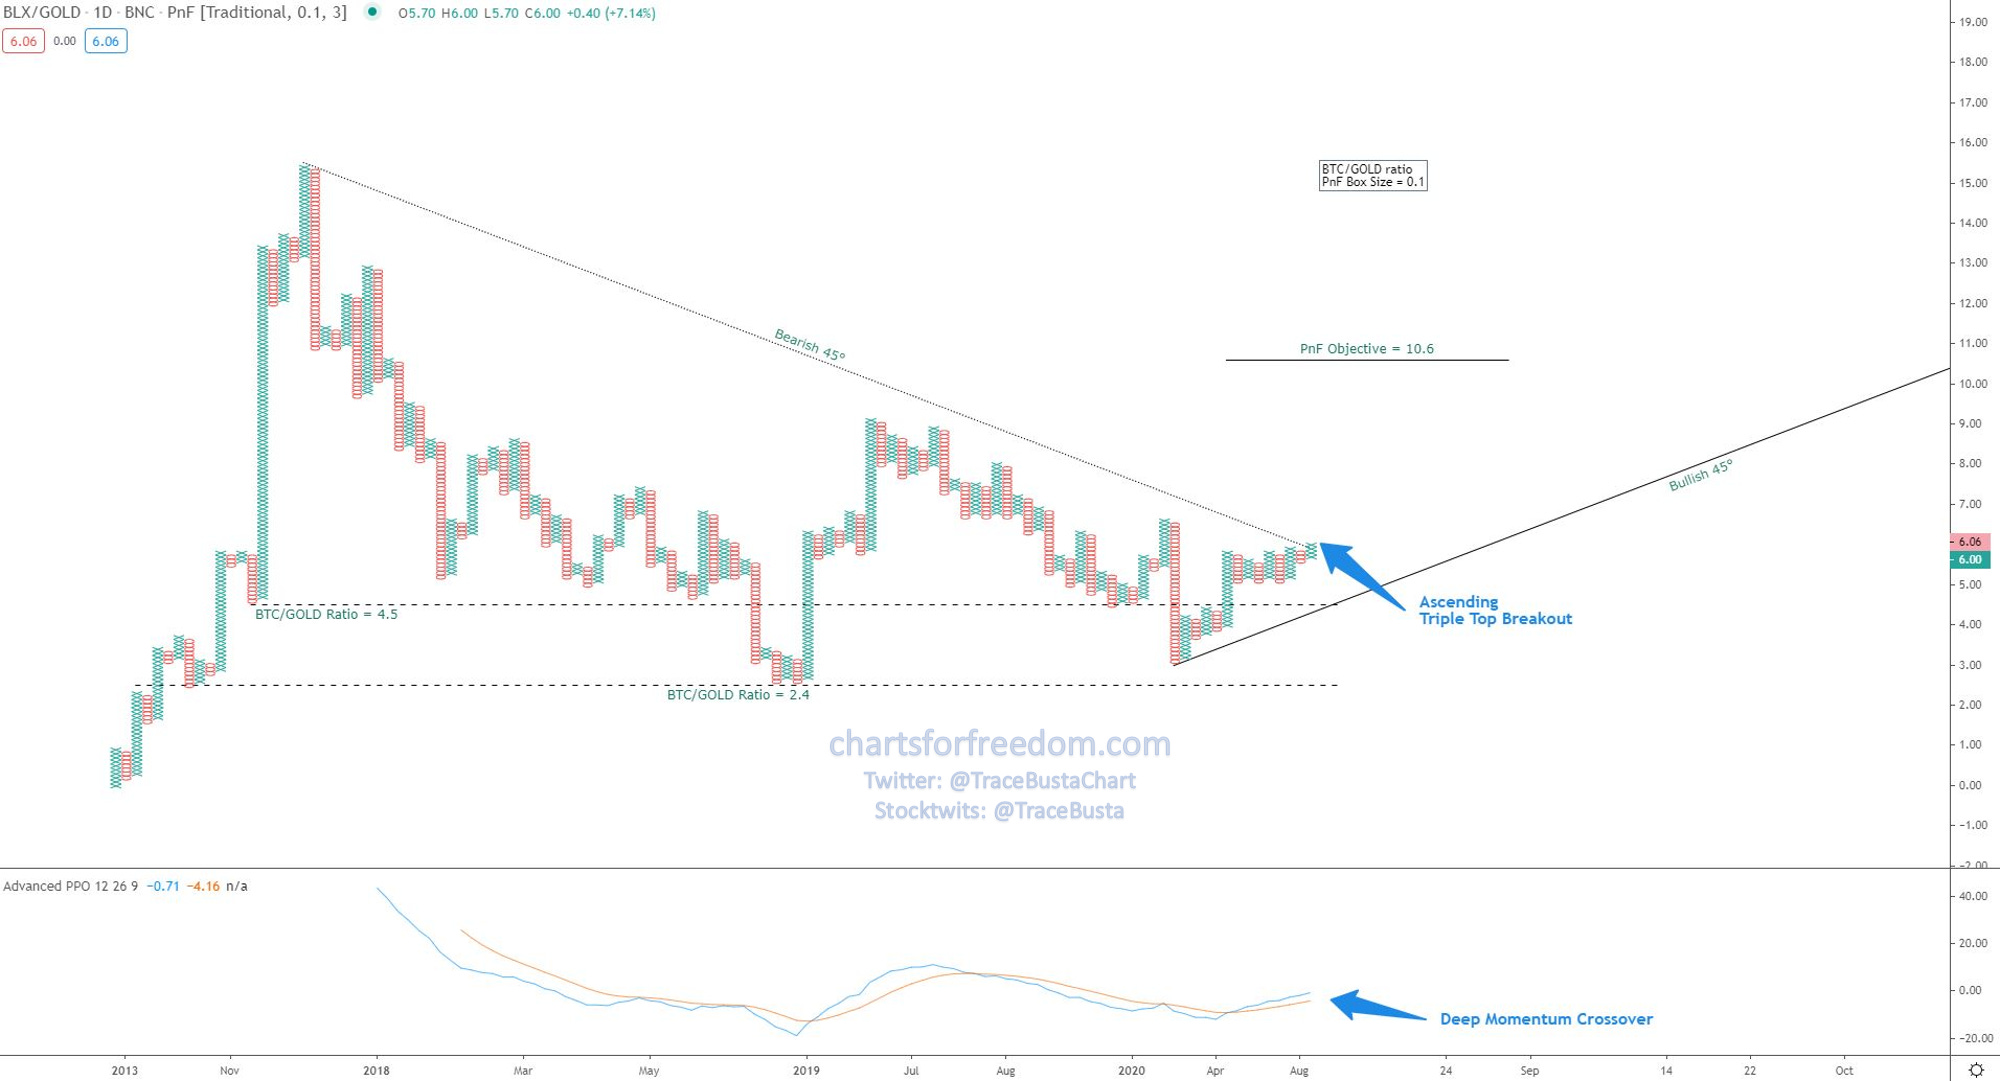
Also note the deep momentum crossover (PPO) at the bottom of the chart
So my golden criterion that must be satisfied before I enter any altcoin trade, is that it must be showing strength vs. BTC. Likewise before I enter any long in BTC, it must be showing strength vs. SPX - just like any equity would need to do. So if the above criteria are true, then any altcoin I enter should be showing relative strength vs. BTC AND SPX. Now, with that said, let’s take a look at some of the trades and their updated charts.
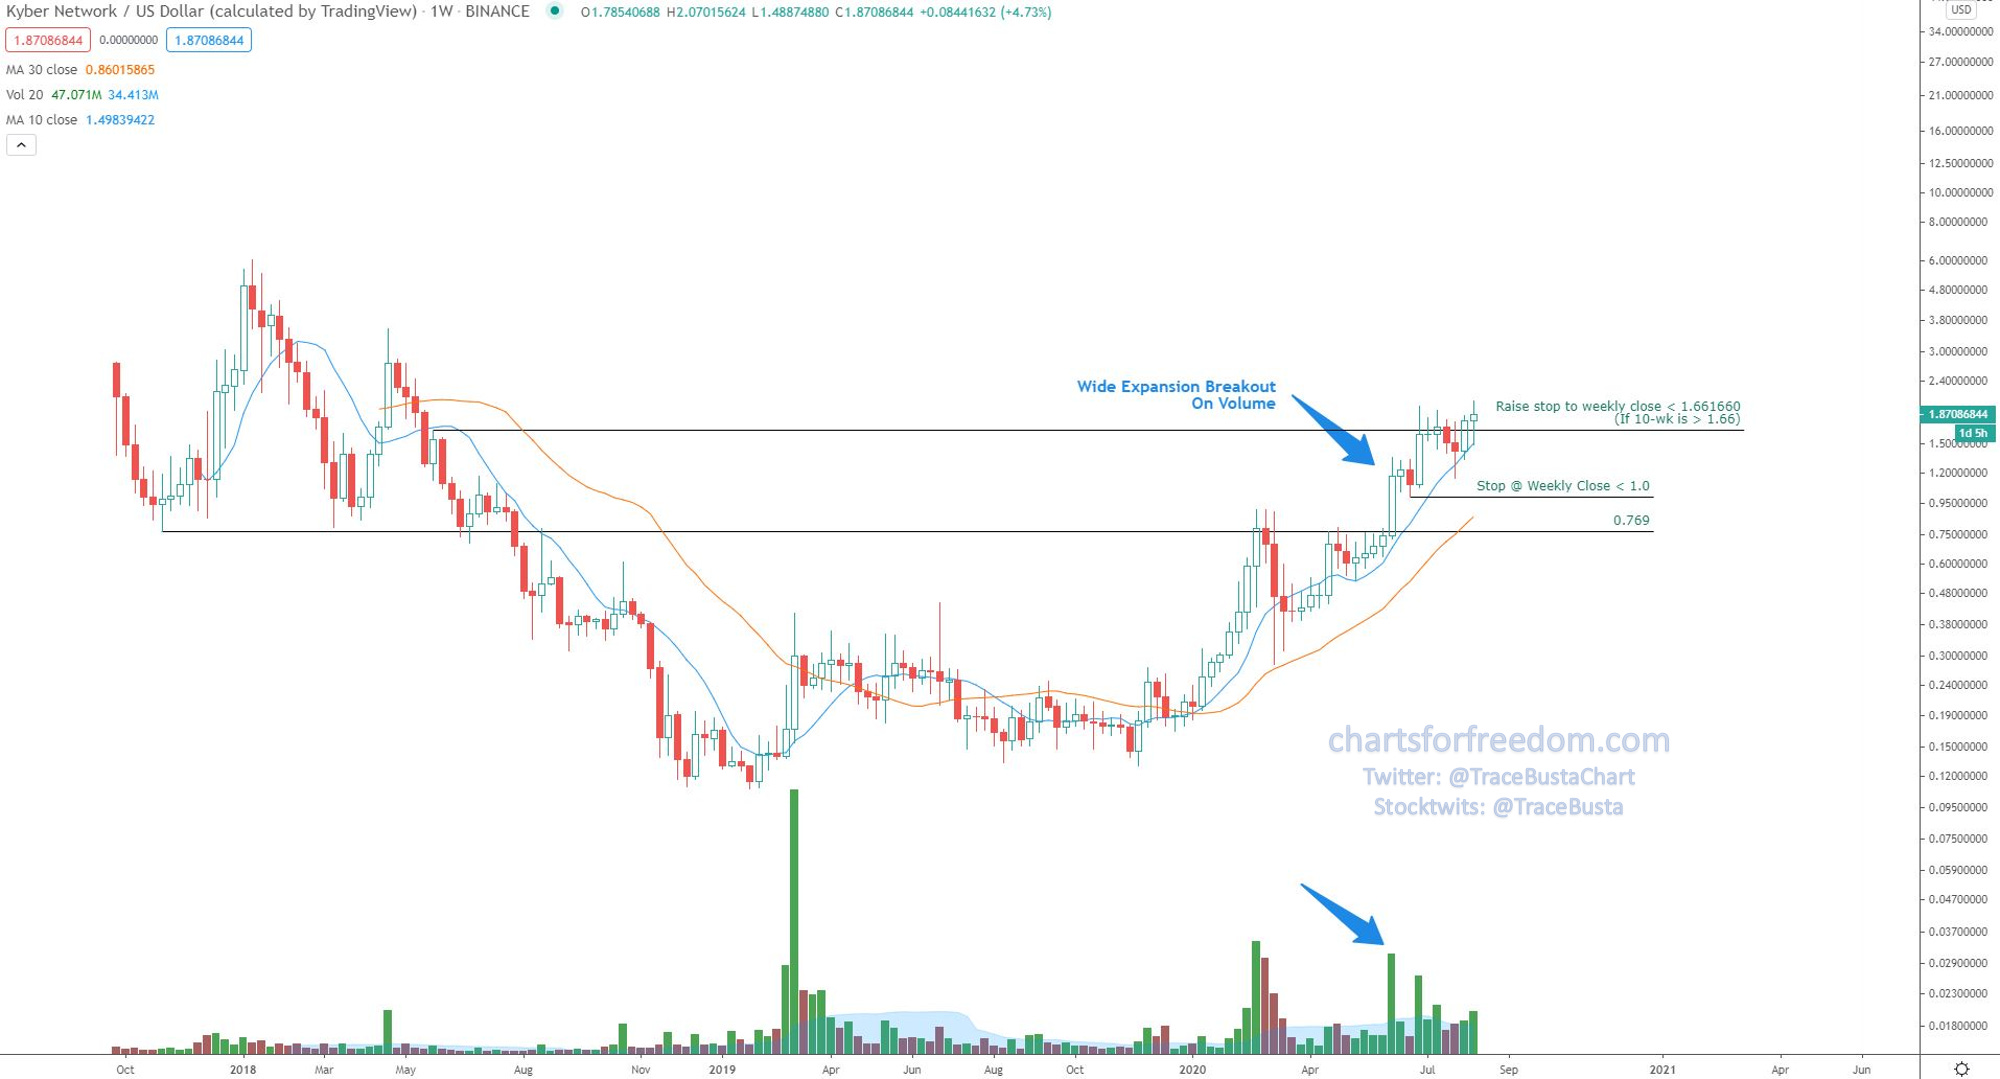
The first altcoin trade I shared here on Charts For Freedom was of Kyber Network, $KNCUSD (link here). The chart was looking great by itself, but it also looked strong vs. BTC. The position I shared is up a nice 37%. Here is an update to those charts now:
KNC/USD:
KNC/BTC:
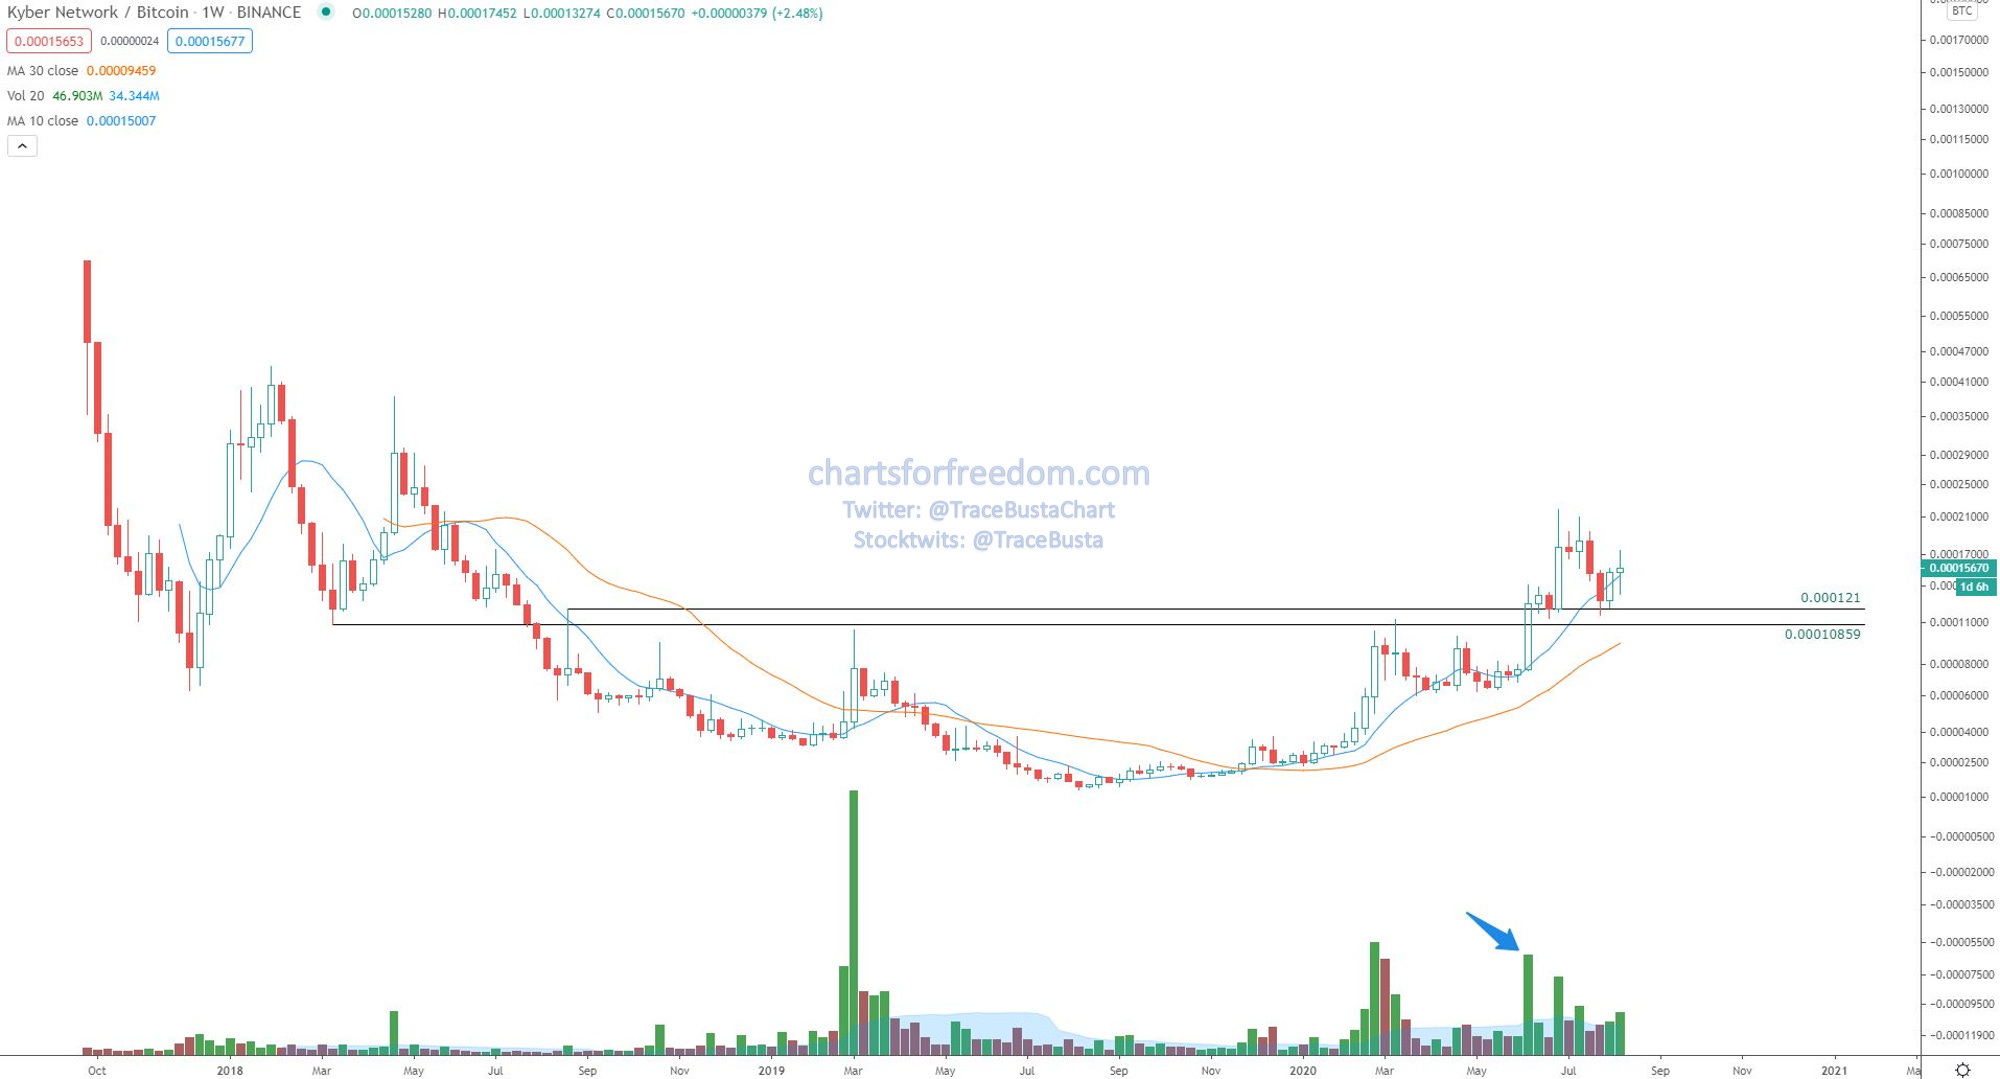
I am still long $KNCUSD, and this looks to be using a rising 10-wk MA as its support area.
My current stop is set at a weekly close < $1.0, however I will be raising this to a weekly close below $1.66 when the 10-wk crosses above it (which should be next week or week after at the current trajectory).
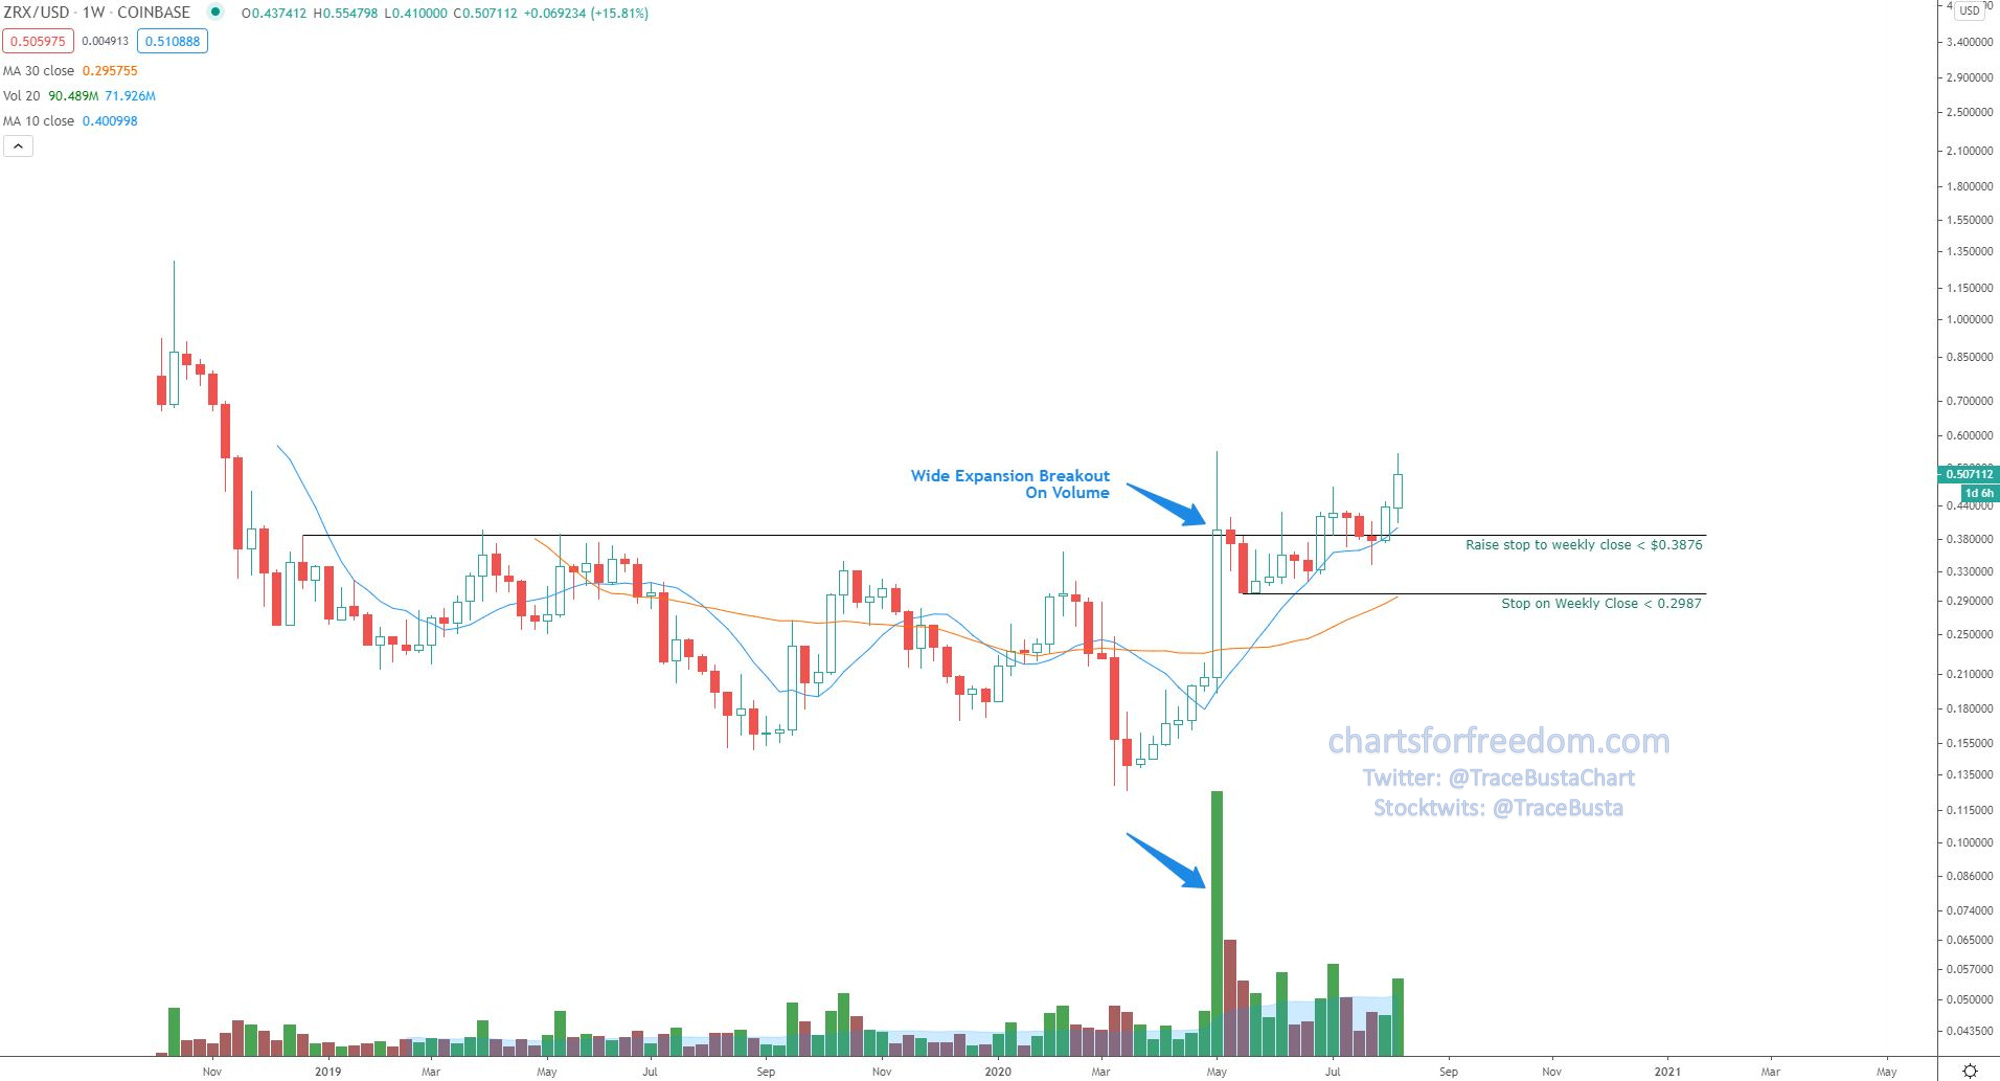
The next altcoin trade I shared here on CFF was 0x, $ZRXUSD (link here). Here are the current charts.
ZRX/USD:
ZRX/BTC:
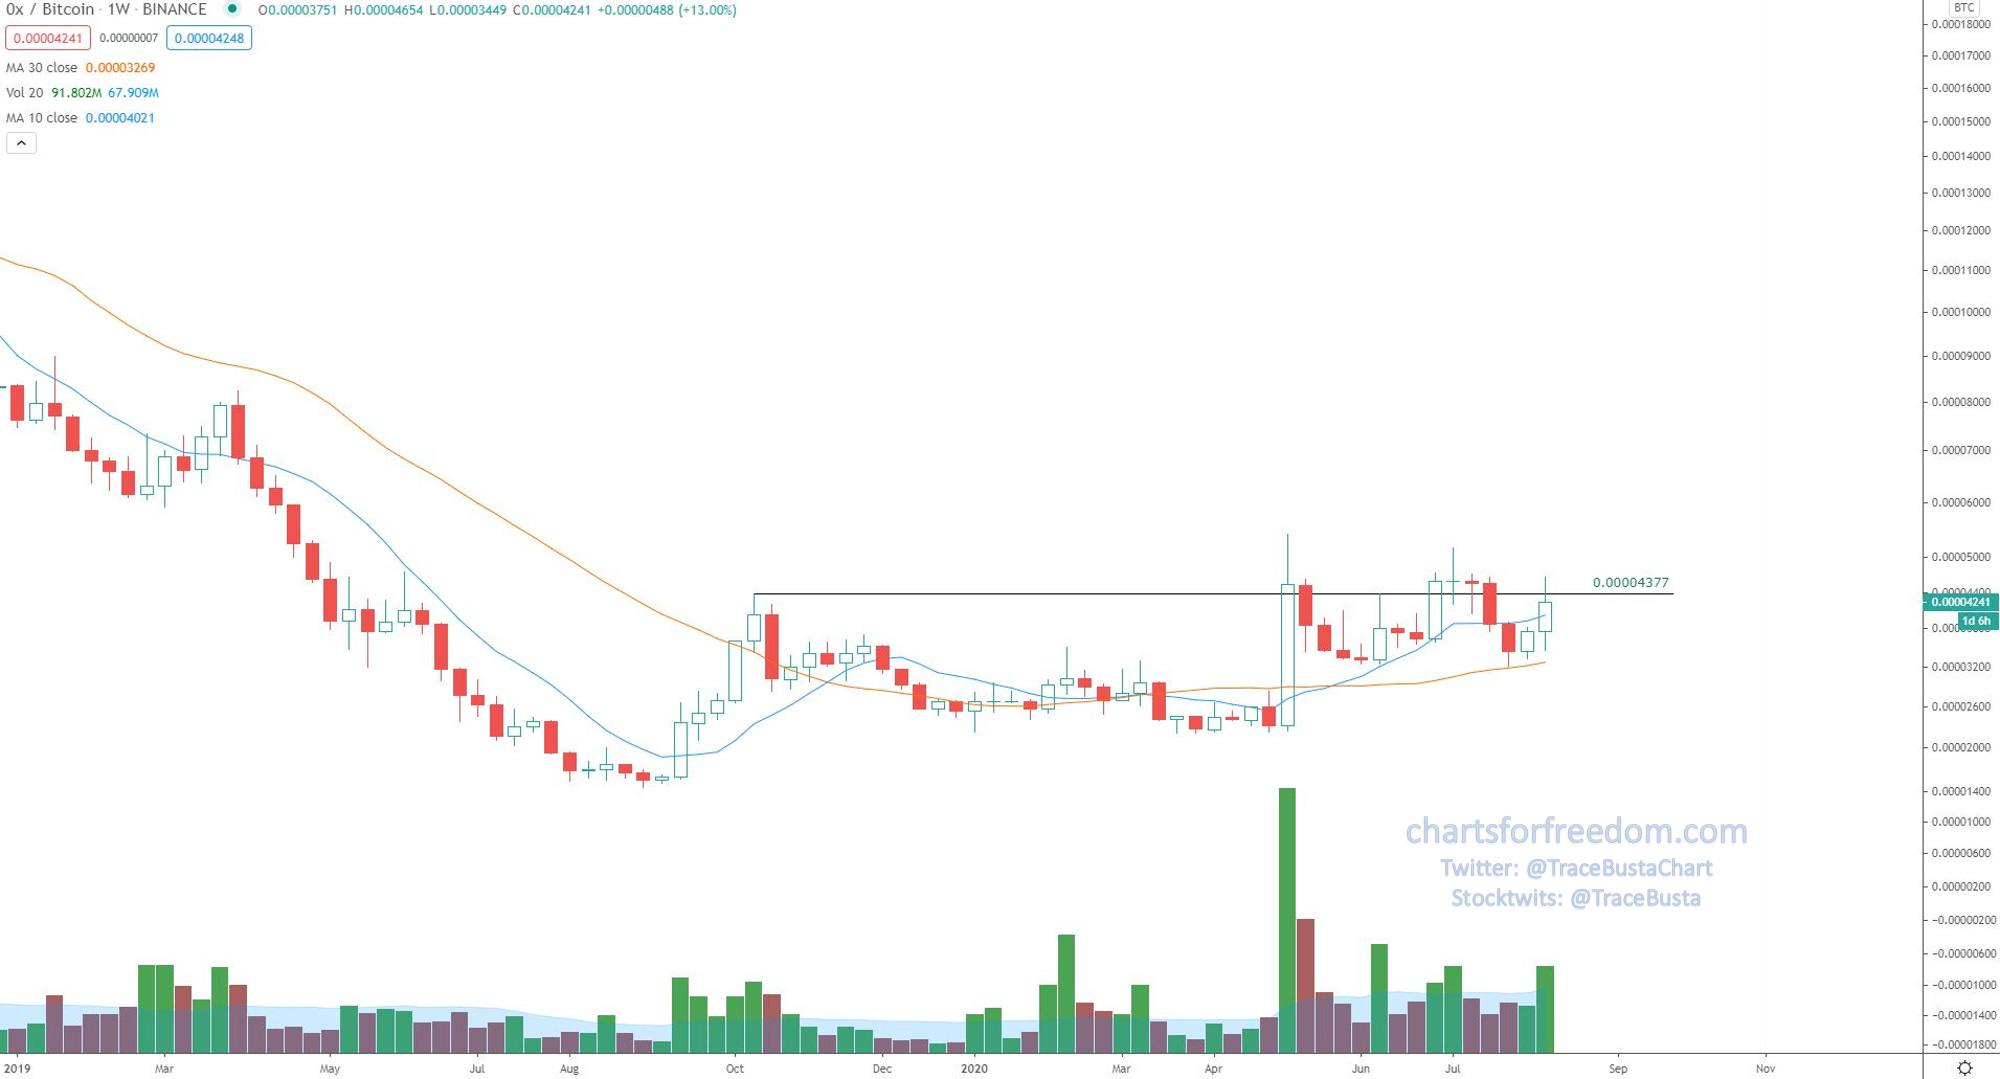
I am still long $ZRXUSD, and even though this has risen by ~ 20% since my shared entry, it has lost ground to BTC over that same period as shown in the ratio chart ZRXBTC. If I’m going to be in an altcoin longer term, it will only because it is showing strength vs. the king.
Since this is now showing a weak relative strength vs. BTC by moving below the key ZRXBTC ratio resistance level of 0.00004377, I will raise stops to $0.3876. I will remain long until I am stopped out.
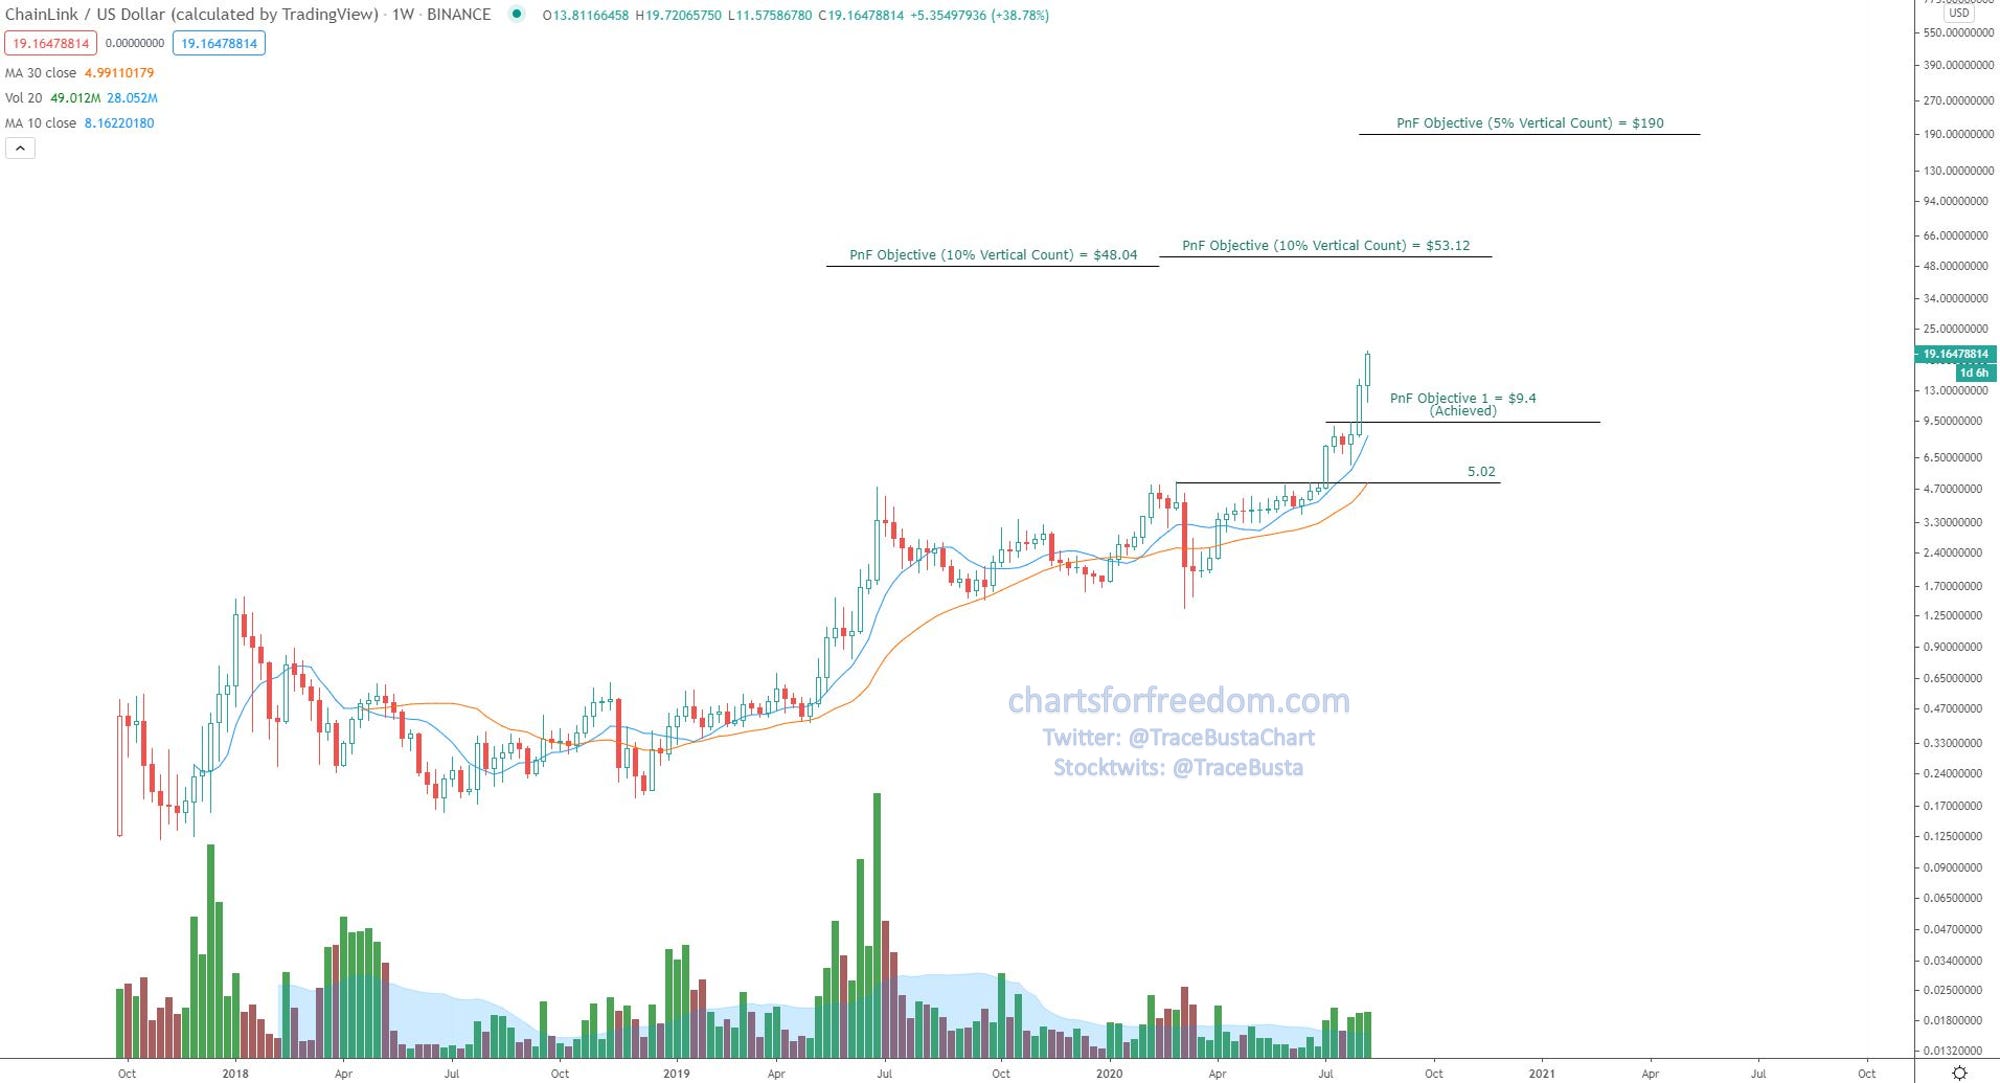
The 3rd altcoin trade I shared here on CFF was ChainLink, $LNKUSD (link here). This altcoin is HOT and is up a staggering 3.7x (+270%) in just over a month from the entry. Because of this nearly vertical rise in price, all horizontal counts that I can generate have been achieved. So I had to switch up my counts to the vertical variety, and I’ve added the vertical objectives to the cart. You can see there are some nice targets around the $50 area, and then when lowering the box size to 5% I can generate an objective of $190 (which would be an amazing 37x bagger from the entry price! Will it get there? I don’t know, but I am going to stay in this position until I am stopped out.
LINK/USD:
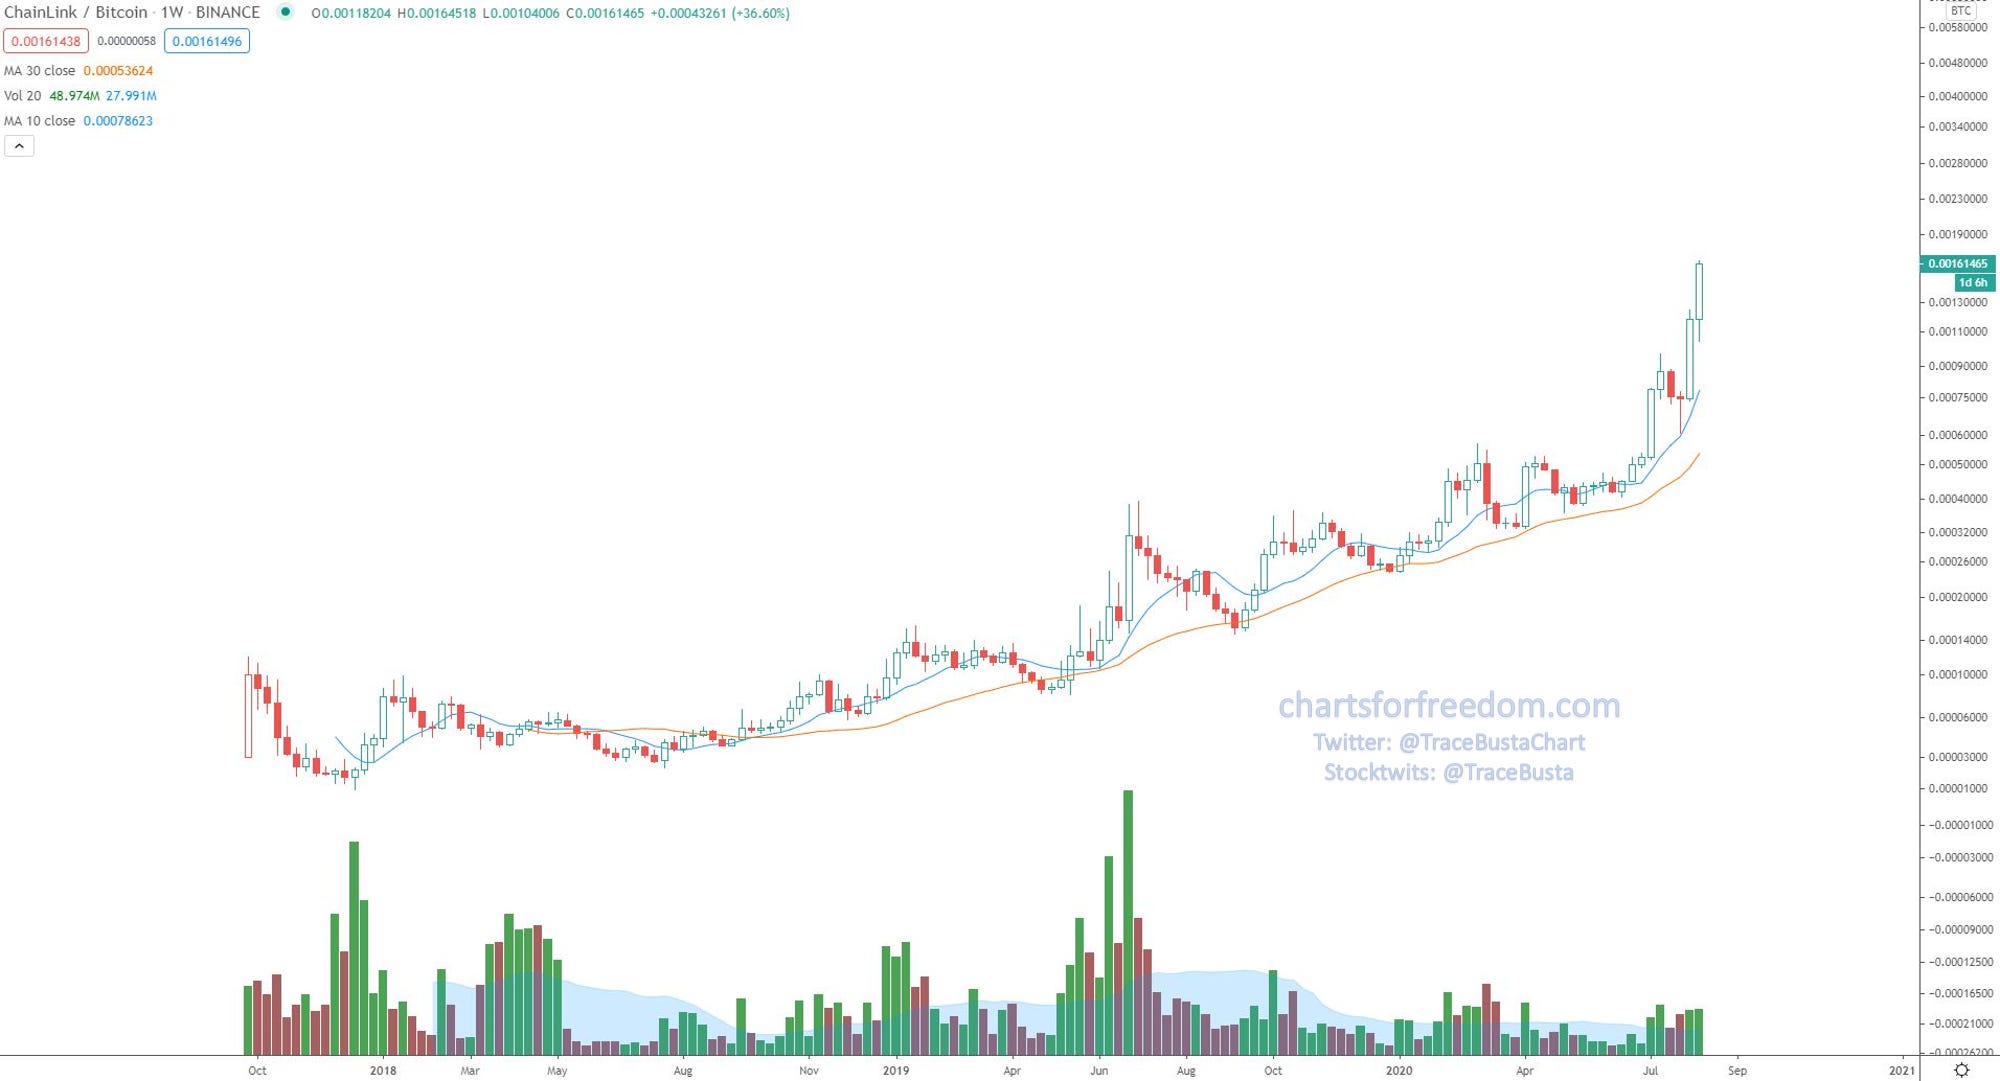
LINK/BTC:
$LINKUSD PnF Chart (10% Box Size):
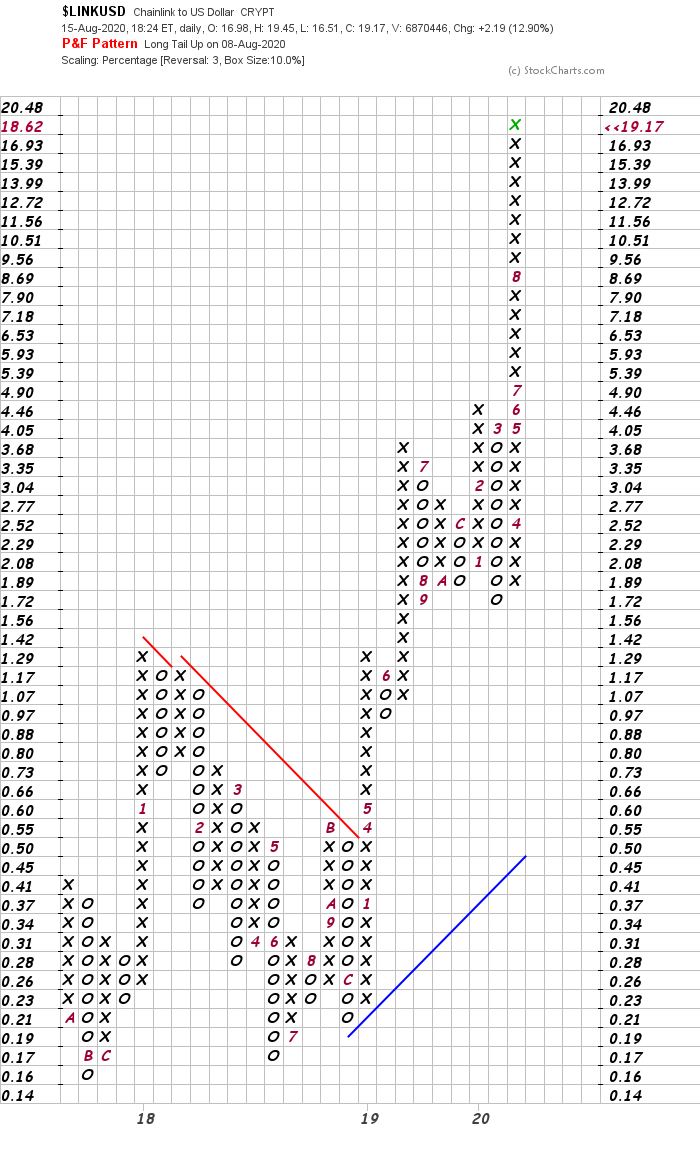
This is the 10% PnF chart that I used to generate the objectives around $50
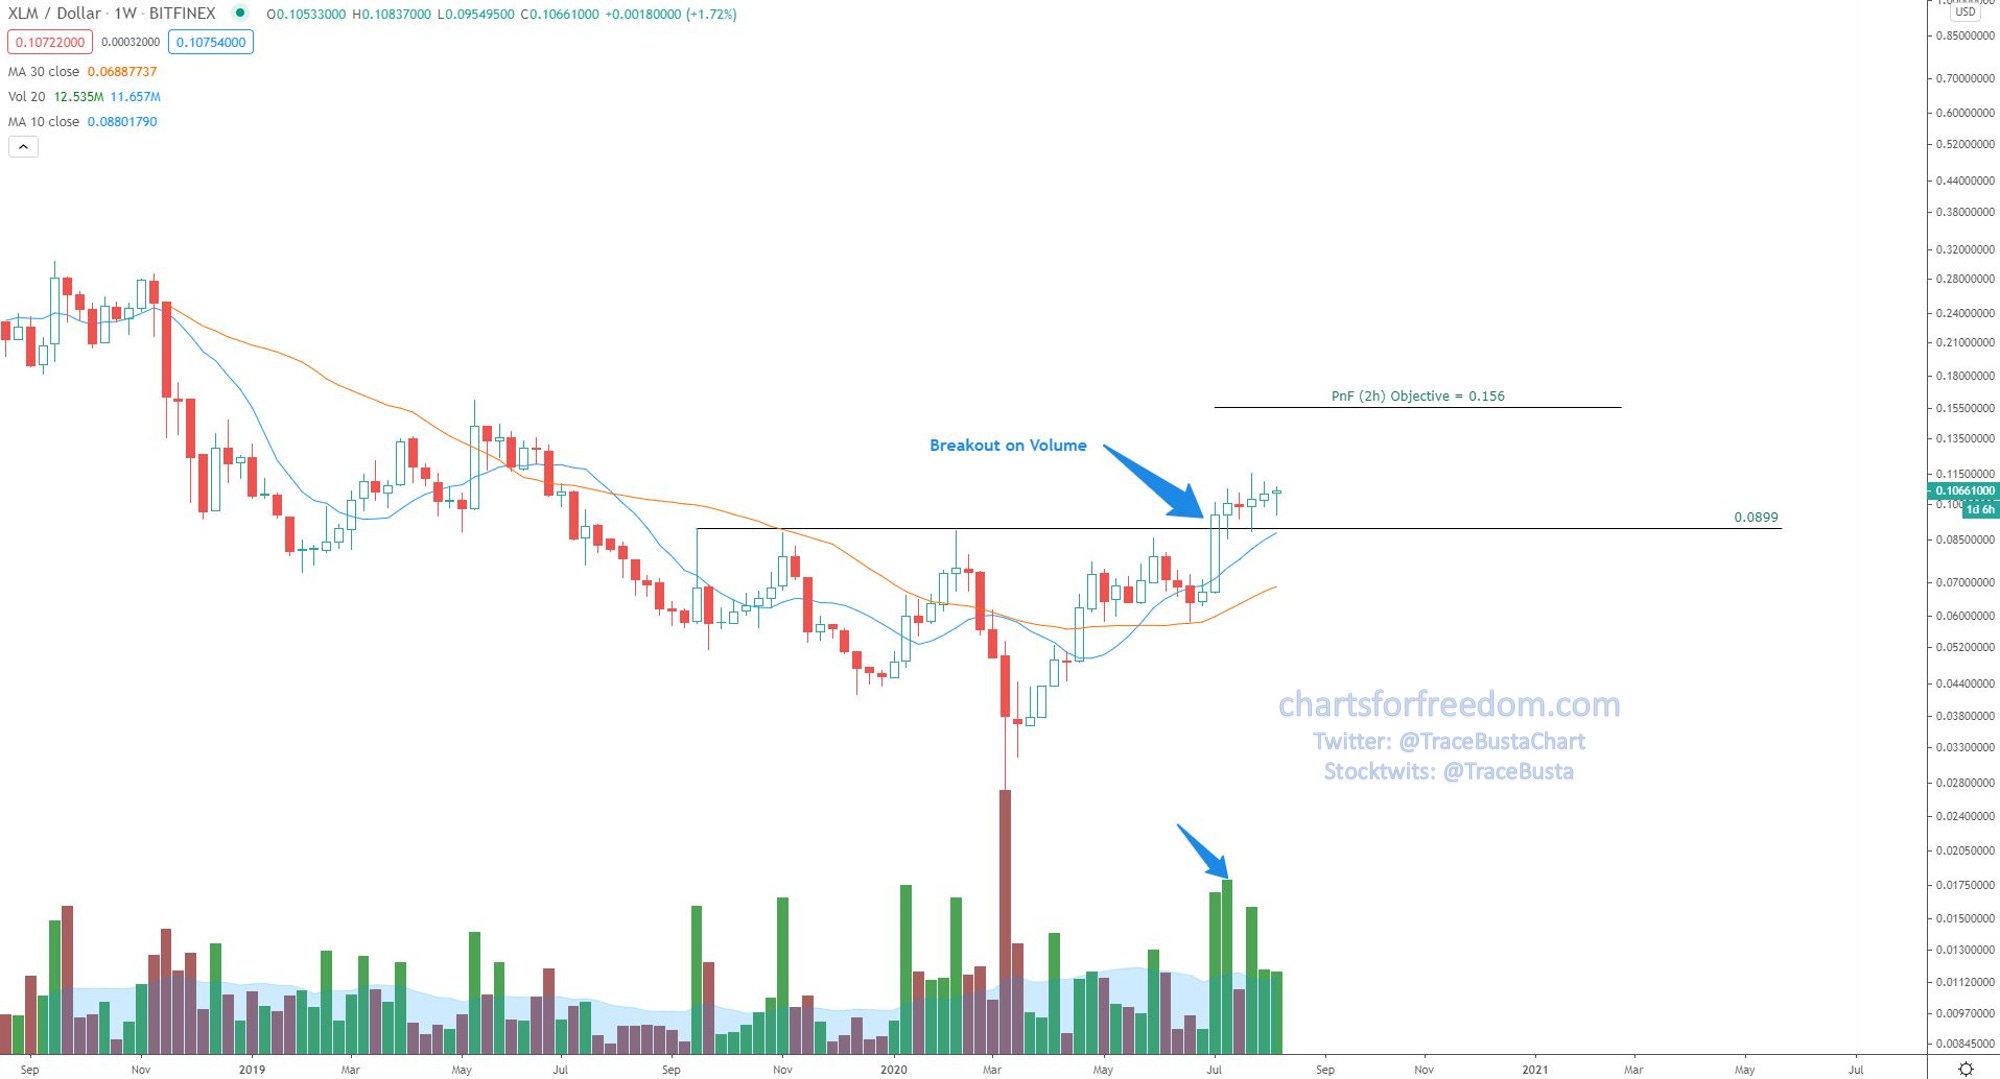
The 4th altcoin chart I shared here was Stellar $XLMUSD (link here). This position is up around 19% and like 0x, is starting to show a relative weakness vs. BTC by breaking below a key ratio level (see ratio chart below).
XLM/USD:
XLM/BTC:
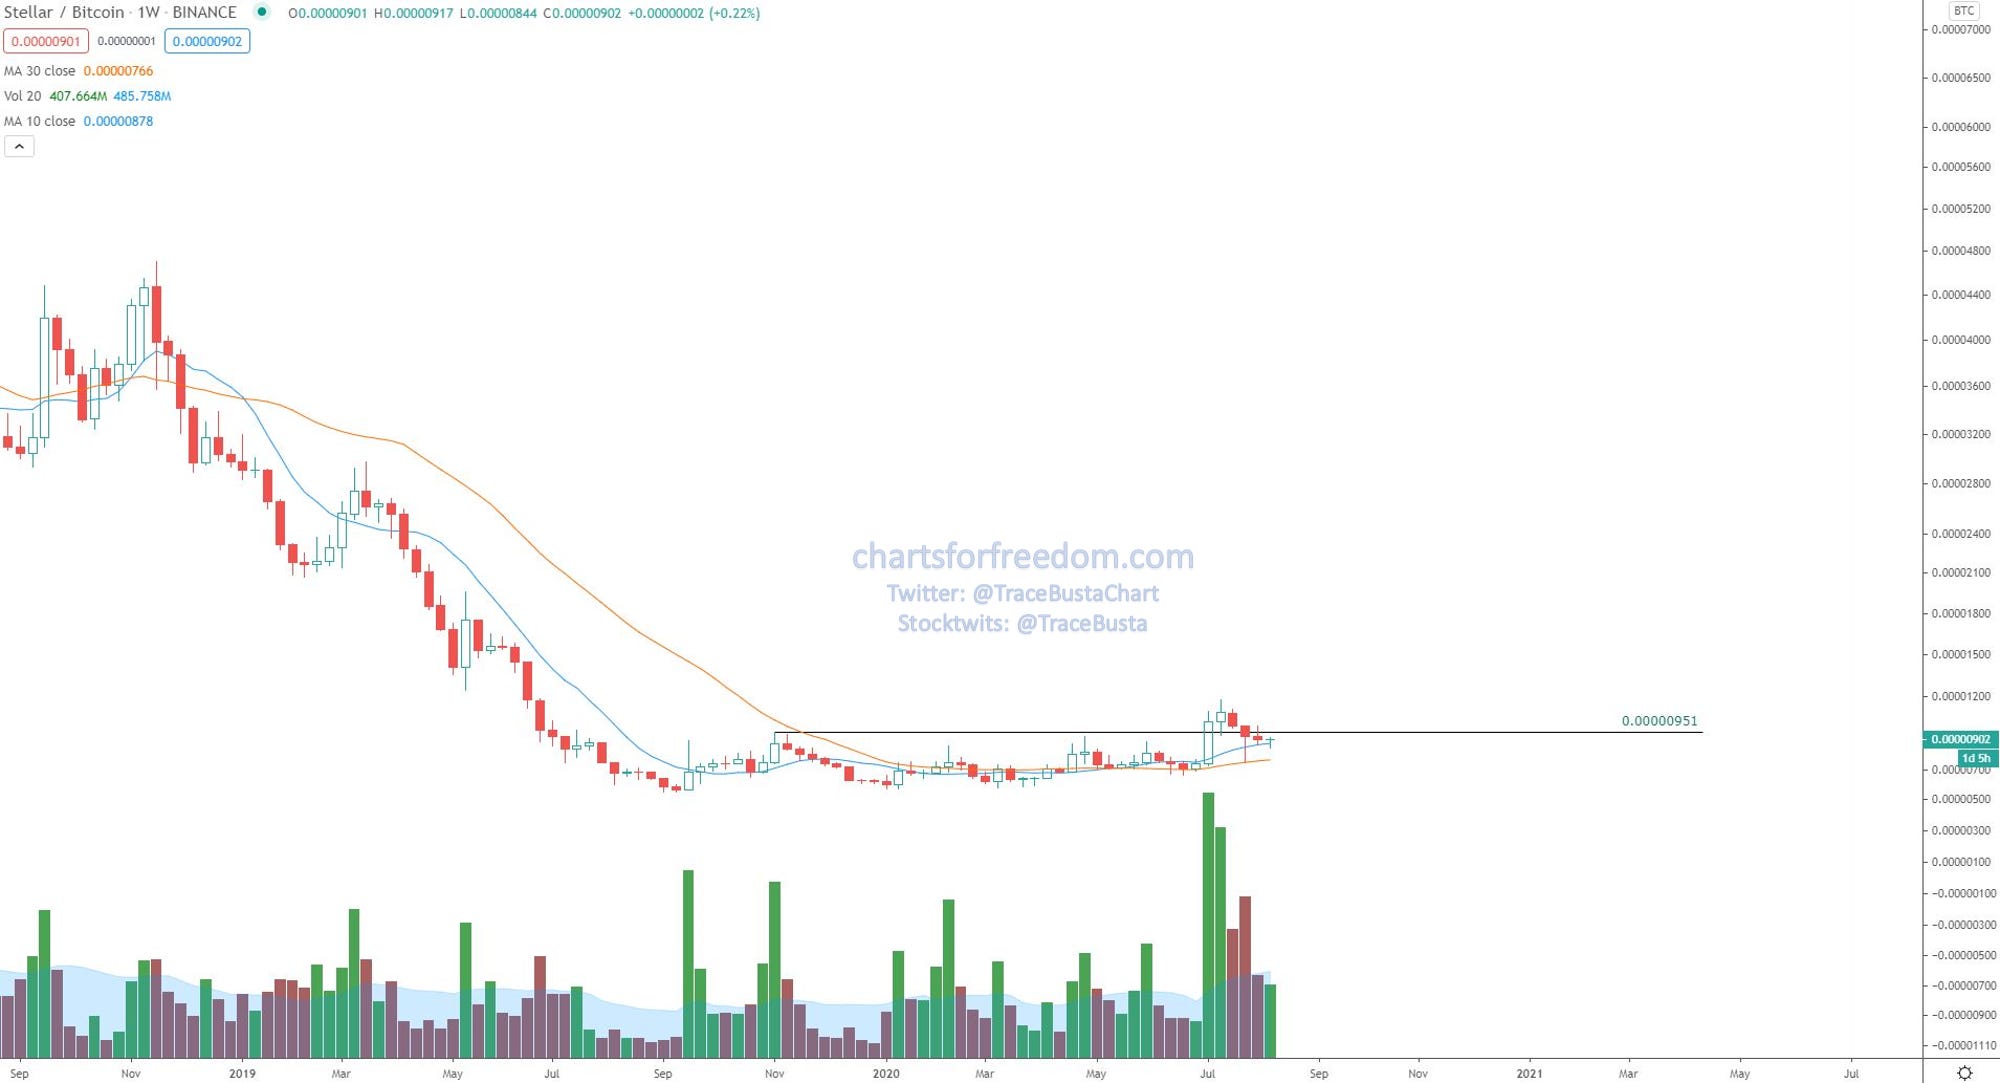
As the ratio chart shows vs. BTC, this is starting to fade against the benchmark.
I am going to use a stop (weekly closing basis) below 0.0899
Here are some other charts I am tracking and have alerts set on:
Basic Attention Token (BATUSD):
Tezos (XTZUSD):

Currently showing a breakout, will be watching weekly close Sunday night.
XRP (XRPUSD):

This one seems to be very polarizing. Lots of love or lots of hate depending on who you ask. I block out the noise with the charts. If this breaks above $0.35, and closes above that level on a weekly chart, then the tape will have spoken.
Remember to check the relative strength vs. BTC before entering!
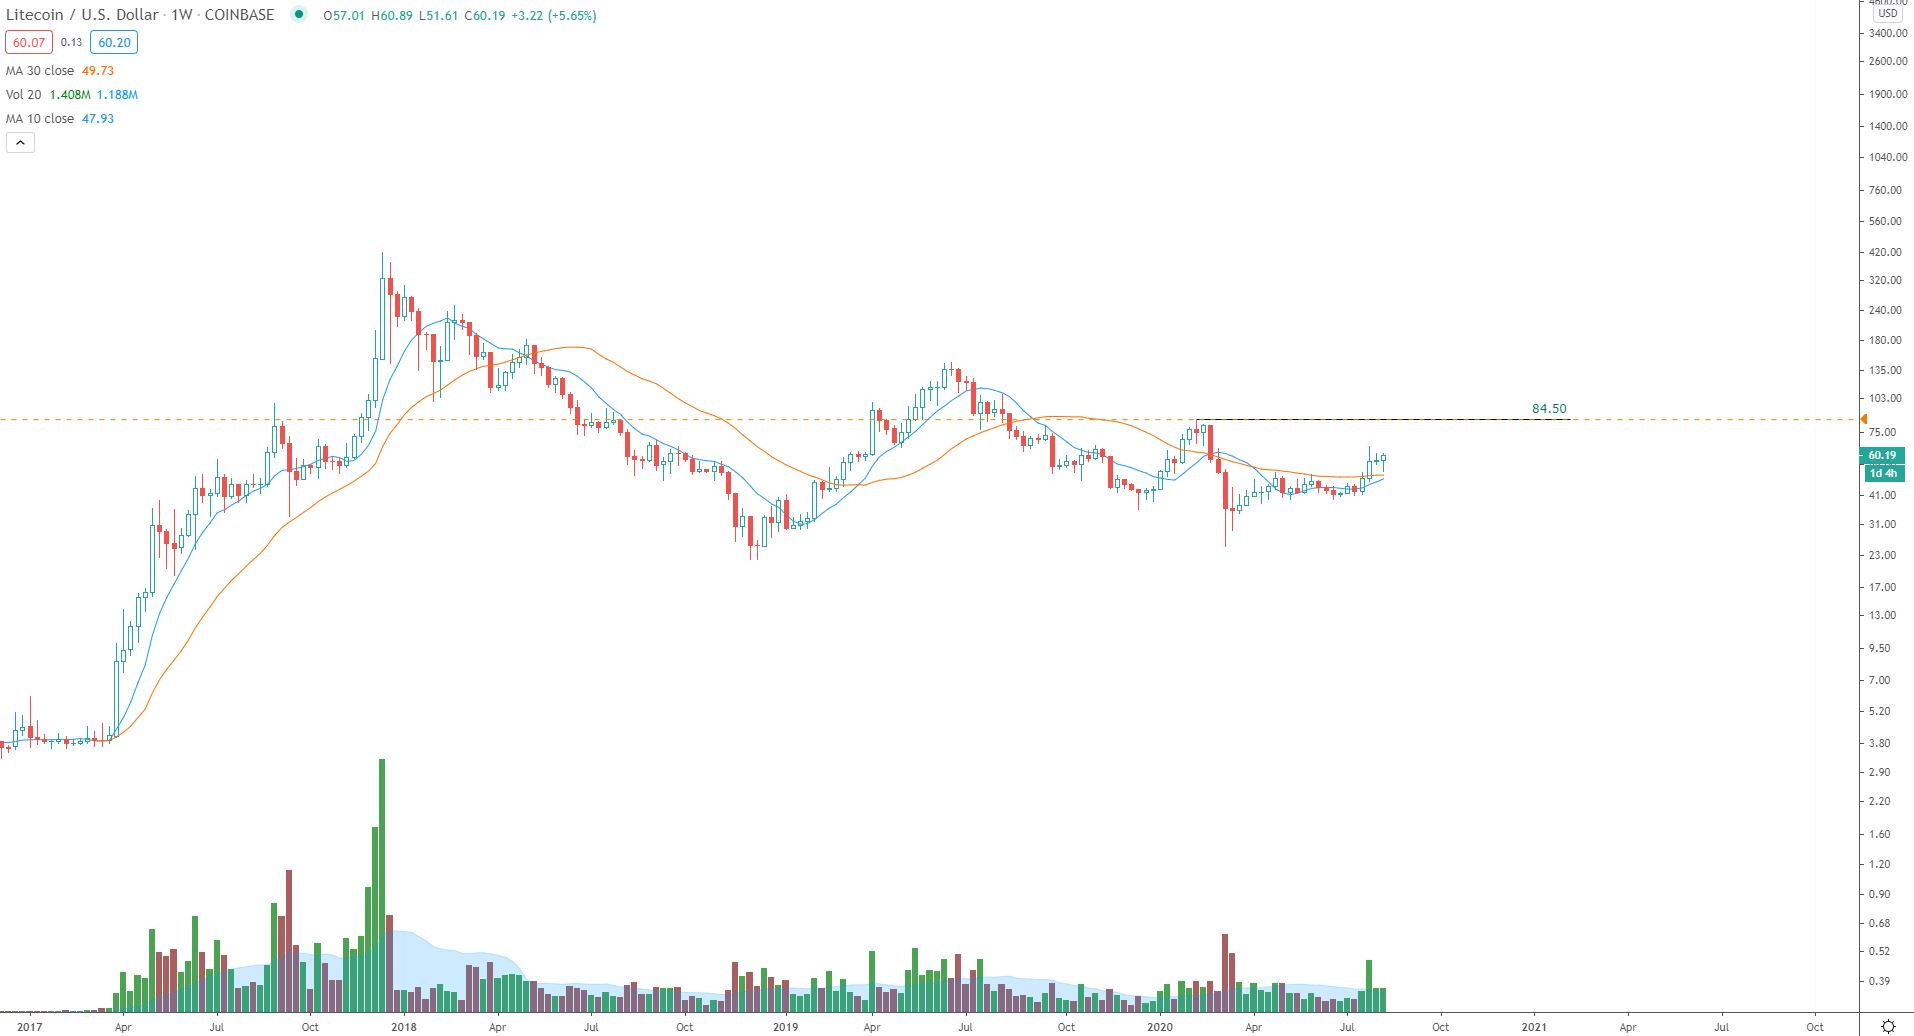
Litecoin (LTCUSD):
Zcash (ZECUSD):
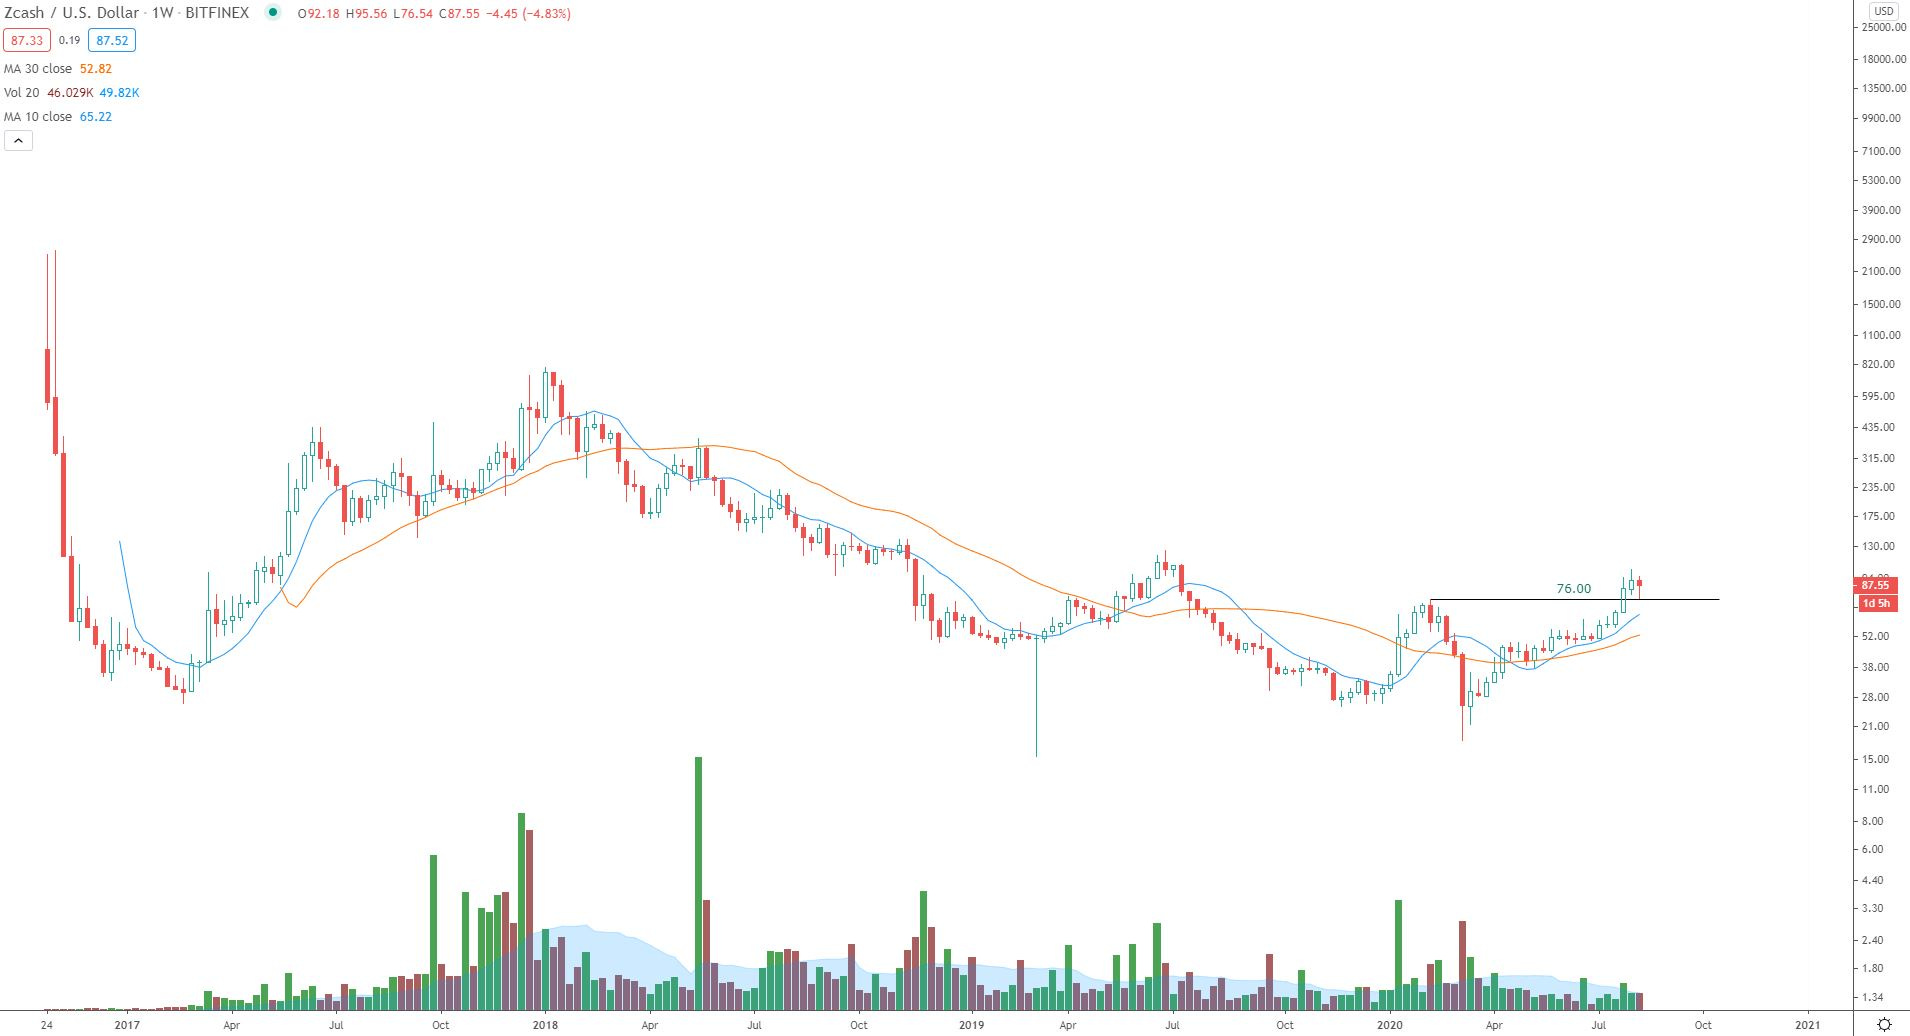
This has already shown a nice breakout above a key resistance level, but hasn’t shown much volume on said breakout and the relative strength vs. BTC didn’t have any follow through.
Maker (MKRUSD):

Many attempts at that $800 level. When this finally closes above (weekly basis) this could explode higher.
Volume and relative strength on breakout will be key!
If you found this update helpful, consider upgrading to a premium member plan that will give access to any trades I take for the CFF portfolio in real-time as well as regular updates on the markets. The Charts For Freedom Portfolio is long Bitcoin and Ethereum. For more, see here.