

Dear Subscribers,
I'm writing to share that this will be my concluding Options update in the current paid subscription format. It's been a remarkable journey, and I'm deeply thankful for your engagement and support throughout this venture. As we part ways in this format, I extend my heartfelt wishes for your prosperity and success in the financial markets.
Looking ahead, I am stepping back to cherish and dedicate time to my family during these precious growing years. The decision to step back is not made lightly, but with a deep sense of fulfillment for what we've accomplished here.
May you and your loved ones find continued success and fulfillment.
Warm regards,
Trace

As we welcome a new year, it's time to reflect on the third year of options trading with Charts For Freedom. In this post, I'll delve into key statistics, insights, and lessons from 2023. Much like the summaries of the past two years, which are linked below, the insights gleaned this year may offer valuable perspectives for 2024 and beyond. Please find the details below.


Big Takeaways
The overall performance of my 2023 trades was positive. I want to highlight some key observations for future reference and as a retrospective of the year.
Takeaway 1: Consistency in Top Performing Names
Since beginning my options trading journey in September 2020, I've closely monitored the performance of various stocks. In this analysis, SPY has shown noteworthy results. Over this period, I've executed 11 options trades on SPY. These trades have achieved an average return of +63.7%. It's important to note that this figure is specific to my trading approach and circumstances.
The win/loss record for these SPY trades stands at 10 wins and one loss. This outcome reflects the potential benefits of a carefully considered and executed strategy in the options market. However, as with any trading strategy, it's crucial to understand that past performance is not indicative of future results, and options trading inherently involves risks.
This experience with SPY trades underscores the value of thorough analysis and strategy in options trading, contributing to my ongoing learning and adaptation in the market.
Takeaway 2: Importance of Plan Consistency
A key observation this year involved the impact of adhering strictly to the SPX500 tracker rules. Notably, some trades were more about learning than achieving optimal outcomes.
For instance, at the start of the year, my strategy was to leverage the SPX500 Point and Figure (PnF) chart for guiding entries and exits in SPY trades. While my entry points were in line with this strategy, the execution of exits offered a learning opportunity.
During the trades initiated in March and April, I followed the PnF chart for entry points. However, the exits deviated from the pre-defined plan. The original exit strategy was to act upon the first double bottom breakdown signal following entry. This approach, based on the SPX500's Point and Figure chart dynamics, would have led to an exit around the $4,530 level at the time of the signal. Instead, I chose exits based on a weekly close below the 10-week SMA, leading to exits around the SPY $437 mark. These trades resulted in gains of +85% and +21%.
This experience underscored the importance of adhering to a predetermined exit strategy. It served as a valuable reminder that while flexible decision-making can be beneficial, there is also merit in maintaining consistency with the established plan, particularly regarding exit points.
Takeaway 3: The Efficacy of Diverse Trading Strategies
Overtrading has been a recurrent theme in my journey, leading me to explore various strategies. Reflecting on past discussions about limiting trades to a few times a year, I've realized the merit in different approaches. My preference for a breakout entry strategy has coexisted with others' success in contrasting methodologies.
Moving forward, I plan to delve deeper into the trade frequency within my breakout system, particularly focusing on the SPX500 tracker. This system, with its high success rate but lower trade frequency, offers a balance between capturing significant gains and maintaining consistency. It serves as a reminder that there's no one-size-fits-all in trading; different styles can work under different market conditions. For example, while breakout trades can yield substantial returns in favorable markets, a more selective approach, like the SPX500 tracker, can provide stability during volatile periods.
This diversified approach aims for a balanced and efficient trading practice, acknowledging that multiple styles can be effective, each with its own set of strengths and suitable market conditions.
Takeaway 4a: Recognizing the Impact of Seasonality
A significant insight from this year's trading is the discernible effect of seasonality. The calls that performed exceptionally well were those in alignment with favorable bullish seasonal trends, while the most substantial losses occurred during periods typically bearish in nature.
In the statistics section that follows, I will provide a detailed analysis of certain periods where bullish calls underperformed. For a clearer understanding of these instances, refer to the SPX seasonality chart included below:

Takeaway 4b: Understanding Theta: The Role of Time Decay in Options
An essential aspect of options trading is the concept of time decay, represented by the Greek symbol Theta. It's crucial to remember that options are time-sensitive instruments. This means that even in a market trending upwards, gains from call options aren't guaranteed. For a call option to remain profitable, the underlying asset must appreciate at a rate sufficient to outpace the loss in time value.
This was particularly evident during the volatile periods of May and July-October. Despite having some promising gains initially, the market volatility impacted the outcomes. Understanding and managing the risks associated with time decay is a fundamental part of options trading.
Statistics
2023 Trading Statistics Overview
As 2023 draws to a close, let's take a look at the year's trading performance. This analysis covers a total of 30 trades, including those carried over from 2022 and ongoing ones.
Key Statistics:
Winning Trades: 12 out of 30, with an average gain of +141.8%.
Losing Trades: 18, averaging a loss of -55.0%.
Overall Performance: These trades resulted in an average return of +23.7%.
Additional Insights:
Average Holding Period: 119 days.
Annualized Return: 88.8%.
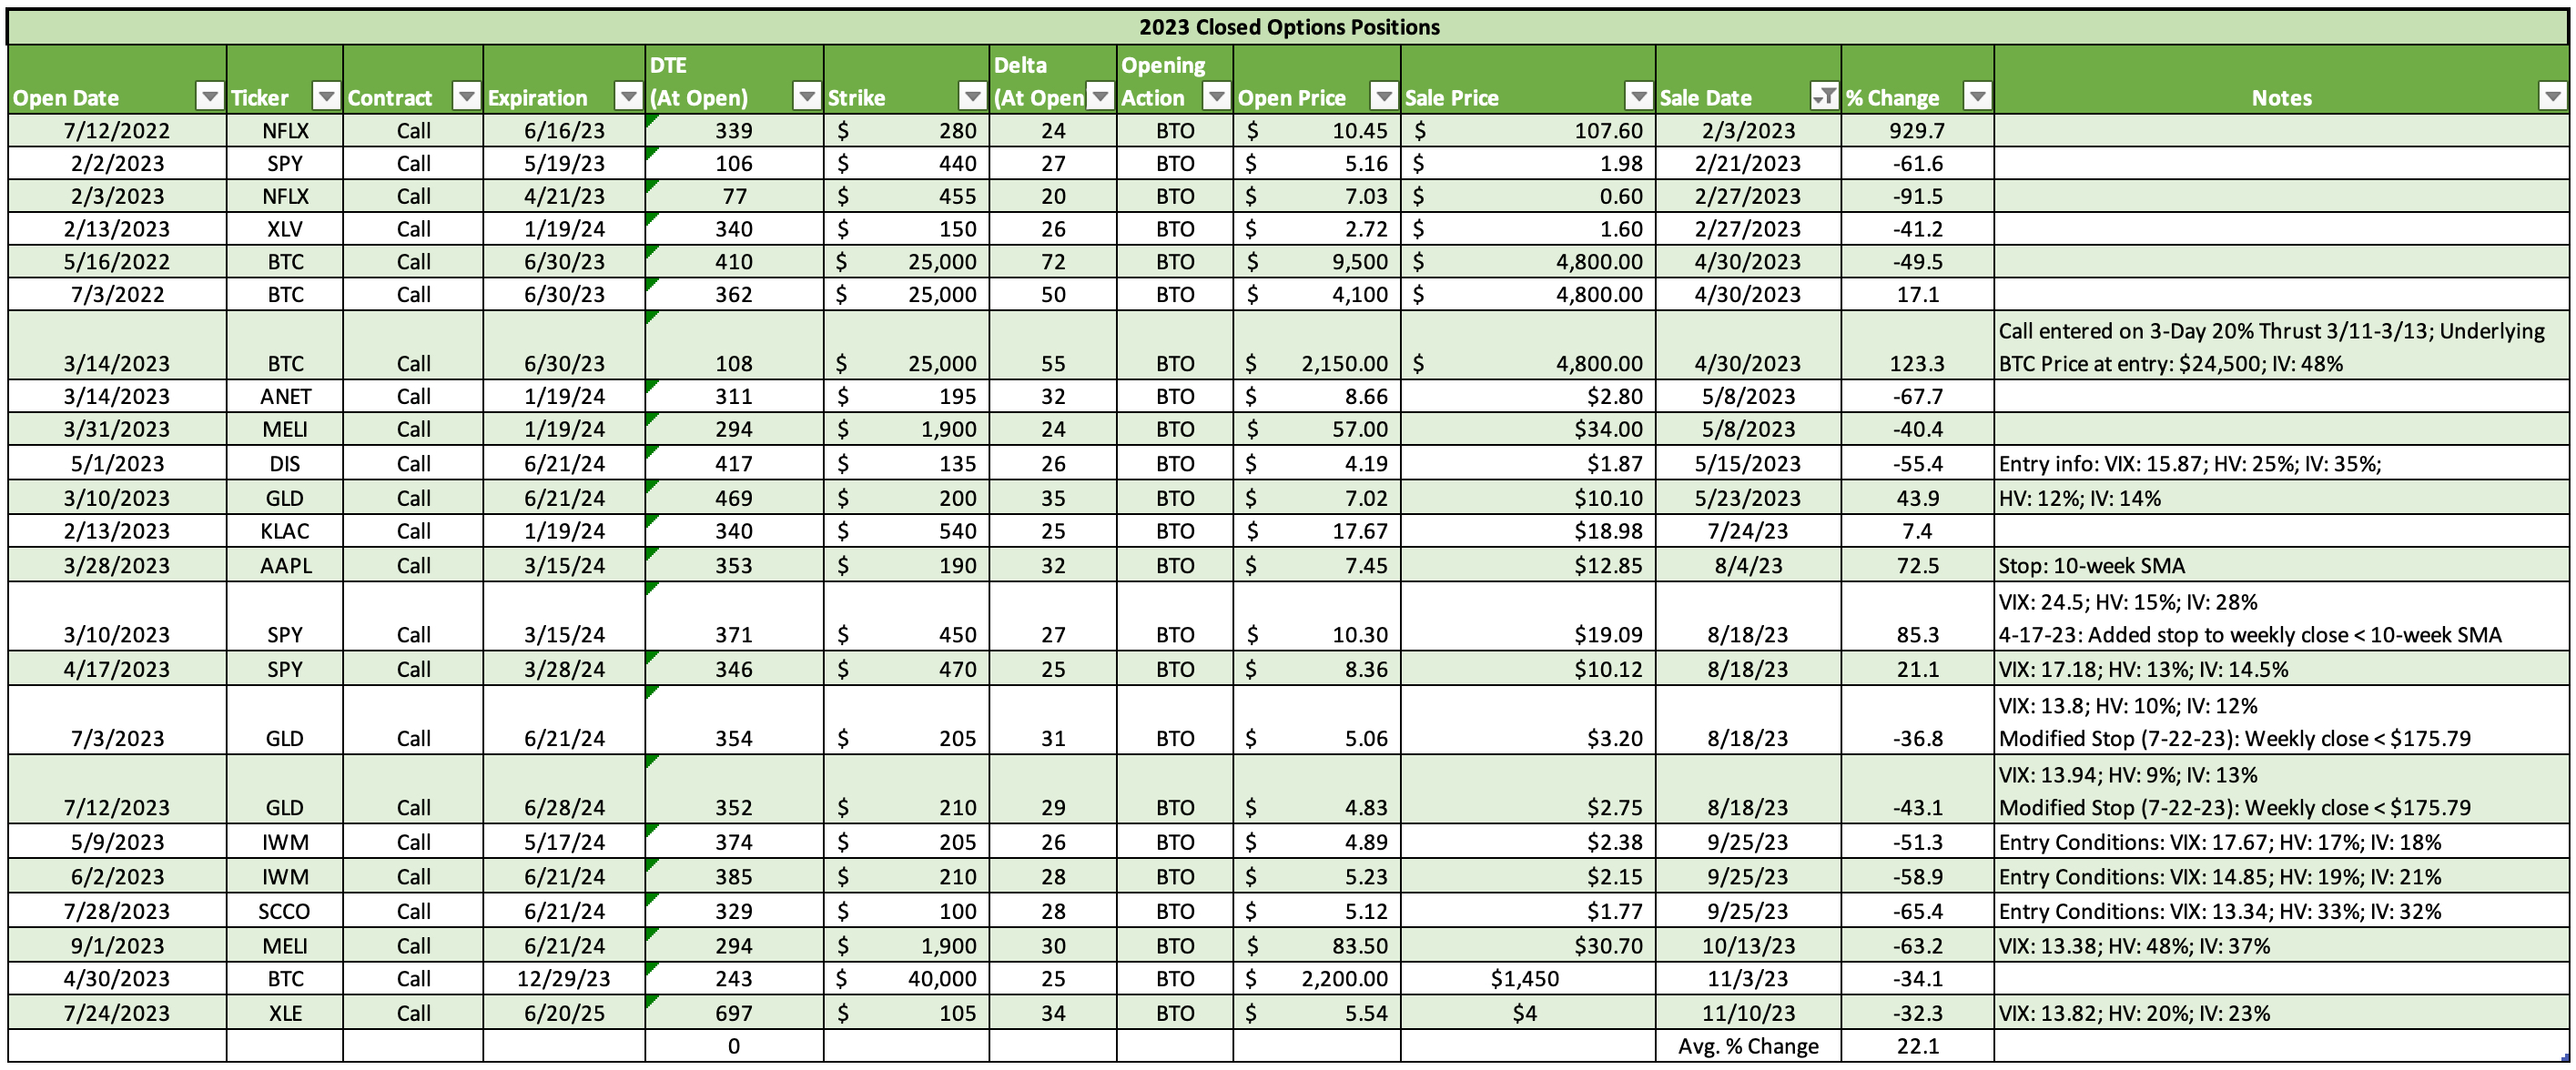
Reflecting on 2023, it was a year marked by notable successes and learning experiences. Significant gains were achieved in trades such as NFLX (+929%), SPY (+155%), BTC (+128% and +123%), and QQQ (+117%), contributing positively to the year's performance. However, we must also recognize periods that presented challenges:
Feb-May: Witnessed four consecutive losses, averaging -60.9% in returns.
Aug-Nov: Endured eight consecutive losses, with an average return of -48.1%.
Ending on a Strong Note:
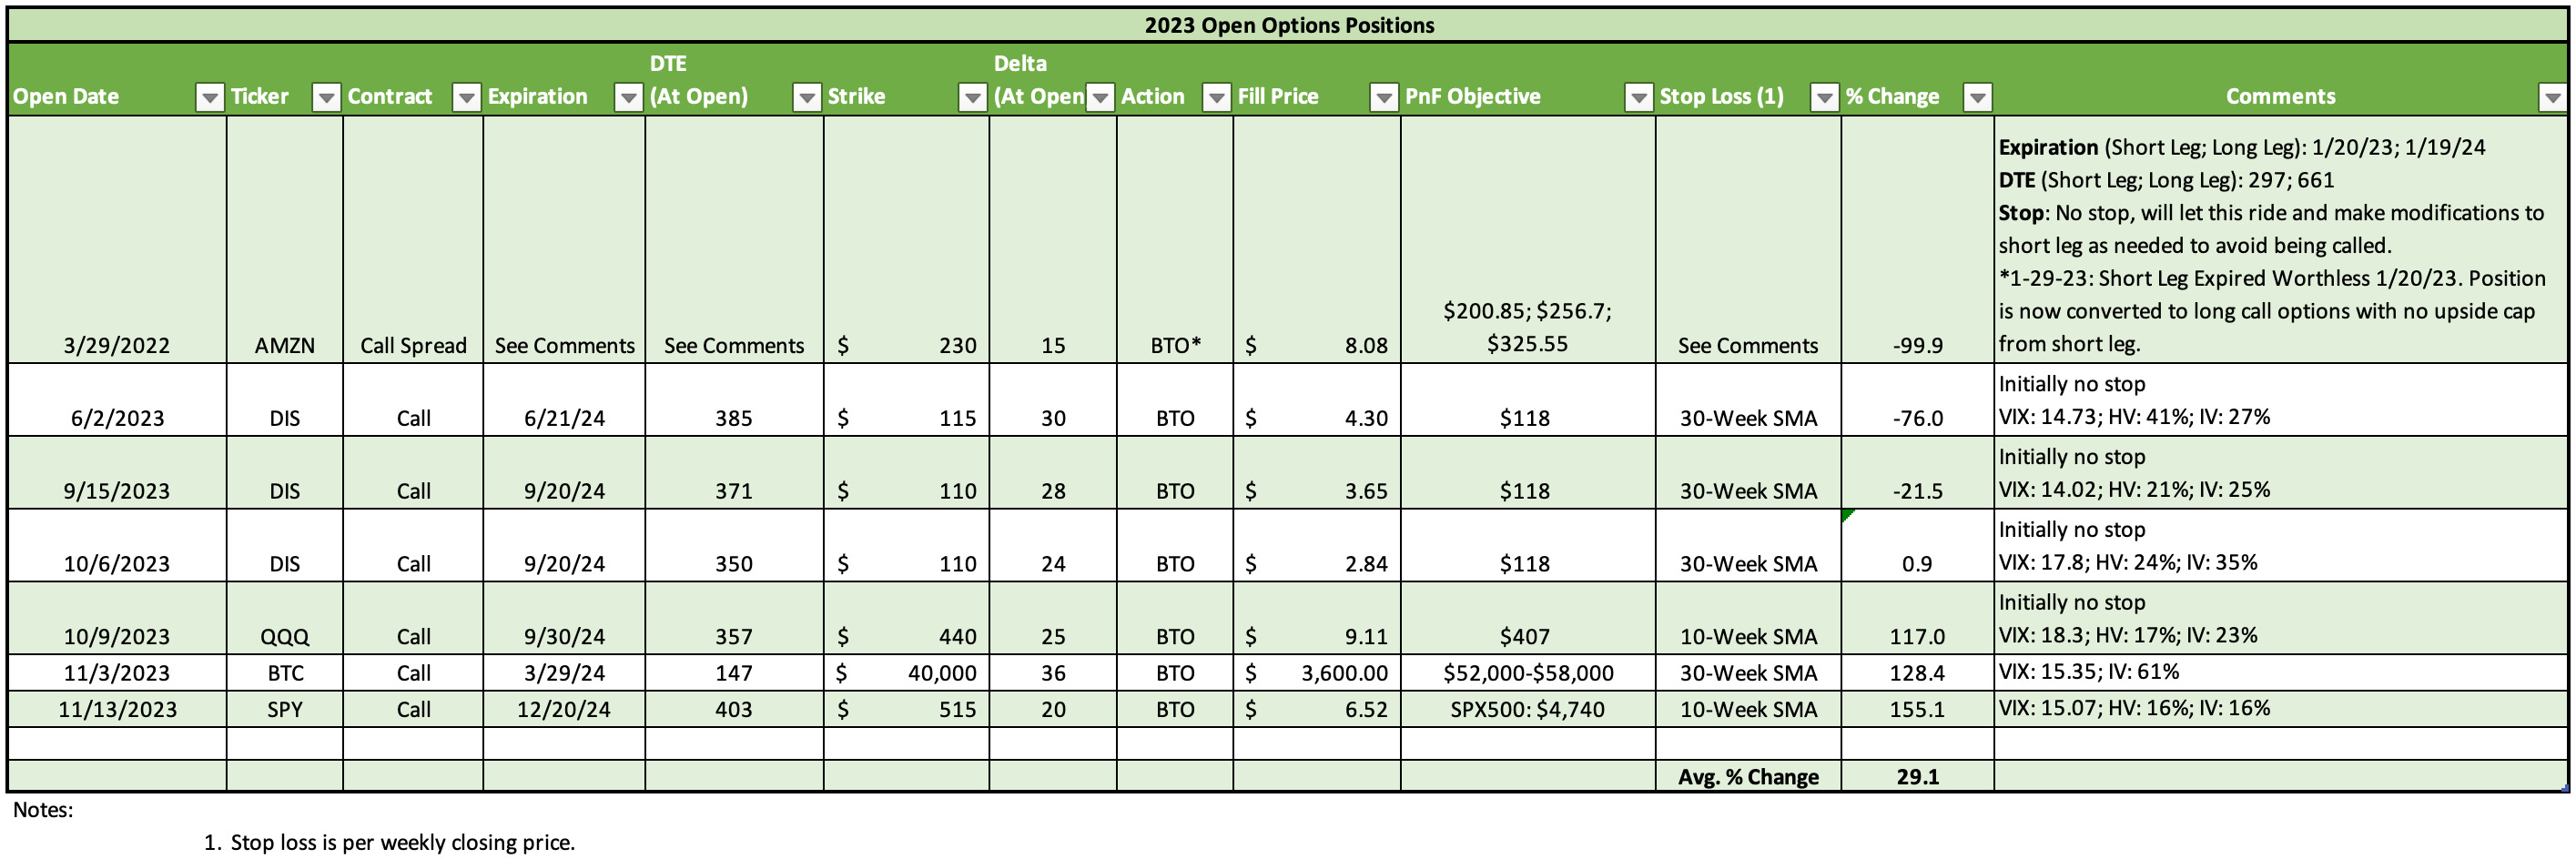
The year concluded on a strong note with three trades initiated between October and November, each currently open and showing an impressive average return of +133.5%. In my trading system, achieving a 'double' – a 100% return on a trade – is particularly significant. Each 'double' effectively compensates for a total loss, or balances out several trades with -33% losses, playing a crucial role in the overall strategy.
This highlights the dynamic and fluctuating nature of options trading, where a combination of strategic planning and adaptability can lead to significant outcomes.
For a full overview of all the trades from 2023, please see the detailed record that follows.
Closed:
Open:
Final Reflections
Since launching our portfolio service in June 2020, the journey has evolved in unexpected ways. Responding to subscriber interest, options trading was introduced three months in, with the first options trade executed on September 24, 2020.
In 3.2 years, 112 trades were made, averaging a 120-day holding period and yielding an annualized return of 17%, outperforming the SPX's 12% in the same period. These results reflect my trading approach and strategy.
I hope this service has been both beneficial and informative. For long-term subscribers, your continuous support has been crucial and is greatly appreciated.
Today marks the end of the paid service on Substack. Pro-rated refunds are being processed through Stripe and should be completed within about 10 business days. For any concerns regarding refunds, please contact me at (chartsforfreedom@gmail.com).
While I will be pausing these regular updates for the foreseeable future, I invite you to continue following my journey and insights on social media. You can find me on X (@TraceBustaChart) and on StockTwits (@TraceBusta). Although my time may be limited, I plan to stay as active as possible on these platforms, sharing thoughts and observations when feasible.
Thank you once again for your support and engagement. It's been a journey filled with learning and growth, and I'm grateful to have shared it with you.
